Probe Mapping Between Microarray and RNA-seq
By Dr. Zubair Khalid, DVM, MS, PhD ·

Probe mapping between microarray and RNA-seq is the process of deciding exactly which transcript sequences each microarray probe measures, and then relating those sequences to the read counts that RNA-seq produces for the same transcripts. Most cross-platform comparisons fail here before any statistics run. The single most common cause of an unusable comparison is bridging the two platforms through gene symbols alone. A gene symbol hides everything that matters: how many probes target the gene, where those probes sit on the transcript, which transcript isoforms they cover, and whether the probe sequences still exist in the current reference assembly.
The first thing to check, before you touch a statistics package, is whether each microarray probe actually aligns to the representative transcript you are using for the RNA-seq side of the analysis. If a 25-mer probe from a 2007 annotation no longer matches the current transcript model, or matches it in a region that the RNA-seq library never captured, the two platforms were never measuring the same molecule and no amount of normalization will repair the comparison.
This article walks through probe mapping between microarray and RNA-seq as a troubleshooting workflow. It covers the causes of cross-platform failure from most common to rarest, a diagnostic table you can scan quickly, a step-by-step diagnostic sequence, the concrete solutions that published pipelines have validated, and the prevention practices that keep the next dataset from failing the same way.
What Probe Mapping Actually Means
A microarray probe is a short synthetic DNA sequence, typically 25 nucleotides on Affymetrix arrays and 50 to 60 nucleotides on Illumina and Agilent arrays, printed or synthesized at a known spot on the array. A probeset is a group of probes that the manufacturer declares to measure one transcript or one gene. On modern Affymetrix arrays these groups are called transcript clusters or gene-level probesets. RNA-seq, by contrast, produces millions of short reads that are aligned to a reference genome or transcriptome, and expression is summarized as counts or transcript-per-million estimates per gene or per transcript.
Probe mapping is the layer that connects the two. For each probe or probeset you need to know:
- The exact probe sequence as synthesized, not the sequence in a stale annotation file.
- The genomic coordinates that sequence aligns to, including whether it aligns uniquely.
- Which transcript isoforms contain that aligned region.
- Whether the probe spans an exon-exon junction, a single exon, or a region that overlaps a common single nucleotide polymorphism.
When this mapping is correct, a probeset and an RNA-seq gene are both proxies for the same set of transcripts. Yu and colleagues formalized this idea as the "transcript pattern", which identifies probesets across platforms that target a common set of transcripts for a specific gene. Using transcript patterns, they reduced a broad multi-platform comparison to a well-defined subset of 7,034 RefSeq genes, down from 15,442 RefSeq genes shared across platforms by gene name alone [1]. That distinction is the heart of the whole topic. Genes shared by name are not the same as transcripts measured in common.
The Most Likely Cause and the First Check
The most common failure in cross-platform work is annotation drift. Microarray probe annotations were frozen when the array was designed, often more than a decade ago, against an older genome assembly and an older gene catalog. Your RNA-seq analysis almost certainly used a current GENCODE or RefSeq release. If you join the two result tables on a gene symbol or an Entrez ID, you silently mix two different definitions of nearly every gene.
The first check is therefore a sequence-level reality check, not a metadata check. Take ten genes that drive your main result. For each one, extract the probe sequences from the manufacturer probe table, align them to the current reference transcriptome, and ask three questions. Does the probe align? Does it align uniquely? Does it align to the same isoform that your RNA-seq counting model includes? In practice, when a cross-platform comparison looks worse than expected, a noticeable fraction of the discrepant probesets fail one of those three questions.
A concrete warning sign is when the technology-gap correlation, the Spearman correlation between platforms for genes that should agree, lands around 0.4 or 0.5 when well-matched platforms measured on the same samples should reach much higher. Correlations in that range almost always reflect a mapping problem rather than a biology problem, because true platform differences are far smaller than the noise introduced by comparing different transcripts. Yu and colleagues showed that once comparisons were restricted to well-defined transcript patterns, the core similarities across six platforms, including two RNA-seq protocols and four microarray platforms, were substantial [1].
Root Causes of Probe Mapping Failure, Ranked
1. Annotation version mismatch
The probe annotation shipped with the array, or with the Bioconductor annotation package, reflects the genome and transcript catalog available at design time. Gene models change. Transcripts get merged, split, retired, or reclassified as non-coding. If you map probes with the original annotation and count RNA-seq reads with a new annotation, the two gene universes differ, and the overlap analysis inherits that difference as fake biology. This is also the failure mode that AnyExpress was built to address. Its authors note that existing cross-platform tools were tightly coupled to reference information such as the reference genome, the transcriptome database, and known SNPs, and that this reference information is often erroneous or outdated, which makes the output results incorrect and misleading [2].
2. One gene, many probesets, and gene-symbol collapsing
A single gene on a common Affymetrix array can be represented by several probesets with different reliability, different isoform coverage, and different hybridization behavior. Collapsing all of them to one gene-level value, or picking one arbitrarily, destroys the link to the RNA-seq side, where your count matrix already reflects one defined transcript model. The fix is to choose, per gene, the probeset whose target sequence set best matches the transcript set your RNA-seq quantification used. The transcript pattern framework exists precisely to make that choice principled rather than ad hoc [1].
3. Probe placement within the transcript
Microarray probes are not distributed evenly along transcripts. Many legacy arrays concentrate probes toward the 3' end, which means probe signal reflects the abundance of the 3' region, including its specific polyadenylation usage. RNA-seq counting, especially with a gene-level counting workflow, reflects the whole transcript body. When a gene has multiple polyadenylation sites or tissue-specific isoforms, the two measurements genuinely diverge. Merrick and colleagues compared RNA-seq and microarray on aflatoxin B1-treated rat liver and identified 1,026 differentially expressed transcripts by RNA-seq at greater than two-fold change and p less than 0.005, compared with 626 transcripts by microarray, and they attributed the difference to base pair resolution of transcripts by RNA-seq, probe placement within transcripts, and the absence of probes for novel transcripts, splice variants, and exons [3]. Probe placement is not a bug you can patch, but you can account for it by restricting cross-platform claims to probes whose placement matches your RNA-seq feature definitions.
4. Splice junctions are invisible to exon probes
Probe-based measurement of alternative splicing requires probes that span exon-exon junctions. If your biological question is splicing, ordinary gene probesets cannot answer it, and mapping reads to a genome alone will not bridge to junction-specific array data either. Srinivasan and colleagues built SPEventH, a database representing probe sequences of just under one million non-redundant human splice events, with exon-exon junction sequences of optimized length, and used it as a virtual microarray. Mapping tens of millions of prostate tumor and matched normal RNA-seq reads to these junction probe sequences, they identified 61 splice events that were differentially expressed with a p-value below 0.0001 and a fold change above 1.5 in tumor compared with matched normal tissue [4]. The lesson generalizes. Any junction-aware cross-platform comparison must define the junction probe sequence explicitly and align reads to it directly.
5. Probe sequences that do not exist in the reference genome
Probe designers used the reference genome available at design time. Your RNA-seq reads are aligned to the current reference. Sequences present in real human populations but absent from the reference genome create a quiet bias in both directions. Liu and colleagues systematically identified 309 common sequences, present in at least 1 percent of the human population but absent from the human reference genome, using pooled next-generation sequencing data from the 1000 Genomes Project, and confirmed 76 percent of them by comparison to other primate genomes, individual human genomes, and gene expression data [5]. Because the reference genome is used both for microarray probe design and for RNA-seq read mapping, missing sequence is a shared blind spot. A probe sitting on a missing sequence can appear to measure a gene while hybridizing to related paralogous sequence, and reads from the real locus can misplace themselves. This is a rare but real cause of probesets that behave irreconcilably across platforms.
6. Platform-level detection bias by gene class
Some failures are not per-gene accidents but systematic biases tied to gene function. Zhang and colleagues analyzed housekeeping genes across 9 microarray and 6 sequencing studies and found a subset of transcripts encoding membrane, cell surface, and nuclear proteins that were prone to differential identification between the two platforms [6]. Membrane and secreted protein transcripts have sequence properties, such as short or repetitive coding features and 3' structure, that affect probe hybridization differently from read alignment. If your cross-platform discrepancy list is enriched for membrane and surface protein genes, suspect platform bias rather than an individual mapping error, and treat those genes as a known sensitivity class in your interpretation.
7. Cross-hybridization and multi-mapping probes
A 25-mer probe can hybridize to transcripts from paralogous gene family members. During array design the manufacturer filtered many of these, but re-annotation against a current assembly routinely reopens them. On the RNA-seq side, multi-mapping reads create the mirror-image problem. The intersection of the two errors produces the worst cases, where a probeset signal and a gene count both borrow signal from relatives of the target gene. Confirm by aligning every probe sequence to the whole genome and flagging probes with strong secondary alignments.
8. Non-model species and assembly mismatch
When the species has no mature reference, de novo transcriptome assemblies replace the reference, and probe mapping becomes the quality criterion for the assembly itself. Carvajal-Lopez and colleagues mapped microarray hybridized probes to alternative de novo assemblies of mouse and fruit fly RNA-seq data and showed that the assembly with the best probe mapping to the available reference transcriptomes was the highest quality assembly. A subtle probe mapping difference of 0.25 percent, statistically significant by ANOVA at p less than 0.05, was enough to select the assembly that identified 3,719 more contigs and mapped 1,049 further contigs to the mouse reference transcriptome, while standard quantitative assembly metrics remained inconsistent [7]. If you are in a non-model setting, probe mapping is not only the bridge between platforms, it is also one of the most sensitive assembly quality checks available.
Troubleshooting Table
| Symptom | Likely cause | How to confirm | Fix |
|---|---|---|---|
| Cross-platform Spearman correlation near 0.4 to 0.5 for genes that should agree | Annotation version mismatch or gene-symbol joining | Align probe sequences to the current transcriptome, count probes that fail or multi-map | Re-annotate probes at the sequence level and rebuild the platform bridge on transcript sets |
| One probeset per gene picked arbitrarily, results unstable under reselection | Multiple probesets with different isoform coverage per gene | List all probesets per gene and their target transcript IDs | Define transcript patterns and keep only genes where platforms target the same transcripts [1] |
| A subset of genes discordant between platforms, rest fine | Probe placement, 3' bias, or isoform specificity | Check probe genomic coordinates against the RNA-seq feature model | Restrict the comparison to concordant probe placements, or report the discordant class explicitly [3] |
| Differential splicing results impossible to compare | Gene probesets cannot see exon-exon junctions | Inspect probe coordinates for junction-spanning probes | Align RNA-seq reads to junction probe sequences in a virtual microarray design [4] |
| A handful of probesets behave irreconcilably in both platforms | Probe sequence absent from the current reference, or multi-mapping | BLAST probe sequence against the genome, check for secondary hits and absent loci | Drop the probeset, or flag it as unreliable, and record the exclusion in methods [5] |
| Discordance concentrated in membrane, surface, and nuclear protein genes | Platform-level detection bias by gene class | Enrichment test of discordant genes against GO membrane and nuclear terms | Treat that gene class as a known sensitivity and avoid cross-platform conclusions for it [6] |
| Old published microarray data disagrees with your fresh RNA-seq on the same tissue | Stale probe annotation in the deposited dataset | Check the annotation package version and its release date against the array design date | Re-annotate all probes from raw sequences before merging with RNA-seq results [8] |
| Classifier trained on one platform collapses on the other | Probes were cross-mapped by gene ID, not by sequence | Compare probe sequences against the classifier feature definitions | Cross-map probes by sequence alignment to transcript targets, then retrain or harmonize features [9] |
| RNA-seq reads fail to align to probe target sequences | Probe target sequences contain polymorphisms or were drawn from retired transcript models | Inspect per-base alignment mismatches and unmapped probe targets | Rebuild target FASTA from current transcriptome, mask SNPs if population-specific |
| De novo assembly comparison gives inconsistent quality metrics | Assembly selection without an external calibration signal | Map available microarray probes to each assembly and compare mapping rates | Use probe mapping rate as the assembly selection criterion [7] |
A Diagnostic Sequence You Can Follow
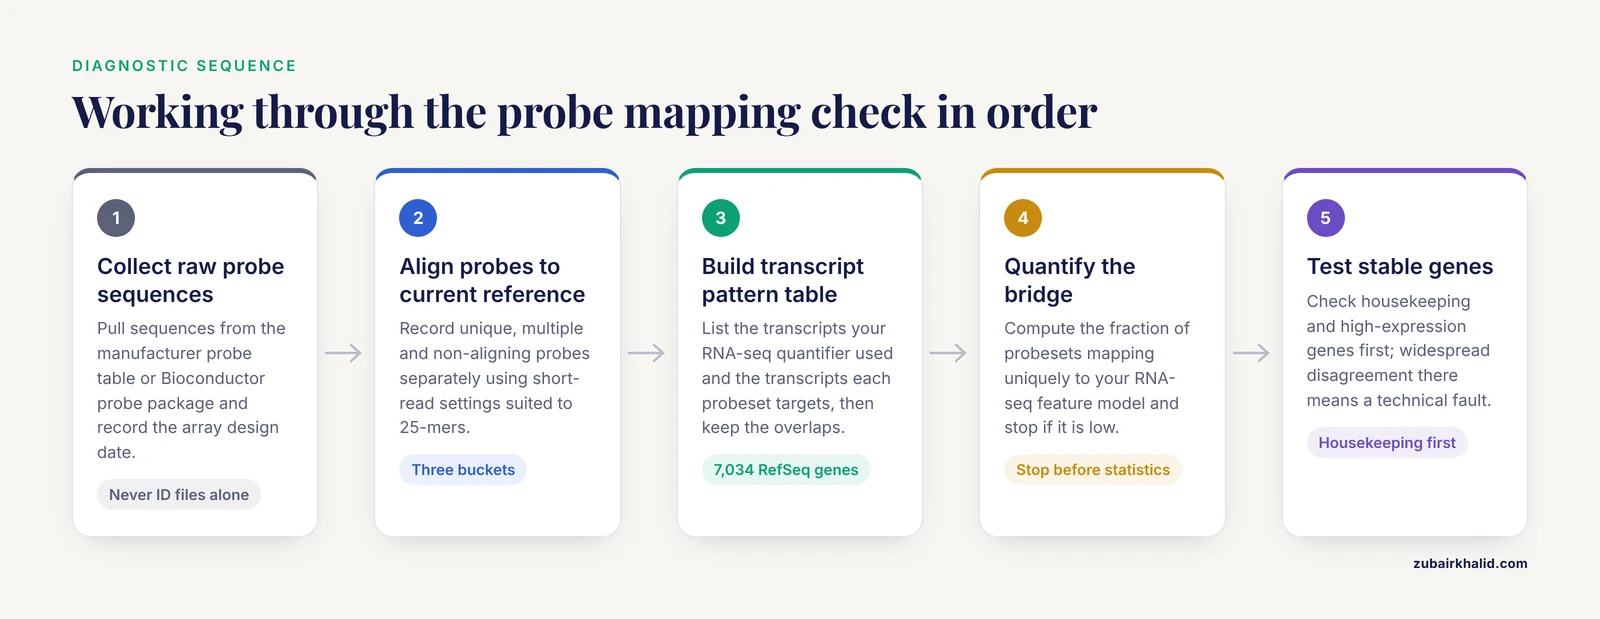
Work through these steps in order. Each step either fixes a class of error or eliminates one from consideration.
- Collect the raw probe sequences. Use the manufacturer probe table or the sequence fields in the Bioconductor probe package, never a third-party ID conversion file alone. Record the array design date.
- Align every probe sequence to the current reference genome and transcriptome. Use a short-read aligner with parameters appropriate for 25-mers, or BLAST with a word size adjusted for short sequences. Record unique, multiple, and non-aligning probes separately.
- Build the transcript pattern table. For each gene, list the transcripts your RNA-seq quantifier used and the transcripts each probeset targets. Keep genes where the two target sets overlap on the transcripts that carry the measured signal [1].
- Check junction probes if splicing is in scope. Junction measurements require junction probe sequences, so map reads to those sequences explicitly rather than inferring splicing from gene-level values [4].
- Re-annotate historical datasets. If the microarray data are from a public repository, redo the probe re-annotation from raw sequences yourself. In an Alzheimer's disease study combining GWAS with expression data, the investigators validated candidate lncRNAs by microarray probe re-annotation across 1,282 samples and RNA-seq analysis of 117 samples, and that dual re-annotated validation was central to identifying five key lncRNAs [8].
- Quantify the bridge. Compute the fraction of probesets that map uniquely to transcripts in your RNA-seq feature model. If that fraction is low, stop and fix the mapping before any statistics.
- Test concordance on stable genes. Housekeeping genes and high-expression genes should agree between platforms. Widespread disagreement on these genes points to a technical mapping error rather than biology [6].
- Look for structure in the residuals. Cluster the discordant genes and check for GO enrichment. Enrichment for membrane, cell surface, and nuclear proteins indicates platform bias you should acknowledge rather than chase [6].
- Drop or flag unrecoverable probesets. Probes with no current alignment, multi-locus probes, and probes on sequences absent from the reference genome should be excluded or flagged, and the exclusion rule documented [5].
- Validate the bridge with a titration or a gold standard. If qRT-PCR data or a sample titration series exists for even a subset of genes, use it to confirm that fold changes agree across the mapped platforms [1].
Solutions That Published Pipelines Have Validated
Map RNA-seq reads directly to probe target sequences
The most direct solution inverts the usual alignment step. Instead of mapping probes onto the transcriptome and reads onto the genome, map the sequencing reads directly to the probe set target sequences. Pedersen and colleagues built an RNA-seq processing pipeline for breast cancer that maps reads to the probe set target sequences instead of the human reference genome, enabling probe-based subtyping with sequencing data. Analyzing 66 breast cancer tumors measured on both platforms, they showed RNA-seq data could be compared directly to microarray data through this route, and the established CITBCMST subtyping method, which relies on a 375 probe set signature to classify samples into the six subtypes basL, lumA, lumB, lumC, mApo, and normL, could be applied without further modification [10]. This approach sidesteps most annotation drift, because the probe sequences themselves, not their historical annotation, define the feature space. If your end goal is to apply a microarray-derived signature to RNA-seq data, this is usually the cleanest fix.
Use transcript patterns to define the comparable gene set
When you must compare gene-level values across platforms, restrict the analysis to genes where both platforms target the same transcripts. The transcript pattern approach reduced the comparable universe from 15,442 RefSeq genes shared by name to 7,034 RefSeq genes with verified transcript-level agreement, and within that subset the cross-platform concordance of raw signal, fold change under sample titration, and agreement with TaqMan qRT-PCR was substantially improved [1]. The cost is a smaller gene set. The benefit is that the genes you keep can actually support a cross-platform claim.
Use interval matching to merge heterogeneous platforms
For projects that combine microarray, RNA-seq, SAGE, or MPSS data, a general interval matching framework avoids per-platform one-off scripts. AnyExpress uses a fast interval matching algorithm to combine cross-platform gene expression data, supports custom target transcriptome references and filtering criteria for undesirable probes or reads, and provides binding, normalization, and summarization. In its published case study on human kidney and liver, the mean within-platform correlation coefficient was 0.98 for Affymetrix microarray and Illumina RNA-seq samples [2]. The design principle is the transferable part. Define the target interval on the transcriptome, map every platform's features to that interval, and summarize at the interval level.
Build virtual microarrays for questions arrays were designed to answer
When the historical microarray design encodes knowledge that plain RNA-seq analysis loses, reconstruct the probe concept in sequence space. The SPEventH virtual microarray did this for splicing, encoding exon-exon junction probe sequences for nearly one million splice events and mapping RNA-seq reads to them, which recovered tumor-specific splice events in prostate cancer that junction-spanning read counting alone would have needed extra machinery to interpret in the same framework [4]. The same pattern applies wherever legacy array designs carry biology, such as exon-junction arrays or array designs targeting specific non-coding transcripts.
Cross-map probes by sequence when transferring classifiers
Clinical classifiers developed on microarrays are increasingly applied to RNA-seq cohorts. Feature transfer by gene symbol is fragile. In an acute myeloid leukemia study, probes were cross-mapped between the microarray and RNA-seq platforms to test a diagnostic classifier. The classifier trained on same-platform probes reached 98.9 percent accuracy, 98.7 percent sensitivity, and 100 percent specificity on the RNA-seq dataset, and when opposite-platform probes were used after cross-mapping, classifier reliability on the microarray dataset increased significantly [9]. The transferable message is that cross-mapping must be validated as a distinct step, with its own accuracy check, before the classifier result is trusted.
Prefer platform-independent feature selection for signatures
If you are building a new signature rather than reusing an old one, select features that behave consistently across platforms from the start. A study of sessile serrated adenomas and hyperplastic polyps trained an RNA-seq classifier from GEO data and tested it on Affymetrix and Illumina microarray data, developing a feature selection step and a classification procedure specifically to build a platform-independent molecular classifier [11]. The RNA-seq side used the TopHat and Cufflinks pipeline with read mapping to the human genome, while the microarray side used RMA background correction, normalization, and probe summarization for Affymetrix arrays and log2-scale expression for Illumina arrays. Building the bridge into feature selection is cheaper than repairing it afterward.
Use re-annotation plus dual-platform validation for discovery
For discovery studies that combine old microarray cohorts with new sequencing cohorts, probe re-annotation of the microarray side is the non-negotiable step. The Alzheimer's disease lncRNA study cited above re-annotated 1,282 microarray samples and analyzed 117 RNA-seq samples in parallel, using both platforms as independent validation layers for candidate lncRNAs before functional prediction [8]. The scale of agreement achievable with this discipline, across more than a thousand historical samples, is the practical argument for doing re-annotation properly rather than trusting shipped annotation files.
Use probe mapping as an assembly quality gate in non-model species
In species without a mature reference, map your available microarray probes onto each candidate de novo assembly and use the mapping rate to choose between assemblies. The mouse and fruit fly study showed that probe mapping detected assembly quality differences that inconsistent quantitative metrics missed, with a 0.25 percent mapping difference identifying an assembly that yielded 3,719 additional contigs [7]. This doubles as your platform bridge, because the assembly that best accepts the probes is also the assembly against which cross-platform comparisons will be most coherent.
A Worked Workflow With Real Commands
The following workflow implements the sequence-level bridge for an Affymetrix-style array and paired-end human RNA-seq. Adapt names and versions to your own setup.
Step 1, extract probe sequences. In R, pull the probe table from the Bioconductor probe package for your array. Each probe ID carries a sequence and a probeset membership.
library(hgu133plus2probe)
probes <- hgu133plus2probe
write.csv(probes, "probe_sequences.csv", row.names = FALSE)
Collapse probes to probeset consensus targets if the array design provides target sequences, or concatenate member probes with their positions so you can reconstruct placement later.
Step 2, build probe targets and align reads. Create a FASTA of probe target sequences, index it, and align the RNA-seq reads to it directly.
bowtie2-build probe_targets.fa probe_idx
bowtie2 -x probe_idx -1 sample_R1.fq.gz -2 sample_R2.fq.gz \
  -S reads_vs_probes.sam
samtools sort -o reads_vs_probes.bam reads_vs_probes.sam
samtools index reads_vs_probes.bam
This is the probe-target alignment strategy validated for breast cancer subtyping, where reads mapped to probe set target sequences allowed a microarray signature to be applied to RNA-seq data directly [10].
Step 3, count per probeset. Treat each probeset as a feature. Generate a GTF-like file where each probeset is a "gene" with its target coordinates, then count reads per feature.
featureCounts -p -t gene -g gene_id \
  -a probeset_targets.gtf -o probeset_counts.txt reads_vs_probes.bam
Step 4, check the reverse direction. Align each probe sequence to the current genome to verify uniqueness and placement.
blastn -query probe_sequences.fa -db GRCh38_genomic \
  -outfmt "6 qseqid sseqid pident length sstart send" \
  -out probe_genome_hits.tsv
Flag probes with multiple strong hits or no hit at all.
Step 5, reconcile gene identifiers with the transcript model in hand. Use biomaRt against the current Ensembl release, pull every relevant identifier, and check how many-to-one the mapping is.
library(biomaRt)
mart <- useEnsembl("ensembl", dataset = "hsapiens_gene_ensembl")
map <- getBM(attributes = c("affy_hg_u133_plus_2",
                            "ensembl_gene_id",
                            "ensembl_transcript_id",
                            "hgnc_symbol"),
             mart = mart)
multiple <- map$affy_hg_u133_plus_2[duplicated(map$affy_hg_u133_plus_2)]
Every duplicated probeset ID is a decision point, not a row to average blindly. Resolve each one by transcript overlap with your RNA-seq feature model, following the transcript pattern logic [1].
Step 6, normalize and compare. Normalize within each platform on its own scale, then compare fold changes rather than absolute values, since microarray intensity and RNA-seq count scales are not interchangeable. Restrict primary conclusions to the transcript-pattern subset and report the excluded fraction.
A safety note on reprocessing arrays. If your troubleshooting extends to regenerating microarray signal from original hybridizations, standard hybridization buffers contain formamide, which is a reproductive toxicant. Handle hybridization mixtures in a chemical fume hood with nitrile gloves and eye protection, and follow your institution's chemical hygiene plan for waste disposal. Sequence-level probe mapping work itself carries no reagent hazard.
Common Mistakes and Limitations
Joining tables on gene symbols. Gene symbols change, refer to different identifiers over time, and are not one-to-one with probesets. This single habit produces most irreproducible cross-platform comparisons.
Trusting shipped annotation files for old datasets. A 2007 annotation applied to a 2026 transcriptome is wrong in both directions. Re-annotate from raw probe sequences every time, as done across 1,282 samples in the Alzheimer's disease lncRNA study [8].
Averaging probesets within a gene. Probesets differ in isoform coverage and quality. Averaging them produces a value measured on no real transcript. Select one probeset, justified by transcript overlap, or use transcript patterns.
Interpreting absolute intensities against counts. Microarray fluorescence and RNA-seq counts have different dynamic ranges and error structures. Compare fold changes, ranks, and classification concordance, not raw values.
Assuming probe placement is neutral. Probe placement within transcripts was explicitly identified as a reason RNA-seq found more differentially expressed transcripts than microarrays in the rat liver study, 1,026 versus 626 [3]. Placement drives real, directional disagreement.
Forgetting that the reference genome itself has gaps. Common population sequences absent from the reference, 309 of which were cataloged in one systematic survey [5], affect both probe design and read mapping. A small set of probesets may be unrecoverable in principle, and that is a finding to document, not a bug to force-fix.
Over-interpreting discordance in specific gene classes. Membrane, cell surface, and nuclear protein transcripts are systematically prone to differential identification between the platforms [6]. Discordance clustered there is a property of the technology pair, not a clue about your disease mechanism.
Applying a cross-platform classifier without validating the mapping step. Cross-mapped features need their own accuracy assessment, as the AML classifier work demonstrated when opposite-platform probes measurably changed classifier reliability [9].
Expecting splicing answers from gene-level data on either platform. Gene probesets and gene-level counts both average over isoforms. Junction comparisons need junction-level features by construction [4].
Individual experimental decisions, including study design and interpretation in a specific disease context, require a subject-matter collaborator and, in clinical settings, appropriate professional oversight.
Prevention Practices
Anchor everything to sequences. Keep a canonical table of raw probe sequences for every array you use, with the assembly and transcript release used for your current mapping. Refresh it when the transcriptome release changes.
Record annotation versions in the analysis log. Array design date, annotation package version, genome build, and transcriptome release belong in the methods section of every cross-platform paper and every internal report.
Build the transcript pattern table once per project. Reuse it for every downstream analysis on that project so all comparisons share the same comparable gene universe [1].
Freeze the probe exclusion list. Once you identify non-aligning, multi-mapping, and cross-hybridizing probes, freeze the list, version it, and apply it identically across all datasets in the project.
Validate on housekeeping genes first. Before interpreting biology, confirm that high-expression housekeeping genes agree across platforms. Systematic disagreement there signals a technical fault [6].
Design new studies for the bridge you will need. If a future RNA-seq comparison is foreseeable, choose probesets whose targets match current, well-supported transcript models, and avoid probes on regions known to vary in the population [5].
For non-model species, treat probe mapping rate as a standing assembly QC metric. It is sensitive, cheap, and uses data you already have [7].
Document every exclusion. A cross-platform comparison with an explicit, reproducible exclusion rule is more defensible than a larger comparison with silent losses.
Frequently Asked Questions
Why do RNA-seq and microarray expression values disagree for the same gene?
Usually because the two platforms are measuring different transcripts of that gene, or because the probe annotation is stale relative to the transcriptome used for RNA-seq counting. Sequence-level probe mapping against the current transcriptome resolves most of the disagreement.
Can I map RNA-seq reads directly to microarray probe sequences?
Yes. Aligning sequencing reads to the probe set target sequences instead of the reference genome is a validated strategy and allowed a 375 probe set breast cancer subtyping signature to be applied to RNA-seq data without modification across 66 tumors measured on both platforms [10].
How do I convert microarray probe IDs to gene identifiers safely?
Extract the raw probe sequences, align them to the current reference, and map through transcripts rather than through lookup tables. Accept that some probesets map to multiple genes and some to none, and exclude or resolve them explicitly rather than averaging.
What is a transcript pattern and why does it matter?
A transcript pattern identifies probesets across platforms that target a common set of transcripts for a specific gene. Restricting comparison to genes with matching transcript patterns shrinks the gene set but makes the remaining cross-platform comparisons well defined [1].
Should I re-annotate old public microarray data before combining it with RNA-seq?
Yes. Re-annotate from raw probe sequences every time. Large-scale re-annotation across 1,282 microarray samples paired with 117 RNA-seq samples was central to validating candidate lncRNAs in an Alzheimer's disease study [8].
Why do membrane and nuclear protein genes show platform differences?
Certain transcripts encoding membrane, cell surface, and nuclear proteins were found to be prone to differential identification between microarray and sequencing platforms, based on analysis of housekeeping genes across 9 microarray and 6 sequencing studies [6]. Treat that gene class as a known sensitivity of the technology pair.
Can cross-mapped probes support a classifier that works on both platforms?
Yes, if the cross-mapping is done by sequence and validated on its own. In an AML study, a cross-mapped probe classifier raised accuracy on the microarray dataset substantially, while the same-platform classifier reached 98.9 percent accuracy, 98.7 percent sensitivity, and 100 percent specificity on RNA-seq data [9].
How many probes need to match before I trust a cross-platform analysis?
There is no universal threshold. The useful number is the fraction of probesets that map uniquely to the transcripts your RNA-seq model quantifies, evaluated on your array and your transcriptome release. Stability under reselection matters more than any fixed percentage, and even a 0.25 percent difference in mapping can be decisive when selecting assemblies or probesets [7].
Sources
- Multi-platform assessment of transcriptional profiling technologies utilizing a precise probe mapping methodology.
- AnyExpress: integrated toolkit for analysis of cross-platform gene expression data using a fast interval matching algorithm.
- RNA-Seq profiling reveals novel hepatic gene expression pattern in aflatoxin B1 treated rats.
- Genome-wide Profiling of RNA splicing in prostate tumor from RNA-seq data using virtual microarrays.
- Discovery of common sequences absent in the human reference genome using pooled samples from next generation sequencing.
- Membrane gene ontology bias in sequencing and microarray obtained by housekeeping-gene analysis.
- Microarray-Based Quality Assessment as a Supporting Criterion for de novo Transcriptome Assembly Selection.
- Identification of Key Long Non-Coding RNAs in the Pathology of Alzheimer's Disease and their Functions Based on Genome-Wide Associations Study, Microarray, and RNA-seq Data.
- Comparative Analysis of High-Throughput Data in AML Detection.
- Using microarray-based subtyping methods for breast cancer in the era of high-throughput RNA sequencing.
- Platform-independent gene expression signature differentiates sessile serrated adenomas/polyps and hyperplastic polyps of the colon.