Comparing Data Management Platforms for Genomics
By Dr. Zubair Khalid, DVM, MS, PhD ·

Genomics data management platforms differ mainly in where the data lives, who controls the compute, and how much of the analysis lifecycle the platform owns. The rule of thumb for choosing one is simple. Pick the platform type that matches your dominant data type and your reproducibility obligations first, then evaluate features. A metagenomics consortium, a hospital molecular laboratory, and an academic core facility face different constraints, so the best genomics data management platform comparison options for one group will rarely be right for another.
This article compares the major platform archetypes on their own terms, then weighs them on the criteria that decide real purchasing and design choices. It closes with worked scenarios, common mistakes, and direct answers to frequent questions.
What a Genomics Data Management Platform Does
A genomics data management platform is the combined system of storage, metadata, compute, and analysis tooling that moves data from instrument output to interpretable result. The term covers more than genomics data storage. Storage answers the question of where the bytes live. Bioinformatics data management answers harder questions. Which sample produced this file. Which version of the reference genome was used. Which pipeline, with which parameters, generated this variant call. Who has permission to see and modify it.
Genomic data moves through distinct layers, and a platform can manage one layer or all of them.
- Raw reads. Unaligned sequence output from the instrument, typically FASTQ files with per-base quality scores.
- Alignments. Reads placed onto a reference genome, stored in formats such as BAM or CRAM.
- Variant and feature calls. Derived results such as VCF files for variants, count matrices for RNA sequencing, or peak files for chromatin assays.
- Annotations and metadata. Gene models, functional annotation, and the sample-level information that makes every other layer interpretable.
Two observations from the literature frame why platform choice matters. First, the growth of data acquisition technologies has shifted the bottleneck in genomics from generating data to analyzing and managing it. Software originally built for single genes now confronts whole genomes and population-scale studies, which demands new data-management strategies rather than new sequencers [1]. Second, the flood of data from publicly available genomes and high-throughput experiments created questions that single databases cannot answer, such as comparing genes, genomes, and expression profiles across heterogeneous sources, which drove early work on integrated platforms for systems biology [2].
A useful mental model divides platforms by the question they were built to answer. Some platforms integrate heterogeneous data into a coherent schema. Some reanalyze public data at a scale no individual lab can match. Some host computation in the cloud so users need no local infrastructure. Some wrap a specific domain in a ready-made pipeline. Some aggregate a field's scattered results into one browsable resource. Some specialize in visualization. Some guarantee that the same inputs produce the same outputs on any machine. Comparing data management platforms for genomics is largely a matter of deciding which of these jobs is yours.
The Main Options in a Genomics Data Management Platform Comparison
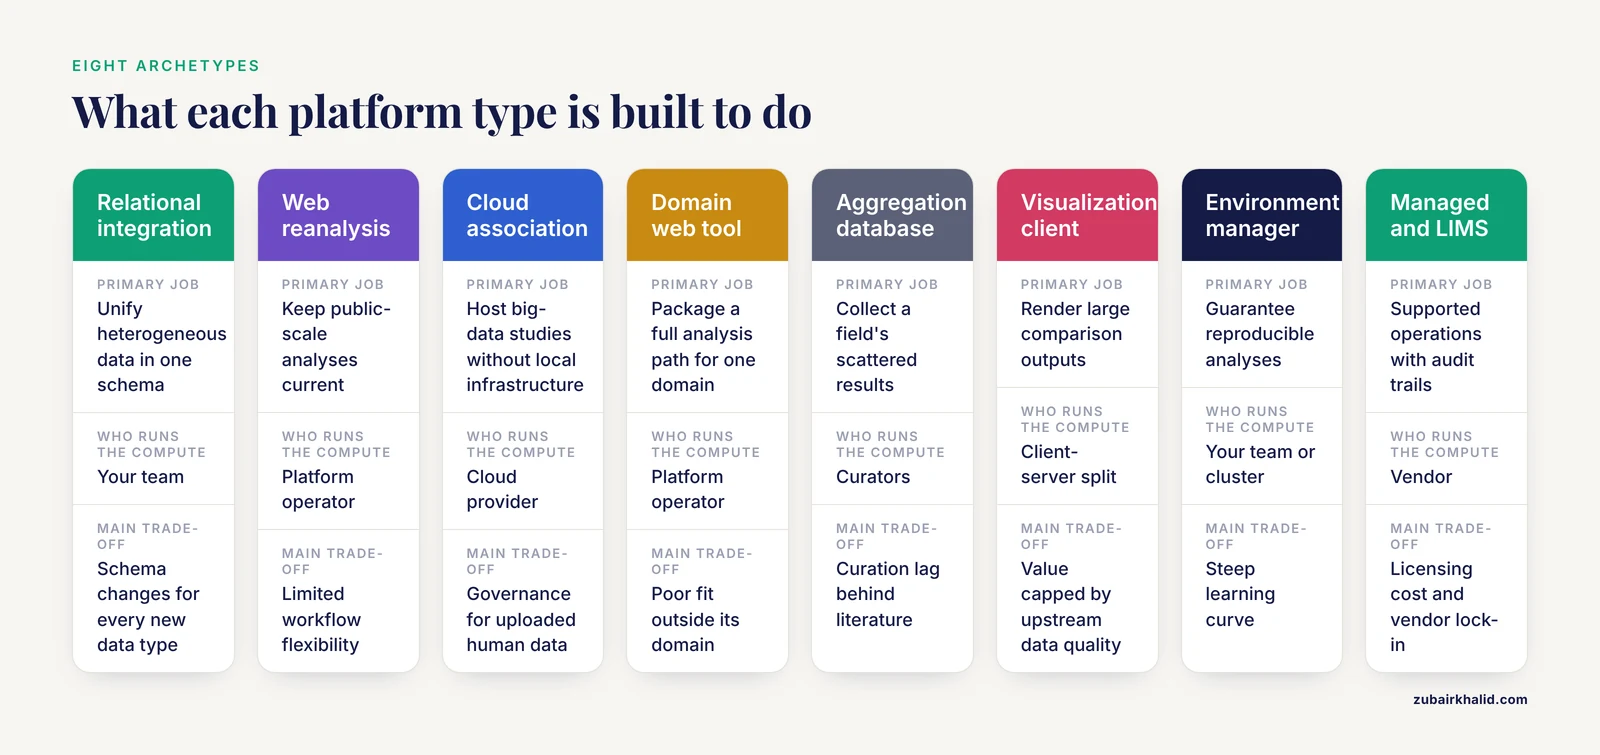
The following eight archetypes cover nearly every system you will encounter under the label of a genomics data management platform. Each is explained on its own terms before the side-by-side comparison.
Relational Integration Platforms
Relational integration platforms place heterogeneous data types into a single, deliberately designed schema, usually backed by a relational database. BRIDGE, the Bioinformatics Resource for the Integration of heterogeneous Data from Genomic Explorations, is a documented example. Its designers built a flexible framework for combining variable data sources into a platform for systems biology, and demonstrated it with two sample applications that combined genome, gene, and expression data [2].
The strength of this archetype is control. Because the schema is designed up front, cross-data-type queries become straightforward. You can ask for all genes in a pathway, their expression values in a condition, and their orthologs in another species in one query rather than three exports and a spreadsheet. The trade-off is rigidity. Every new data type, whether a new assay chemistry or a new annotation standard, requires schema changes and migration work. Integration platforms reward teams that know their data model well and punish teams whose data types change every year.
Large-Scale Web-Based Reanalysis Platforms
Reanalysis platforms solve a different problem. As reference databases grow and methods improve, previously analyzed public datasets become inconsistent with newer analyses, and keeping everything up to date requires computational resources far beyond what most laboratories can devote. The KAUST Metagenomic Analysis Platform (KMAP) addresses this bottleneck directly. It re-assembled approximately 27,000 public metagenomic samples from around 450 studies spanning roughly 77 diverse habitats, and organized the results into 36 habitat-specific gene catalogs built from full-length genes, covering more than 275 million genes. Its Gene Information Tables (GITs) store extensive taxonomic and gene annotations in a simple format that works both for command-line analysis and for database management [3].
The strength of this archetype is that the platform operator absorbs the reanalysis burden. Users explore consistently processed data instead of reassembling it themselves. The trade-off is analytical control. The assembly parameters, gene prediction methods, and annotation databases belong to the platform, and if your question requires a nonstandard workflow you are back to local compute.
Cloud Platforms for Big-Data Association Studies
Cloud analysis platforms move both data and computation to remote infrastructure, so users need no local cluster. Neuroimaging PheWAS illustrates the pattern. It is a web-based system for phenome-wide association studies, which test a single genetic variant against many imaging phenotypes at once rather than testing one phenotype at a time. The platform provides a graphical interface for anonymous data upload, study definition and management, interactive result visualization, and a cloud-based computational infrastructure running multiple statistical association methods with correction for multiple comparisons, demonstrated in a case study of the APOE gene and brain morphological properties [4].
The strength is accessibility. A laboratory with a laptop and a question can run analyses that would otherwise require systems administration staff. The trade-off lies in data governance. Human genomic data carries privacy obligations, and uploading it to external infrastructure requires contractual and regulatory review that small teams often underestimate.
Domain-Specific Web Tools With Built-In Pipelines
Some platforms package a complete analysis path for one organism, tissue, or industry inside a web interface. CHOmics, built for Chinese hamster ovary cell lines used in biologics production, is a clear example. It provides a built-in pipeline for RNA sequencing data processing, layered statistical modules for exploring genes and pathways, interactive visualization of outputs, and efficient data management, with the flexibility to accommodate other omics data types for multi-omics comparison at gene and pathway levels [5].
The strength is speed to result. A user uploads data and follows a designed path, and the results arrive in consistent, interpretable form. The trade-off is fit. A tool built for CHO cell lines will serve a CHO research group extremely well and a plant genetics group poorly. Domain-specific platforms succeed when your organism and question match the designers' assumptions, and fail quietly when they do not.
Community Aggregation Databases
Aggregation databases collect a field's scattered results into one resource. Before BTECH was built, data on genome, epigenome, and transcriptome alterations in brain tumors were scattered across multiple databases and the supplementary materials of publications, which made retrieval, evaluation, comparison, and visualization arduous. BTECH integrates transcript profiles, CpG methylation data, DNA copy number alterations, structural chromosomal rearrangements, gene lists, SNPs, and genomic annotations, and adds a genome browser for simultaneous visualization of the datasets, with links back to the original references [6].
The strength is breadth in one place. For hypothesis generation and literature grounding, an aggregation database with a genome browser shortens weeks of manual collection into a session. The trade-off is curation dependence. The resource is only as current as its curators, and deposits often lag the primary literature by months or longer.
Visualization and Comparison Clients
A visualization platform does not store primary data. It renders the outputs of comparisons so humans can interpret them. GECKO-MGV is a web-based client-server application for visual analysis of pairwise and multiple whole-genome sequence comparisons. It uses a layer concept to display multiple comparison datasets simultaneously, integrates other visualization tools, connects to external proprietary and third-party services for post-processing, and can display a timeline of large-scale evolutionary events [1].
The strength is interpretation at scale. Comparisons of large genomes produce outputs far too large for a spreadsheet, and a purpose-built viewer turns those outputs into readable evidence. The trade-off is dependency. A visualization client is a downstream component, and its value is capped by the quality and organization of the upstream platform that produced the comparisons.
Reproducible Pipeline and Environment Managers
This archetype attacks the reproducibility problem at its root. Computational results in bioinformatics depend on dozens of software packages, each with its own version history, and results that differ across machines undermine comparison and dissemination. PiGx takes a principled approach by building analysis pipelines on GNU Guix, a package manager that pins exact software versions and dependencies. The result is a set of highly reproducible pipelines for RNA sequencing, chromatin immunoprecipitation sequencing, bisulfite-treated DNA sequencing, and single-cell RNA sequencing, which process raw data and generate reports with publication-ready figures and interactive elements, producing consistent output from known sources regardless of the machine they run on [7].
The strength is trust. When a reviewer, a collaborator, or a regulator asks how a result was produced, the platform can answer with a pinned environment rather than a best-effort recollection. The trade-off is skill. Environment managers have a learning curve, and they assume the team can run their own compute, whether a local server or a cluster.
Managed Commercial Platforms and Laboratory Systems
The final archetype is the bundled commercial offering. Vendors combine storage, workflow execution, audit trails, and user management into a supported product, and laboratory information management systems (LIMS) track specimens, extractions, and library preparations on the wet-lab side. The defining characteristics are a vendor agreement and an audit trail rather than any single technical feature. This archetype is well suited to laboratories with regulatory reporting duties and staff who should spend time on samples rather than systems administration. Its trade-offs are licensing cost, dependence on the vendor's roadmap, and export paths that deserve scrutiny before data volumes grow large.
Side-by-Side Comparison of Genomics Data Management Platforms
| Platform type | Primary job | Data it manages best | Who runs the compute | Standout strength | Main trade-off |
|---|---|---|---|---|---|
| Relational integration platform | Unify heterogeneous data in one schema | Multi-source genomic and expression data | Your team | Precise cross-data queries | Schema changes for every new data type [2] |
| Web-based reanalysis platform | Keep public-scale analyses current | Metagenomes, gene catalogs | Platform operator | Reanalysis burden shifts off your lab | Limited workflow flexibility [3] |
| Cloud association platform | Host big-data studies without local infrastructure | Genotype and phenotype cohorts | Cloud provider | No local cluster needed | Governance for uploaded human data [4] |
| Domain-specific web tool | Package a full analysis path for one domain | The organism or assay it was built for | Platform operator | Fast, consistent results | Poor fit outside its domain [5] |
| Community aggregation database | Collect a field's scattered results | Published molecular datasets | Curators | One browsable location with a genome browser | Curation lag behind literature [6] |
| Visualization client | Render large comparison outputs | Comparison results from upstream tools | Client-server split | Interpretation of genome-scale results | Value capped by upstream data quality [1] |
| Pipeline and environment manager | Guarantee reproducible analyses | Raw reads through final reports | Your team or cluster | Pinned, traceable environments | Steep learning curve [7] |
| Managed commercial platform and LIMS | Supported operations with audit trails | Specimens, runs, workflows | Vendor | Support, compliance, reduced admin load | Licensing cost and vendor lock-in |
Pros and Cons That Decide Real Choices
Feature lists rarely decide platform selection. The following criteria do, and each one exposes a different set of pros and cons across the archetypes.
Integration and the Re-Annotation Problem
Reference databases grow continuously, and analytical methods improve alongside them. Analyses that were correct last year become inconsistent with this year's methods, and redoing them requires access to demanding computational resources [3]. This is the re-annotation problem, and it separates platform types sharply. A reanalysis platform like KMAP makes currency the operator's job, which is a structural advantage. A relational integration platform like BRIDGE makes integration your job, which gives you control but also gives you the maintenance burden. A community aggregation database inherits whatever currency its curators can sustain [6]. When comparing options, ask a direct question. Who pays, in staff time and compute, for keeping results consistent as references and methods change.
Reproducibility and Environment Control
Bioinformatics results depend on the exact tools, versions, and databases used, and these differ widely between individuals and institutions. A proficiency exercise run through the COMPARE program supplied one simulated Illumina HiSeq dataset to 13 different institutes and asked them to identify viral pathogens. The comparison of participants' analyses showed that the choice of tools, programs, and databases affected correct identification of viral sequences even on a simple dataset, and that highly divergent genomes were the most challenging to identify [8]. Two lessons follow for platform selection. First, any platform that does not pin its software versions and database versions cannot promise comparable results over time. Second, pipeline and environment managers such as PiGx on GNU Guix exist precisely because reproducibility and traceability require accommodating many interdependent software versions that change continually [7]. If your results will face external scrutiny, this criterion outweighs most interface features.
Compute Model: Cloud, On-Premise, or Hybrid
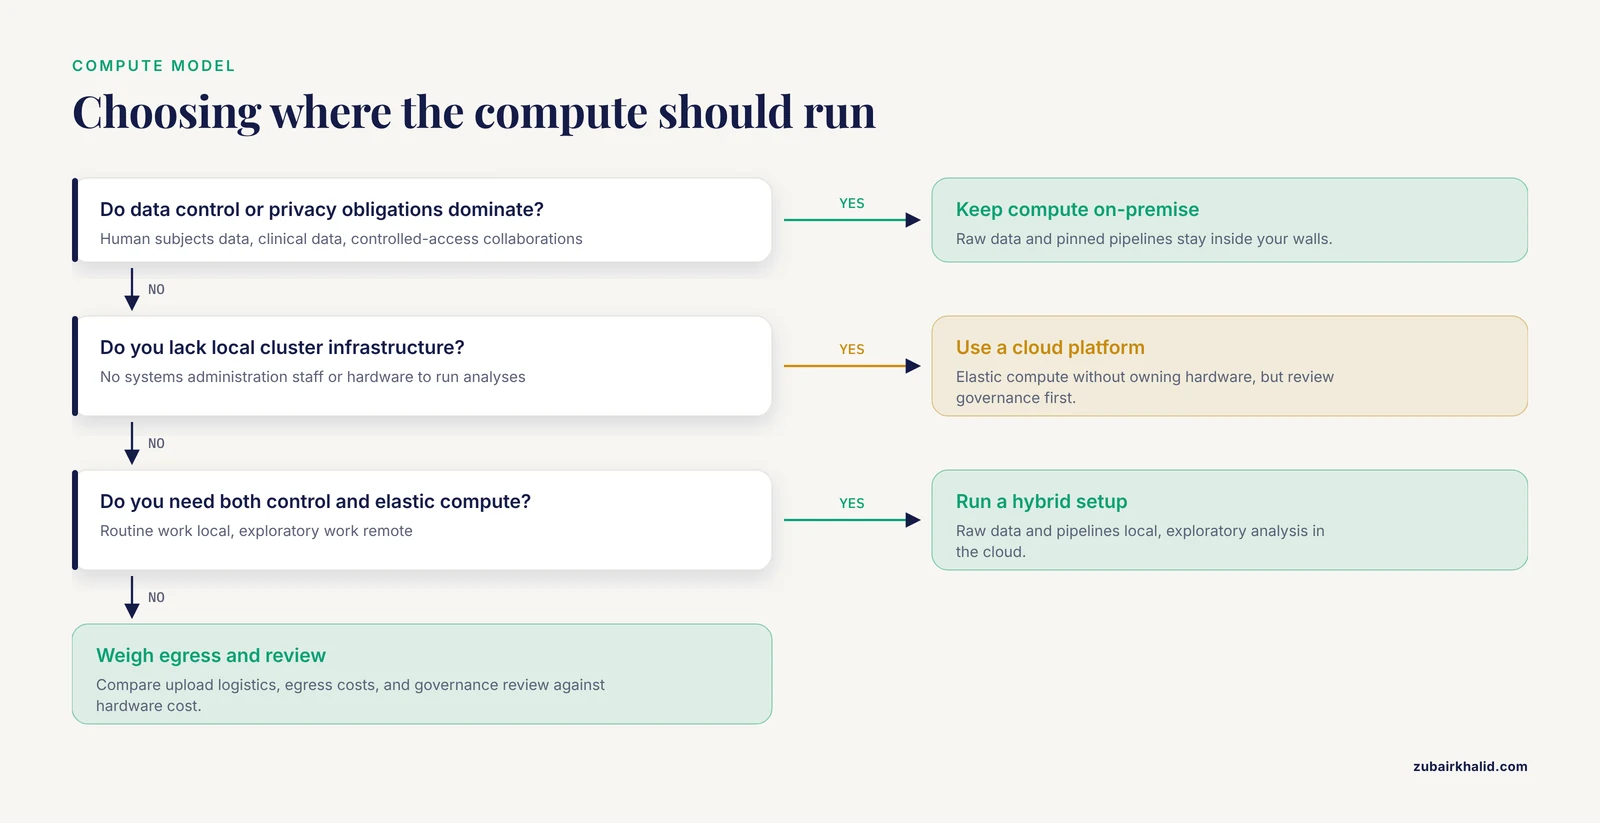
Cloud platforms remove the local cluster from your critical path, as Neuroimaging PheWAS demonstrates by pairing a web interface for study definition and upload with cloud-based computational infrastructure for genome-to-phenotype association analysis [4]. On-premise platforms, typically the pipeline-and-environment archetype, keep data inside your walls, which matters for human subjects data, clinical data, and controlled-access collaborations. A hybrid pattern is common in practice. Raw data and reproducible pipelines live locally, while exploratory or public-data analysis runs on external platforms. When comparing cloud options, weigh upload logistics, egress costs, and data governance review against the avoided cost of owning hardware.
Measuring Performance: Turnaround, Cost, and Output
Platform comparisons in the genomic literature converge on a small set of measurable axes. A study comparing three mRNA library preparation kits for the Illumina platform, covering TruSeq RNA Sample Preparation V2, NuGEN Universal Plus mRNA-Seq, and the NEBNext Ultra Directional RNA Library Prep Kit, evaluated them on cost, experimental time, and data output, and found that the quality and quantity of sequencing data were strongly influenced by the choice of kit [9]. The same three axes apply to data management platforms. Measure the time from data arrival to interpretable result, the total cost of operating the platform, and the quality of the output it produces.
A clinical comparison makes the turnaround axis concrete. Across 20 laboratories and 780 evaluable colorectal cancer cases out of 874 enrolled, a fully integrated cartridge-based system returned KRAS and NRAS-BRAF results in an average of 4.9 days, against an 11-day average for standard-of-care testing that included in-house and send-out PCR, Sanger sequencing, and next-generation sequencing [10]. The lesson generalizes. A platform's operational performance shows up in turnaround, and turnaround differences of this size change clinical decisions. Adopt the same discipline for data platforms. Define the metric, measure it, and compare platforms on the number rather than the brochure.
Throughput Economics
Throughput changes the economics of genomic operations. The genomics costing tool (GCT), developed by five institutions including the Association of Public Health Laboratories, FIND, The Global Fund, the UK Health Security Agency, and the World Health Organization, was piloted in public health laboratories across the African, Eastern Mediterranean, and European regions of WHO. Pilot data demonstrated significant cost reductions per sample as throughput increased, underscoring the economic benefit of optimized use of sequencing platforms [11]. The implication for platform comparison is direct. A platform that helps you batch samples efficiently changes your cost per sample, sometimes more than any difference in licensing. Evaluate candidate platforms on whether they improve batch utilization, not just on whether they store files competently.
How to Run a Fair Comparison Yourself
Independent, multi-sample comparisons are the standard the field itself uses. A recent study compared two droplet-based single-cell RNA sequencing platforms, SeekOne and MobiDrop, against the widely used 10x Genomics platform across multiple sample types of varying complexity and quality. The 10x platform showed generally superior performance, while all three produced acceptable gene yield and recovered expected cell types, and the alternatives offered advantages in cost and flexibility in sample loading [12]. Notice the structure of that comparison. Multiple platforms, multiple sample types, defined metrics, and an explicit acknowledgment that the ranking depends on the user's constraints. When you compare data management platforms, replicate that structure. Use your own representative datasets, not vendor demos, define your metrics before you start, and expect the answer to depend on your constraints.
Worked Scenarios
Abstract criteria become decisions in concrete settings. The following scenarios show how the same criteria weight differently in different laboratories.
A Public Health Sequencing Laboratory
A public health laboratory sequencing pathogens for surveillance faces sustainability questions. Its leadership needs to justify costs across scenarios such as validating past expenditure, running routine surveillance, optimizing costs, and scaling up services, which is exactly the scenario structure the GCT was built to support in low- and middle-income settings [11]. Because outputs feed public health decisions, analytical consistency across time and across partner institutions is not optional. The COMPARE proficiency exercise showed that different tool and database choices produce different identification results from identical data [8], so this laboratory should weight reproducibility infrastructure heavily. A practical configuration pairs a managed platform with audit trails for specimen tracking, a pinned-environment pipeline system for the bioinformatics, and participation in external proficiency testing to verify that results remain comparable to peer institutions. Throughput optimization then drives cost per sample down as volume grows [11].
A Metagenomics Consortium
A consortium studying microbial communities across many habitats confronts the re-annotation problem at its worst. Reference databases and methods evolve constantly, and every study reanalyzed under old parameters becomes inconsistent with newer work. The KMAP approach, in which the platform operator re-assembles and re-annotates public samples at a scale of tens of thousands of samples and distributes the results in tractable Gene Information Tables usable from the command line or within databases [3], is the archetype fit here. The consortium contributes samples and questions while the platform absorbs the compute burden of consistency. The trade-off to accept is workflow constraints. If consortium members need custom assembly or annotation paths, they need a secondary local capability, ideally built on a reproducible pipeline framework so local and platform results remain comparable [7].
An Academic Multi-Omics Core
A core facility serving many principal investigators sees heterogeneous data types, shifting questions, and constant personnel turnover. No single archetype fits. A realistic stack combines a relational or schema-controlled layer for integrating the core's own datasets in the spirit of BRIDGE [2], domain-specific web tools where they fit the core's dominant organisms, in the manner of CHOmics for its target domain [5], a reproducible pipeline foundation for the assays the core runs routinely, following the PiGx pattern for RNA sequencing, chromatin, bisulfite, and single-cell data [7], and a visualization layer for genome-scale comparisons so results reach collaborators in interpretable form [1]. The comparison discipline that matters most for a core is the multi-sample, multi-platform evaluation demonstrated in the single-cell platform study, because the core's users inherit whatever biases an unexamined platform choice introduces [12].
A Small Clinical Molecular Laboratory
A small clinical laboratory weighs operational performance above analytical breadth. The multicenter comparison of the Biocartis Idylla cartridge-based system against standard-of-care testing showed a measurable turnaround advantage, 4.9 days average versus 11 days, with the system running directly from formalin-fixed, paraffin-embedded tissue [10]. For a laboratory deciding between an integrated system and a modular data platform supporting in-house assays, the decision should start with measured turnaround, error rates, and validation burden rather than feature counts. Data management requirements remain real. Result traces, quality metrics such as the assay failure patterns along chip margins documented in genotyping quality work [13], and audit trails must persist, which favors platforms with structured, queryable records over folder trees.
Common Mistakes and Limitations
Treating storage as management. Filling disks with FASTQ and BAM files is genomics data storage, not bioinformatics data management. Without sample metadata, pipeline provenance, and versioned references, the archive becomes uninterpretable within a few staff turnovers. Budget for metadata as seriously as for terabytes.
Comparing on features instead of reproducibility. The COMPARE proficiency exercise demonstrated that identical data, analyzed with different tools and databases by different institutions, yields different identifications [8]. A platform with an attractive interface but unpinned tool versions will produce results you cannot defend or repeat. Check environment control before checking checklists.
Ignoring re-annotation debt. Every dataset analyzed today will need reanalysis as references grow, and the compute burden for that is substantial [3]. Platforms that make reanalysis someone else's problem deserve credit for it in your comparison, and platforms that make it your problem deserve a staffing line item.
Running one-off, single-dataset evaluations. Platform performance varies with sample type and quality, as shown when two alternative single-cell platforms matched the leading platform on expected cell types while differing in gene yield, cost, and flexibility across sample types [12]. A single demo dataset hides exactly the variation that decides your choice.
Overlooking the upstream-downstream split. Visualization clients are downstream components, and their output quality is capped by the upstream platform [1]. Comparing a visualization tool against a full management platform is a category error. Match each component to the layer it manages.
Assuming throughput does not affect platform economics. Cost per sample falls measurably as throughput rises [11]. A platform that handles batching and scheduling poorly can cost more per result than a nominally more expensive alternative that batches well.
Underestimating governance for human data. Cloud platforms simplify computation and complicate data control [4]. Start the contractual and privacy review early, because it commonly takes longer than the technical evaluation.
Expecting any platform to fit every domain. Domain-specific tools deliver their speed only inside their designed scope [5]. Mapping your actual data types against a candidate platform's supported scope before commitment prevents an expensive mismatch.
One general limitation applies across all of these points. Platform rankings shift with your data types, volumes, staffing, and obligations, so individual procurement decisions need validation against your own datasets and, in clinical settings, review by the qualified laboratory director responsible for the service.
Frequently Asked Questions
What is a genomics data management platform?
It is the combined system of storage, metadata, compute, and analysis tooling that carries genomic data from instrument output to interpretable, traceable result. Storage alone is only one layer of it.
How do I choose the best genomics data management platform for my lab?
Start from your dominant data type and your reproducibility obligations, then match platform archetypes to those needs. Validate the shortlist with your own representative datasets and predefined metrics rather than vendor demonstrations.
Should we keep genomics data on-premise or in the cloud?
Choose on-premise when data control, privacy obligations, or existing cluster hardware dominate, and cloud when you lack infrastructure and need elastic compute. Many laboratories run a hybrid, with raw data and pinned pipelines local and exploratory analysis in the cloud.
Can one platform handle all of our omics data types?
Rarely with equal quality. Integration platforms and some web tools support multi-omics comparison, but most platforms perform best on the data types they were designed for, so map your full data inventory before committing.
How do we keep results reproducible across a platform?
Pin the exact software versions, pipeline parameters, and reference database versions for every result. Environment managers built for this purpose exist because unmanaged dependency versions make results incomparable across machines and over time.
What metrics should a platform comparison actually measure?
Measure time from data arrival to interpretable result, total operating cost including reanalysis, and output quality on your own data. Throughput-driven cost per sample and reproducibility under fixed inputs belong in the comparison as well.
Sources
- Combining Strengths for Multi-genome Visual Analytics Comparison.
- Building a BRIDGE for the integration of heterogeneous data from functional genomics into a platform for systems biology.
- KAUST Metagenomic Analysis Platform (KMAP), enabling access to massive analytics of re-annotated metagenomic data.
- Neuroimaging PheWAS (Phenome-Wide Association Study): A Free Cloud-Computing Platform for Big-Data, Brain-Wide Imaging Association Studies.
- CHOmics: A web-based tool for multi-omics data analysis and interactive visualization in CHO cell lines.
- BTECH: a platform to integrate genomic, transcriptomic and epigenomic alterations in brain tumors.
- PiGx: reproducible genomics analysis pipelines with GNU Guix.
- Proficiency Testing of Virus Diagnostics Based on Bioinformatics Analysis of Simulated In Silico High-Throughput Sequencing Data Sets.
- Comparison of library construction kits for mRNA sequencing in the Illumina platform.
- Comparison of Tissue Molecular Biomarker Testing Turnaround Times and Concordance Between Standard of Care and the Biocartis Idylla Platform in Patients With Colorectal Cancer.
- Genomics costing tool: considerations for improving cost-efficiencies through cross scenario comparison.
- Leveraging two novel droplet-based single-cell RNA Sequencing platforms: a comparative study with 10x genomics.
- Establishing analytical validity of BeadChip array genotype data by comparison to whole-genome sequence and standard benchmark datasets.