NCBI Genome Assembly Levels Explained
By Dr. Zubair Khalid, DVM, MS, PhD ·

NCBI genome assembly levels describe how completely a deposited genome has been assembled and organized, running from a loose set of contigs, through scaffolds joined by gaps, up to chromosome-scale assemblies and gap-free complete genomes. Every record in the NCBI Assembly database carries one of four level labels, Contig, Scaffold, Chromosome, or Complete Genome, so a user can tell at a glance whether a genome is an early draft or a reference-grade resource.
This label matters because it changes what the assembly can be used for. A contig-level bacterial draft is fine for taxonomic placement and rough gene finding, but a chromosome-level assembly is what you need for positional work such as mapping markers to chromosomes, building synteny comparisons, or aligning resequencing reads for variant discovery. A recent chromosome-level assembly of Pacific herring, for example, replaced the only previously available scaffold-level reference for the species, which had 1,379 scaffolds, because fisheries genomics needed sequences organized into the actual 26 chromosomes [1]. Reading the level label correctly, along with the assembly statistics that accompany it, is the single fastest way to judge whether a genome in NCBI will support your analysis or quietly sabotage it.
What each assembly level means
The National Center for Biotechnology Information (NCBI) maintains the Assembly database as the archive of all genome assemblies submitted through GenBank and RefSeq. The Assembly database documentation defines four levels, and each describes the state of the sequences, not the quality of the science behind them. A sloppy chromosome-level assembly can be worse than a careful scaffold-level one, which is why the level label is only the first thing you check, never the last.
Contig
A contig (from "contiguous sequence") is a stretch of DNA assembled directly from sequencing reads, with no internal gaps represented. The assembler joins overlapping reads into one continuous consensus sequence. If the sequencing technology leaves hard stops, repeats, or coverage drops, the assembly simply breaks into another contig rather than filling in Ns.
Most bacterial drafts deposited in NCBI are contig-level. A typical published example comes from four strains of the lactic acid bacterium Pediococcus pentosaceus, assembled with SPAdes from Illumina MiSeq reads. Their genomes fell into 82 to 143 contigs with N50 values between 25,907 and 64,606 bp, at sequencing coverage of 203x to 226x [2]. Another example, a multidrug-resistant Escherichia coli from a Ugandan hospital study, produced a 5.1 Mb draft in 153 contigs [3]. Contig-level assemblies like these are entirely legitimate publications, and for bacteria they often carry over 95 percent of the genome. They are drafts because the order of the contigs relative to each other is unknown.
Scaffold
A scaffold takes contigs and orders and orients them into larger sequences using additional evidence, such as long-read links, paired-end read links, or chromatin contact maps. Gaps between contigs inside a scaffold are filled with runs of the ambiguity base N, and the estimated length of each gap is encoded in the number of Ns. Scaffolds contain sequence that is ordered and oriented but not fully determined.
Eukaryotic drafts are almost always scaffold-level when first deposited. The speckled dace assembly from the California Conservation Genomics Project, built from Pacific Biosciences HiFi long reads plus Omni-C proximity data, consists of 490 scaffolds totaling roughly 1.15 Gb, with a contig N50 of 10.9 Mb and a scaffold N50 of 44.5 Mb [4]. The argan tree assembly under accession GCA_003260245.2 is a 690 Mbp scaffold-level draft with a scaffold N50 of 25 Mbp concentrated in just 11 large scaffolds [5]. The distinction inside these records matters: the contig N50 tells you how much is real sequence, while the scaffold N50 tells you how far the fragments have been strung together.
Chromosome
A chromosome-level assembly assigns sequences to chromosomes and organizes them as pseudomolecules, one per chromosome, in chromosome order. Gaps within and between scaffolds may remain, but the pieces have been anchored to the correct chromosome and placed in the correct order and orientation along it. Some chromosome-level assemblies still carry unplaced or unlocalized scaffolds that NCBI lists separately from the chromosome sequences.
The Acmispon strigosus assembly illustrates the endpoint of this process: 519 Mb of sequence with a contig N50 of 22.97 Mb, scaffolded into seven pseudochromosomes matching the seven chromosomes of this legume [6]. The Pacific herring assembly goes further, with 26 chromosomes, 922 contigs, a contig N50 of 7,338,470 bp, and a scaffold N50 of 31,494,017 bp [1]. Chromosome assignment usually requires an independent physical or chromatin-based linkage signal, most commonly Hi-C, which reads the physical co-localization of DNA in the nucleus.
A subtlety worth learning early: some chromosome-level assemblies are not fully continuous even along the chromosomes. The two recent flax (Linum usitatissimum) assemblies were described as near telomere-to-telomere, with K-3018 at 491.1 Mb containing thirteen full-length chromosomes plus two one-gap chromosomes, and Svyatogor at 497.8 Mb containing twelve full-length chromosomes plus three one-gap chromosomes, where a one-gap chromosome retains a single unresolved break [7]. This shows that the level describes chromosome organization, and a chromosome can still harbor a small number of gaps.
Complete Genome
Complete Genome is the highest level and means the assembly is finished. For prokaryotes, each chromosome and each plasmid is represented as a single closed sequence with no gaps and no ambiguous bases. This is the level you want when draft artifacts would corrupt an analysis, for instance when building k-mer-based classifiers. One machine learning study of Listeria identification deliberately assembled a curated dataset of 700 complete bacterial genomes, 350 Listeria monocytogenes and 350 related non-Listeria genomes, from the NCBI Assembly database, filtering specifically for complete assemblies before training [8].
For eukaryotes, the analogous ambition is a telomere-to-telomere (T2T) assembly, where every chromosome runs end to end without gaps. The flax assemblies described above approach this standard using only Oxford Nanopore R10.4.1 reads assembled with Hifiasm, without PacBio HiFi or optical maps [7]. NCBI now flags T2T assemblies in the Assembly database, and it also distinguishes them qualitatively from older genome records through its assembly quality categories, which grade assemblies on contiguity and gap content. The Alternaria alternata Y-2 genome paper states the honest framing that many authors use: the assembly "does not reach telomere-to-telomere completeness" even though it supports high-quality gene prediction and annotation [9].
Summary table
| Level | What the record contains | Gaps inside | Typical use | Published example |
|---|---|---|---|---|
| Contig | Contiguous assembled sequences, unassembled relative to each other | None within contigs | Gene finding, taxonomic identification, pangenome gene content | Pediococcus pentosaceus drafts, 82 to 143 contigs [2] |
| Scaffold | Contigs ordered and oriented, joined by N-gap runs of estimated length | N runs between contigs | Draft eukaryotic analyses, gene annotation, BUSCO assessment | Speckled dace, 490 scaffolds, 1.15 Gb [4] |
| Chromosome | Sequences assigned to chromosomes as pseudomolecules, sometimes with unplaced scaffolds | Possible gaps within chromosomes | Marker mapping, synteny, read alignment references | Pacific herring, 26 chromosomes [1], Acmispon strigosus, 7 pseudochromosomes [6] |
| Complete Genome | Finished, gap-free chromosomes and plasmids (prokaryotes), or T2T equivalent (eukaryotes) | None | Classifier training, finished reference comparisons | 700 complete bacterial genomes curated for Listeria classification [8] |
How an assembly moves from reads to a chromosome-level record
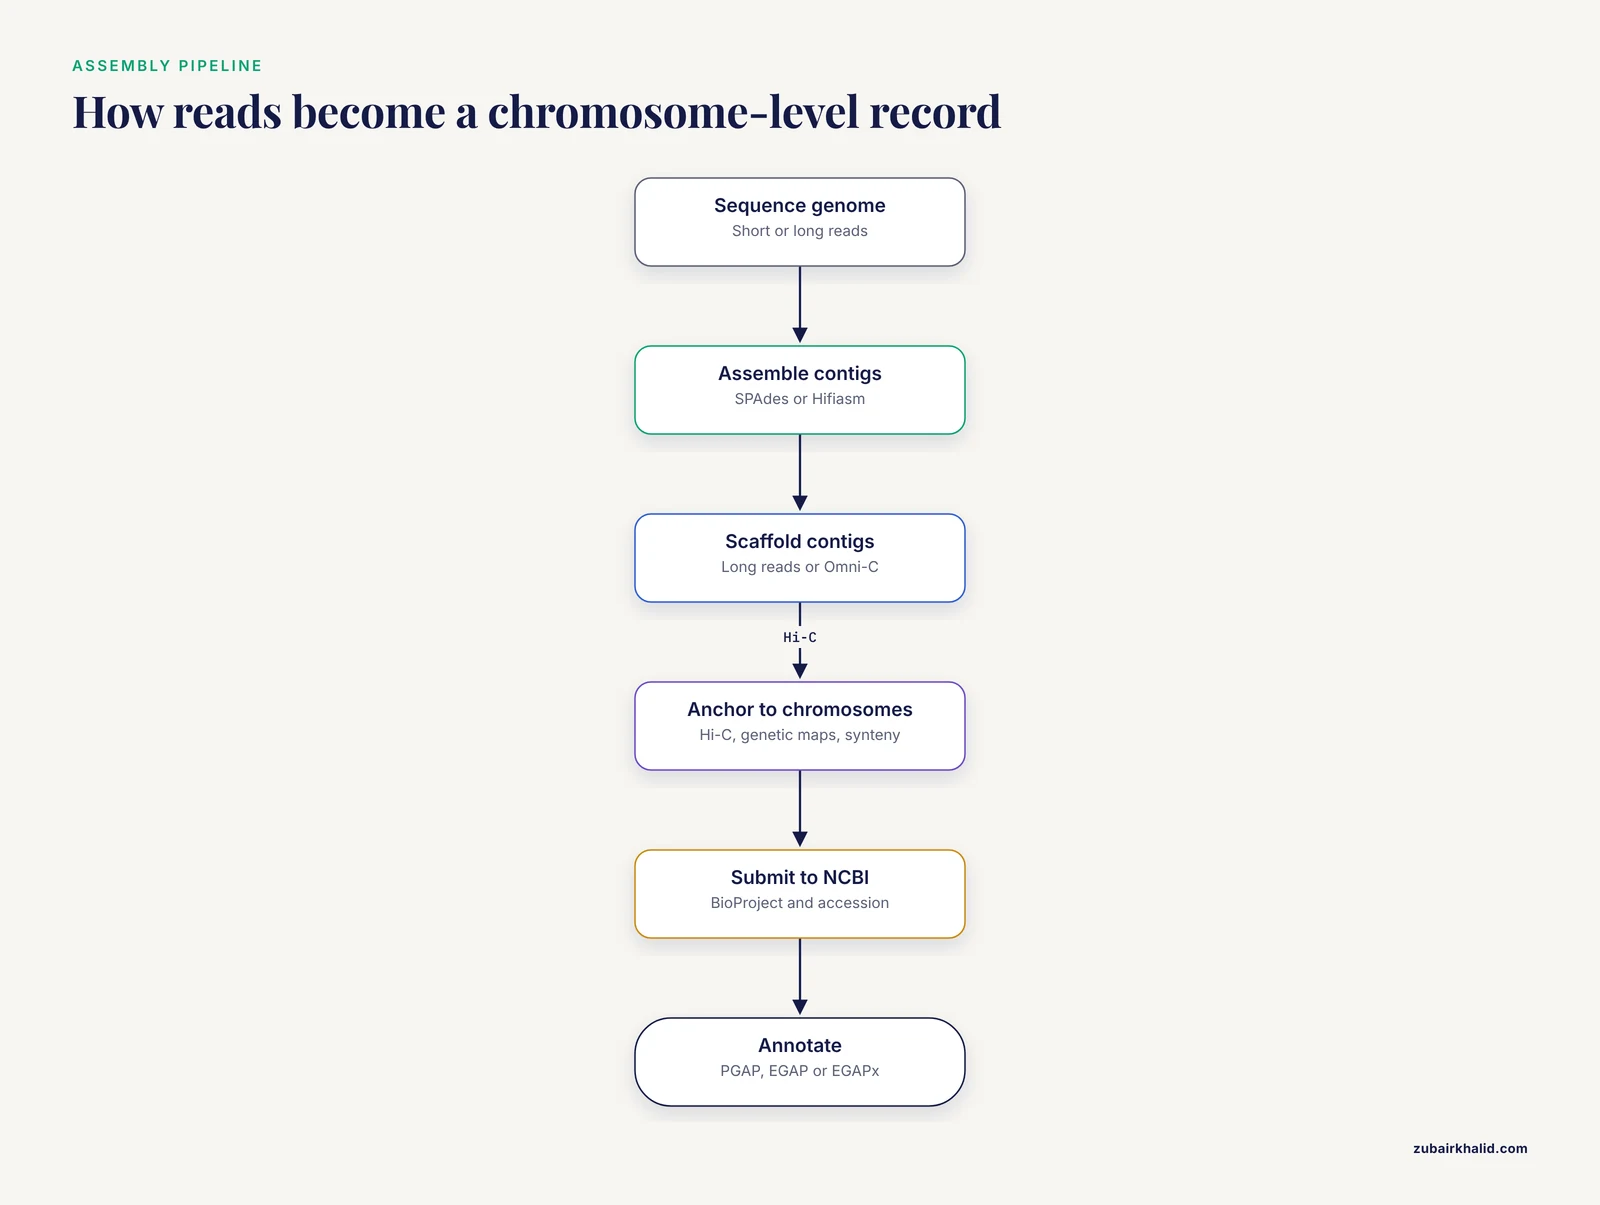
Understanding the pipeline explains why the levels exist and why each upgrade step requires different evidence.
- Sequence the genome. The platform shapes the assembly. Short-read Illumina data dominated older drafts, as in the Pediococcus genomes assembled from MiSeq 2 x 250 bp runs [2] and the rice mutant genome sequenced on a NovaSeq 6000 at 40x depth [10]. Modern reference projects favor long reads: Pacific Biosciences HiFi for the speckled dace [4] and Acmispon [6], and Oxford Nanopore R10.4.1 for the flax assemblies [7].
- Assemble reads into contigs. The assembler (SPAdes for bacteria [2], [3], Hifiasm for ONT data [7], and equivalent long-read assemblers elsewhere) produces contigs. At this point you have total sequence content but no structure.
- Scaffold the contigs. Long reads that span contig ends, or proximity-ligation libraries, stitch contigs together into scaffolds separated by N gaps. The speckled dace project used Omni-C data for this step [4], and the herring project used short-read sequencing of proximity ligation libraries [6] uses Hi-C [6]. Scaffolding also collapses or separates haplotypes. The Darwin Tree of Life Kentish Glory assembly illustrates diploid handling explicitly: the record contains two haplotypes of 391.90 and 391.44 Mb, with haplotype 1 assembled to chromosome level and haplotype 2 deliberately left at scaffold level [11].
- Anchor scaffolds to chromosomes. Hi-C contact maps, genetic maps, or reference synteny assign each scaffold to a chromosome and order them along it, producing pseudomolecules. This is the step that upgrades a Scaffold record to Chromosome level.
- Submit to NCBI and receive a level label. The submitter deposits the assembly with a Biological Project (BioProject) accession, and NCBI processes it into the Assembly database with an assembly accession. The level reflects what was actually deposited and validated. Chromosome-level claims require chromosome assignment evidence, and NCBI records the assignment status of every sequence.
- Annotate. NCBI runs its own pipelines on accepted assemblies. Prokaryotic assemblies go through the NCBI Prokaryotic Genome Annotation Pipeline (PGAP), which predicted 4,726 protein-coding genes in the Ugandan E. coli draft [3]. Eukaryotic assemblies go through the Eukaryotic Genome Annotation Pipeline (EGAP), as was done for the speckled dace with species-specific RNA-Seq from five tissues, yielding 39,919 annotated genes [4], or through its open-source successor EGAPx, used for Acmispon to annotate 21,347 genes [6].
How to use NCBI to find, filter, and download assemblies
This section doubles as a compact NCBI databases guide for the Assembly workflow. The Assembly database sits at the center of a network that also includes SRA (raw reads), BioProject (study metadata), BioSample (biological specimen metadata), TaxBrowser, and, for pathogens, the Pathogen Detection resource.
Reading the accession. Assembly accessions start with GCA for GenBank records or GCF for RefSeq records, followed by a version number. The argan tree assembly GCA_003260245.2 is a GenBank assembly at version 2, meaning it was reprocessed or updated once after initial release [5]. GCF accessions point to RefSeq assemblies that NCBI has selected, standardized, and usually annotated. A .2 suffix does not mean the sequence changed dramatically, it means the record was revised, and the assembly history on the record page documents what happened.
Filtering by level. On the Assembly database search page, the Assembly level filter lets you restrict results to Complete Genome, Chromosome, Scaffold, or Contig. You can also exclude particular levels, filter by assembly quality category, and restrict to RefSeq or T2T-flagged records. For a survey-style analysis, filtering to complete genomes is a common move, as in the Listeria dataset described above [8]. For a reference genome hunt, filter to Chromosome first, then compare the statistics of what remains.
Reading the statistics table. Every assembly record shows total sequence length, number of contigs and scaffolds, contig N50 and scaffold N50, L50 values, GC content, and reported coverage. These numbers let you compare two assemblies of the same species immediately. The herring example makes the point vividly: the new assembly reports 922 contigs and 26 scaffolds, while the older scaffold-only reference listed 1,379 scaffolds with no chromosome organization at all [1].
Choosing download files. Each assembly record offers a download package. The genomic FASTA contains the sequences. The GFF3 contains annotation coordinates. The GenBank flat file (.gbff) combines sequence and annotation in a single parseable format, and one published regulatory-genomics workflow specifically instructs users to download their genome of interest from NCBI in .gbff format and parse it with a minimal set of commands to extract promoters and predicted regulatory associations [12]. For most scripting work, grab the FASTA plus GFF3, and reach for the .gbff when you need features interleaved with sequence.
Mining raw reads when no good assembly exists. The Sequence Read Archive (SRA) holds the underlying reads. A recent study used the pre-computed taxonomic profiles from the NCBI SRA Taxonomy Analysis Tool (STAT) to scan more than 28 million SRA datasets for reads of under-represented microbial species, then recovered new genomes for 472 of 804 targeted singleton species. Crucially for this article, SRA mining even corrected assembly gaps in the single published genome of Clostridium tarantellae, demonstrating that draft assemblies can be upgraded using reads already sitting in public archives [13].
Interpreting assembly levels for a specific analysis
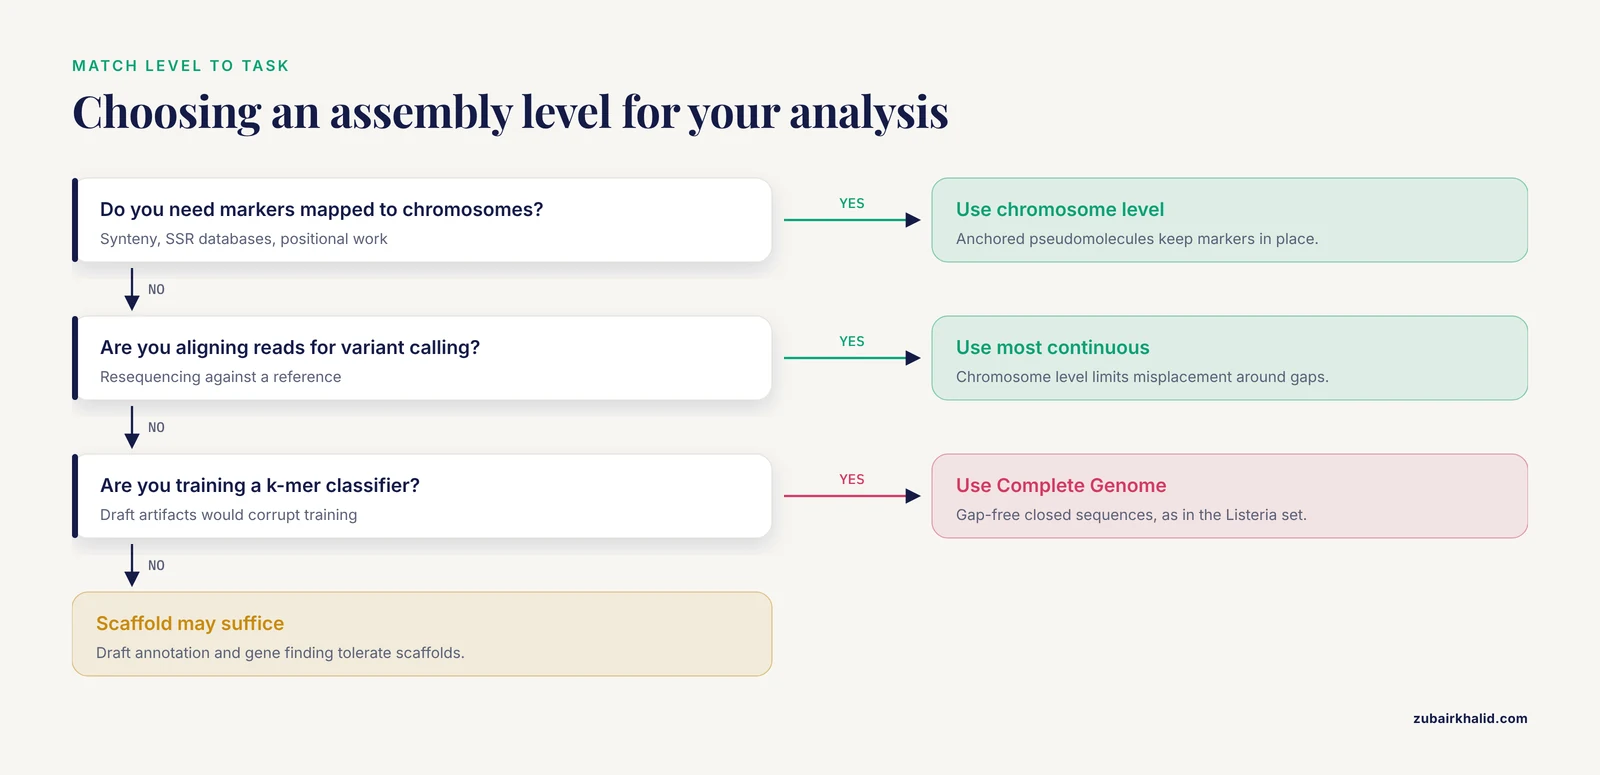
The most common practical question is not "what does genome assembly levels NCBI mean" but "which level do I need." Match the level to the task.
Resequencing and variant calling. Align reads to the most complete, most continuous assembly available, ideally chromosome-level, because read placement and variant calling both degrade around gaps and misjoins. The rice mutant study aligned its NovaSeq reads against the AGIS1.0 assembly and called over 4 million variants across the genome [10]. The macaque transcriptome study aligned short and long RNA reads to the macFus_1.0 reference before transcript assembly [14]. In both cases the reference assembly predates the study, and its level sets a ceiling on how well the new reads can be interpreted.
Marker and resource development. Physical position matters, so chromosome-level assemblies are the standard. The CypriSSR microsatellite database retrieved chromosome-level assemblies for 11 cyprinid species from NCBI, then ran MISA to identify over 7.8 million SSR loci and designed primers with Primer3, storing chromosomal coordinates for every marker [15]. Attempting that workflow on a scaffold-level assembly would leave markers unanchored to chromosomes.
Surveillance and population genomics. The NCBI Pathogen Detection database aggregates bacterial assemblies for public health surveillance. One analysis of carbapenemase genes drew on 67,057 unique Klebsiella pneumoniae assemblies from 123 countries contributed between 2013 and 2025 [16]. For an organism-wide study, a Stenotrophomonas maltophilia analysis pulled 3,343 candidate genomes from NCBI and retained 1,584 after average nucleotide identity (ANI) verification, a reminder that raw database pulls need quality filtering regardless of level [17].
Gap closing and assembly rescue. When a draft assembly has gaps, SRA reads from the same or related organisms can fill them, as the Clostridium tarantellae case showed [13]. This is a targeted, level-changing intervention, not a substitute for proper reassembly.
Regulatory and promoter analysis. Because annotation travels with the assembly record, downloading the .gbff of a well-annotated assembly is a legitimate starting point even at scaffold level, as the yeast regulatory workflow demonstrated for Rhodotorula toruloides [12].
Haplotype awareness. Diploid assemblies can contain two haplotypes. In the Kentish Glory record, haplotype 1 is chromosome-scaffolded into 26 pseudomolecules including the Z sex chromosome, while haplotype 2 remains at scaffold level [11]. Analyses that assume one sequence per locus need to decide which haplotype to use, and the level labels on the two haplotypes differ.
Quality metrics that complement the level
The level label says nothing about errors. Three families of metrics fill that gap, and every assembly record or companion paper should report them.
Contiguity: N50 and L50. The N50 is the length of the scaffold or contig at which half the assembly is contained in sequences of that length or longer. The L50 is the number of such sequences. The herring assembly reports 26 scaffolds with an N50 of 31,494,017 bp and an L50 of 12 [1], meaning twelve scaffolds carry half the genome. For the argan tree, a scaffold N50 of 25 Mbp with an L50 of 11 over a 690 Mbp assembly signals very large macro-scaffolds [5]. Compare N50 within the same level only. A scaffold N50 always exceeds the contig N50 because gaps pad the length, as the speckled dace numbers show with 10.9 Mb versus 44.5 Mb [4].
Completeness: BUSCO and related tools. BUSCO (Benchmarking Universal Single-Copy Orthologs) searches for a lineage-specific set of single-copy genes and reports what fraction is present. Assembly-level BUSCO scores in the sources here range widely: 97.7 percent for speckled dace [4] and Pacific herring [1], 94.8 percent for Acmispon with a predicted-protein score of 91.5 percent [6], and 74.6 percent for the argan tree proteome, a comparatively low figure the authors reported openly [5]. For fungi, FGMP extends completeness assessment using conserved proteins and DNA elements, was validated across 246 fungal assemblies, and can even be run directly on unassembled reads [18].
Contamination and bacterial completeness. Prokaryotic drafts are conventionally assessed with estimated completeness and contamination from lineage-specific single-copy marker sets. The E. coli draft reported 98.46 percent completeness and 0.97 percent contamination [3], and the Pediococcus drafts exceeded 95.5 percent completeness [2]. Contamination near or above 5 percent usually means the culture or extraction picked up a second organism, and no assembly level fixes that.
Gap content and telomeres. The count of unanchored scaffolds, the number of internal gaps, and the presence of telomeric repeats distinguish chromosome-level assemblies from one another. The flax assemblies report telomeric repeats at both ends of every chromosome, supporting their near-T2T claim [7].
Assemblies change over time
Assembly level is a snapshot, not a permanent property. NCBI's own assembly archive records versioning and replacement. The FGMP survey examined 57 cases where fungal assemblies were updated or degraded after initial release, visible directly in the NCBI assembly archive [18]. The herring chromosome-level assembly exists precisely because an earlier scaffold-level record was insufficient for the community's needs [1]. The argan tree record reached version 2 through reassembly and curation of the same input reads under the same BioProject [5]. The flax authors benchmarked against variety T397, the standing reference in the NCBI Genome database, and reported their new assemblies surpassed it [7]. When you cite a genome, cite the accession with its version number, because the sequence behind GCA_003260245.1 and GCA_003260245.2 may not be identical.
Misconceptions students often carry
Misconception 1: chromosome-level means gap-free. The flax one-gap chromosomes show otherwise [7]. Chromosome-level means assigned and ordered. Internal gaps are recorded as runs of Ns, and their count is listed on the record page.
Misconception 2: a higher level means a more accurate sequence. Level measures organization, not base-level accuracy or biological correctness. A misjoined chromosome is more misleading than an honest scaffold. ANI-based filtering of database pulls exists because nominal species labels and assembly quality diverge routinely [17].
Misconception 3: BUSCO completeness and assembly level measure the same thing. A 74.6 percent proteome BUSCO score on a scaffold-level argan assembly [5] and a 97.7 percent score on chromosome-level assemblies [4], [1] illustrate that the two axes are independent. A fragmented assembly can recover nearly all single-copy genes, and a chromosome-level assembly can miss genes.
Misconception 4: complete genome means one sequence. For bacteria, Complete Genome means every chromosome and plasmid is closed and gap-free, which for many organisms is several sequences. The Listeria dataset of 700 complete genomes contains multisequence records [8].
Misconception 5: annotation quality tracks assembly level. Annotation comes from separate pipelines. PGAP annotates prokaryotic assemblies regardless of level [3], and EGAP or EGAPx annotates eukaryotic assemblies [4], [6]. The quality of gene models depends on input evidence, such as the five-tissue RNA-Seq used for the speckled dace [4], not on the level label.
Common Mistakes and Limitations
- Using the newest or first-hit assembly instead of the best one. Search the Assembly database for all assemblies of your species, sort by level and quality category, and read the statistics before committing. The flax team did exactly this comparison against the T397 reference before declaring superiority [7].
- Comparing N50 values across levels. Contig N50 and scaffold N50 answer different questions, and N runs inflate scaffold lengths. Compare contig N50 to contig N50 and scaffold N50 to scaffold N50.
- Ignoring the version suffix. Citing an assembly without its version invites irreproducibility when NCBI updates the record, which happens regularly enough that 57 fungal updates alone were traceable in the archive [18].
- Assuming SRA reads and the assembly are redundant. They are complementary. Reads in SRA closed gaps in a published C. tarantellae assembly [13], and STAT-based screening of over 28 million datasets found recoverable genomes for species with no assembly at all [13].
- Treating haplotypes as alternative species assemblies. Diploid records can include two haplotypes at different levels, as in the Kentish Glory assembly where haplotype 2 is scaffold-level [11]. Deduplicate or select one haplotype before downstream analysis.
- Pulling pathogen assemblies without quality control. Large-scale studies routinely filter NCBI pulls by ANI before analysis, reducing 3,343 candidate S. maltophilia genomes to 1,584 verified ones [17]. Mirror that discipline in your own work.
- Overreading BUSCO. BUSCO measures a defined gene set, not whole-genome accuracy, and scores are not comparable across lineages or between assembly and proteome evaluations without care [5], [18].
Individual research decisions, like individual clinical decisions, always need domain-specific judgment on top of general guidance like this.
Quick Review
- NCBI assigns every assembly one of four levels: Contig, Scaffold, Chromosome, or Complete Genome.
- Contigs are gapless assembled sequences, scaffolds join contigs with N gaps, chromosome assemblies anchor sequences to pseudomolecules, and complete genomes are finished and gap-free.
- The level describes organization, not accuracy. BUSCO, N50, completeness, contamination, and gap counts carry the quality signal.
- Assembly accessions begin with GCA (GenBank) or GCF (RefSeq), and the trailing version number tracks updates.
- Compare contig N50 only against contig N50, and scaffold N50 only against scaffold N50.
- Match level to task: complete genomes for classifier training, chromosome level for marker mapping and read alignment, scaffolds for draft annotation.
- Assemblies get updated and upgraded. Cite accessions with version numbers and check the assembly history.
Frequently Asked Questions
What does genome assembly levels NCBI mean?
It refers to the four-level label NCBI assigns to every record in its Assembly database, indicating how completely the genome has been assembled. The levels are Contig, Scaffold, Chromosome, and Complete Genome, in increasing order of organization.
What is the difference between a contig and a scaffold?
A contig is a single continuous assembled sequence with no gaps. A scaffold links multiple contigs in a known order and orientation, with the unknown regions between them filled by runs of the base N of estimated length.
Is a chromosome-level assembly always better than a scaffold-level one?
Not automatically. Chromosome level adds organization and anchoring, but quality depends on accuracy and completeness metrics such as BUSCO, contamination, and gap content. A carefully built scaffold-level assembly can outperform a careless chromosome-level one for some analyses.
What is the difference between GCA and GCF assembly accessions?
GCA accessions are GenBank assemblies as submitted by researchers. GCF accessions are RefSeq assemblies that NCBI has selected, standardized, and typically annotated itself. Both carry version numbers that track updates.
Which assembly level should I use for variant calling?
Use the most continuous assembly available, ideally chromosome-level, because gaps and unanchored scaffolds interfere with read alignment and variant placement. Published resequencing studies align to a defined reference assembly accession and report it explicitly.
How can I tell how complete an assembly is?
Read the statistics on the assembly record and any companion publication. Look for BUSCO or equivalent completeness scores, bacterial completeness and contamination estimates, contig and scaffold N50 values, and the number of unplaced scaffolds and gaps.
Sources
- A chromosome-level reference genome for Pacific herring (Clupea pallasii) from the Bering Sea.
- Genome data mining of four probiotic Pediococcus pentosaceus strains isolated from healthy dairy cows.
- Whole genome sequence of a superbug-Escherichia coli strain KAB-AI-497 isolated from the vagina of a 20 year old pregnant woman with premature rupture of membrane (PROM) in a resource limited setting, Kabale Regional Referral Hospital, in Uganda.
- A genome assembly of the speckled dace, Rhinichthys osculus.
- Comprehensive re-assembly and annotation dataset for the argan tree (Argania spinosa L., Sapotaceae) genome.
- Chromosome-level reference genome of a foundational California native legume, Acmispon strigosus.
- Progress in Flax Genome Assembly from Nanopore Sequencing Data.
- Listeria Genome Identification Using DNABERT Embedding With LightGBM and SHAP-Based Explainable Classification.
- Whole-genome sequencing and analysis of the endophytic fungus Alternaria alternata Y-2 from Leymus chinensis.
- Whole-genome resequencing of an acute gamma-mutagenised Oryza sativa: a genomic data for discovering the landscape of genomic variants related to bacterial leaf blight resistance.
- The genome sequence of the Kentish Glory, Endromis versicolora (Linnaeus, 1758) (Lepidoptera: Endromidae).
- From a genome assembly to full regulatory network prediction: the case study of Rhodotorula toruloides putative Haa1-regulon.
- Targeted genome recovery of under-sequenced microbes from the Sequence Read Archive STAT.
- Hybrid transcriptome assembly and annotation of Japanese macaque prefrontal cortex.
- Development of CypriSSR: a genome-wide, chromosome-level microsatellite database for multiple cyprinidae species.
- Global genomic surveillance and temporal trends of carbapenemase-encoding β-lactamase genes in Klebsiella pneumoniae using NCBI pathogen detection data.
- Integrated genomic analysis of Stenotrophomonas maltophilia: resistome, virulence-associated genes, predicted mobile genetic elements, and core-genome phylogeny.
- FGMP: assessing fungal genome completeness.