How to Check Memory Usage with the free Command
By Dr. Zubair Khalid, DVM, MS, PhD ·

By the end of this article you will be able to run the free command on any Linux system, read every column of its output correctly, decide whether a genome assembly, alignment, or quantification job will fit in the memory of your machine or cluster node, and monitor memory continuously while a pipeline runs. You will also know the specific mistakes that trip up people new to linux for bioinformatics, such as confusing the "free" column with truly usable memory.
To follow along you need a Linux machine (Ubuntu, Debian, RHEL, CentOS, Rocky, or similar), a terminal session on that machine, and the procps package installed. Most distributions include it by default. If you work on an HPC cluster, a plain login node session is enough to start, and every command in this guide runs without root privileges.
Why Memory Checking Matters in Bioinformatics Workflows
Memory is often the binding constraint in bioinformatics, not CPU time. A human genome index for a splice-aware aligner can consume tens of gigabytes on load. De novo assemblers, metagenomic classifiers, and variant callers routinely request tens to hundreds of gigabytes. When a job exceeds what the kernel can provide, the kernel's out-of-memory (OOM) killer terminates one of your processes, usually without a clear message in your pipeline log, and you lose hours of compute.
Memory efficiency is a recognized performance dimension in bioinformatics software development. The Crux toolkit, a widely used suite for mass spectrometry proteomics analysis, redesigned its label-free quantification command in version 5.0 to achieve a 1.9-fold speedup while reducing memory usage by 26 percent, demonstrating how much practical value memory optimization carries in real analysis tools [1]. The same logic applies on your side of the pipeline. If you cannot measure memory with confidence, you cannot size jobs, schedule nodes, or verify that an optimization actually helped.
The free command, part of the procps-ng package, is the fastest way to get that measurement. It takes seconds to run and answers the one question that matters before every launch: does this job fit?
Understanding What the free Command Actually Reports
Where the Numbers Come From
free does not scan your processes. It reads summary counters from the kernel's virtual files in /proc/meminfo, which the kernel maintains in real time. This means free is fast, needs no special permissions, and always reflects the current kernel view of physical memory. It also means free shows system-wide memory, not the memory of one user or one process. For per-process detail you need ps, top, or htop, covered later in this article.
Reading the Default Output
Open a terminal and run:
freeTypical output on a 64 GiB server looks like this:
               total        used        free      shared  buff/cache   available
Mem:        65806968    12019112    41230244      512340    13026140    53512332
Swap:        8388604           0     8388604
All values are in kibibytes (KiB, 1024 bytes) by default. The two rows matter as follows.
The Mem row describes physical RAM:
totalis total installed RAM usable by the kernel, excluding reserved regions.usedis memory currently allocated to processes and kernel structures. In this default view,usedequalstotalminusfreeminusbuff/cache.freeis memory that is completely unused. This number is almost always much lower than what you can actually use, because the kernel deliberately uses spare RAM to cache files.sharedis memory used by tmpfs and shared memory segments, which includes some container and temporary filesystem usage.buff/cacheis the page cache and block device buffers. The kernel keeps recently read file contents in RAM so repeated reads are fast. This memory is reclaimable on demand, which is why it is not counted as "used" in the available calculation.availableis the estimate of how much memory can be allocated for new workloads without heavy swapping. This is the number you should use for capacity decisions.
The Swap row describes disk-backed swap space. Swap extends the effective memory pool at the cost of speed. When the kernel swaps active pages of a large alignment job to disk, performance can drop by orders of magnitude, so in practice you should treat swap as an emergency buffer rather than usable capacity for bioinformatics jobs.
The Column That Matters: available, Not free
Newcomers to linux commands for bioinformatics often look at the free column, see a small number, and conclude the machine is full. On an idle server that has been running for a while, free can be under 1 GiB while available sits at 50 GiB, because the kernel filled spare RAM with page cache. That cache is released instantly when a process calls for memory. Always make capacity decisions against available.
The reverse mistake is also common. People see large free plus large buff/cache and add them mentally to decide what will fit. That sum overestimates capacity, because not every cached page is instantly reclaimable in every situation. Trust the kernel's available estimate instead. It is derived from /proc/meminfo and accounts for reclaimability under realistic pressure.
Free Command Memory Usage Bioinformatics: Step by Step
This walkthrough shows the exact sequence to follow on any Linux server before and during an analysis. Each step uses a real command with expected output.
Step 1. Get a Human Readable Baseline
free -hThe -h flag stands for human readable. Output:
               total        used        free      shared  buff/cache   available
Mem:            62Gi        8.4Gi        39Gi       0.5Gi        12Gi        51Gi
Swap:          8.0Gi          0B       8.0Gi
Now each value carries a unit suffix. Gi means GiB (gibibyte, 1024 MiB). This single command answers the baseline question: how much memory can I actually hand to a job right now. In this example the answer is roughly 51 GiB of the 62 GiB installed.
Run this on your login node, then on each compute node you plan to use if you have direct access. Node configurations frequently differ, and assumptions about "the server" are a common source of failed jobs.
Step 2. Get Machine Parseable Numbers
For scripts and calculations, use an explicit unit. -m reports in mebibytes (MiB) and -g reports in gibibytes (GiB):
free -m total used free shared buff/cache available
Mem: 64277 11737 40264 500 12726 52250
Swap: 8191 0 8191Megabyte-level granularity is precise enough for job sizing and easy to do arithmetic on. The -b and -k flags report bytes and kibibytes for cases where you need exact values. Note that -g truncates rather than rounds, so a node with 62.9 GiB reports 62 under -g. When in doubt, use -m.
Step 3. Decide Whether Your Job Fits
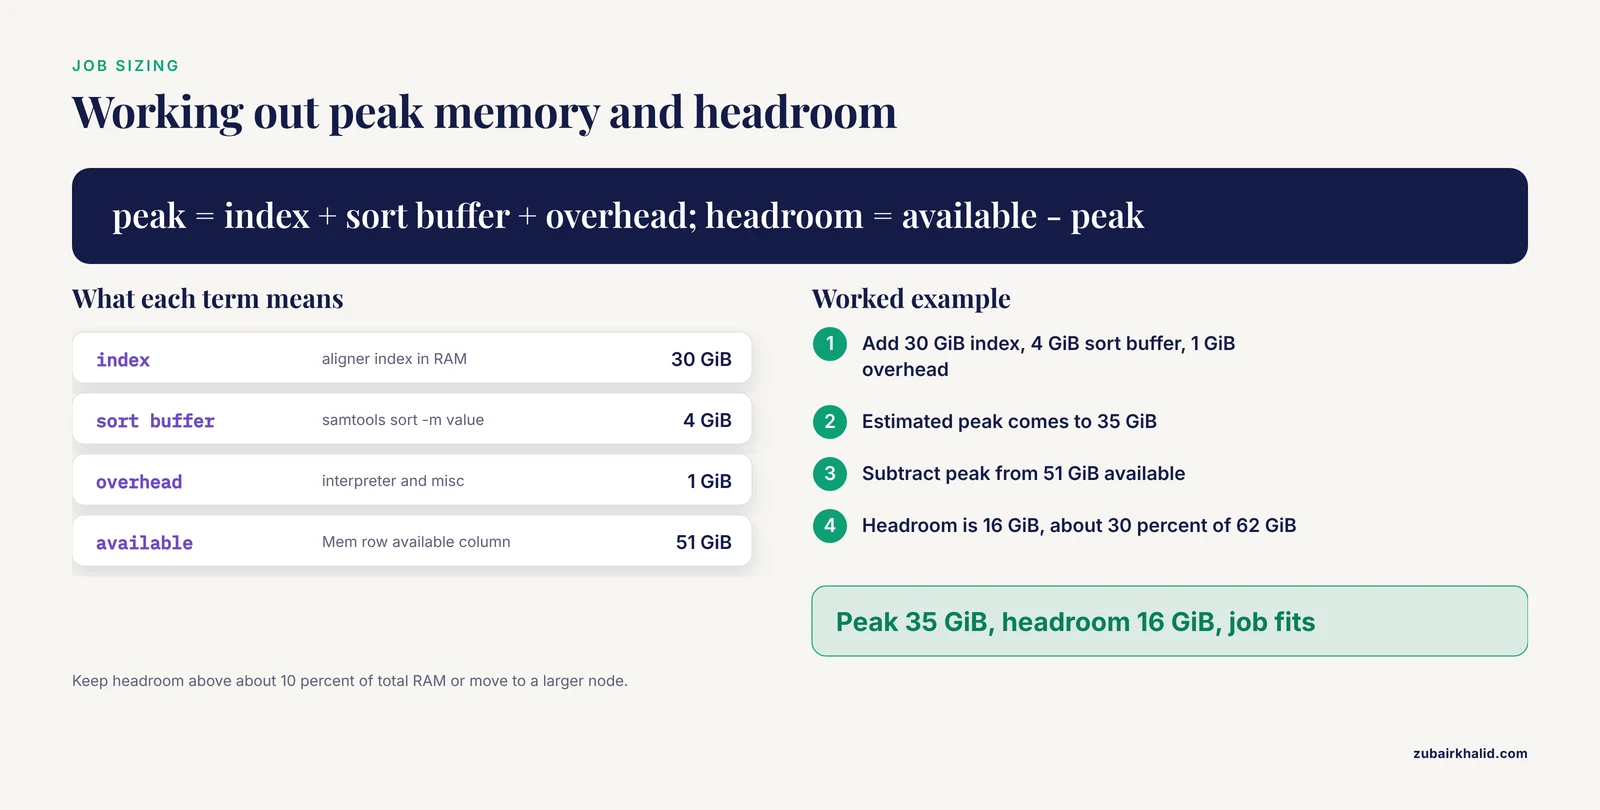
Take the memory requirement of your tool and compare it to available. Say you plan to run a splice-aware alignment that loads a human genome index consuming roughly 30 GiB, and your sorting stage is configured with a 4 GiB buffer. Estimate the peak as the sum of the major concurrent allocations:
Aligner with index loaded:      30 GiB
Sort buffer:                     4 GiB
Interpreter and overhead:        1 GiB
Estimated peak:                 35 GiB
Then compare against the measured value:
Available on node:              51 GiB
Estimated peak:                 35 GiB
Headroom:                       16 GiB
Sixteen GiB of headroom, roughly 30 percent of total RAM, is a comfortable margin for page cache, transient allocations, and estimation error. If headroom drops under about 10 percent of total RAM, either reduce the job's memory footprint or move it to a larger node. These percentages are practical rules of thumb from working pipeline practice, not hard kernel thresholds, so adjust them to your own failure history.
Step 4. Separate Buffers and Cache on Older Outputs
On current versions of procps-ng, buff/cache is a single combined column. If you want the two components split, use the wide flag:
free -w total used free shared buffers cache available
Mem: 62Gi 8.4Gi 39Gi 0.5Gi 1.2Gi 11Gi 51Gi
Swap: 8.0Gi 0B 8.0Gibuffers are kernel block device metadata buffers. cache is the page cache proper, including the file contents your FASTQ and BAM reads populate. On very old procps releases (before version 3.3.10) this split view is the default and there is no available column at all. If your output lacks available, compute an approximation as free plus buffers plus cached from /proc/meminfo, or better, upgrade procps.
Step 5. Watch Memory Change Over Time
A single snapshot tells you the state at one instant. Pipelines move memory in waves, for example a low-footprint quality trim step followed by a memory-heavy alignment. Sample repeatedly with the repeat flag:
free -h -s 5 -c 12This prints a new table every 5 seconds for 12 samples, then exits. Output blocks appear one after another:
               total        used        free      shared  buff/cache   available
Mem:            62Gi        8.4Gi        39Gi       0.5Gi        12Gi        51Gi
Swap:          8.0Gi          0B       8.0Gi

               total        used        free      shared  buff/cache   available
Mem:            62Gi        9.1Gi        38Gi       0.5Gi        12Gi        51Gi
Swap:          8.0Gi          0B       8.0Gi
Omit -c and the command samples forever until you press Ctrl+C. If you omit -c, redirect the output to a log file so you keep a record.
A simple logging loop captures memory alongside timestamps for post-run review:
while true
do
  date
  free -m | grep Mem
  sleep 60
done > memory.log 2>&1
Run it in a separate terminal or under nohup, and stop it when the job finishes. The log gives you the memory profile of the whole pipeline, which is exactly what you need to write scheduler requests for the next run.
Many people prefer the visual refresh of watch:
watch -n 5 free -hThis redraws the table every 5 seconds in a full-screen view and highlights the differences between refreshes, which makes upward memory trends easy to spot at a glance.
Step 6. Get Per Field Detail From /proc/meminfo
When free raises more questions than it answers, go to the source:
grep -E 'MemTotal|MemFree|MemAvailable|Buffers|^Cached|SwapTotal|SwapFree|Slab' /proc/meminfoTypical output:
MemTotal:       65806968 kB
MemFree:        40264120 kB
MemAvailable:   52250108 kB
Buffers:         1228844 kB
Cached:         11501260 kB
SwapTotal:       8388604 kB
SwapFree:        8388604 kB
Slab:             891124 kB
The Slab line matters in bioinformatics because the kernel's directory entry cache (dentry) and inode cache live in slab memory. Machines that walk millions of small files, for example during BAM index maintenance or large dataset staging, can accumulate substantial slab usage. free's available estimate already accounts for reclaimable slab, but the raw slab number explains otherwise puzzling gaps between used and your process list.
Step 7. Add a Totals Row
free -h -tThis appends a Total row combining RAM and swap:
               total        used        free      shared  buff/cache   available
Mem:            62Gi        8.4Gi        39Gi       0.5Gi        12Gi        51Gi
Swap:          8.0Gi          0B       8.0Gi
Total:          70Gi        8.4Gi        47Gi
Use this mainly for reporting and documentation. For capacity planning, rely on the Mem row's available value, because swapping a bioinformatics job is rarely an acceptable outcome even when the total technically fits.
Key Options at a Glance
| Option | What it does | Typical bioinformatics use |
|---|---|---|
| , - | , - | , - |
-h | Human readable units (Ki, Mi, Gi) | Fast manual checks before launching |
-b | Bytes | Exact values for scripts |
-k | KiB | Default precision, matches /proc/meminfo |
-m | MiB | Job sizing arithmetic |
-g | GiB | Quick large-scale checks, truncates |
-s N | Repeat every N seconds | Tracking a running pipeline |
-c N | Stop after N samples | Bounded monitoring runs |
-w | Split buffers and cache columns | Diagnosing cache-heavy nodes |
-t | Add a RAM plus swap total row | Reporting node capacity |
Common Errors With the free Command and Their Fixes
The command is not installed. On minimal container images and slim cloud instances you may see:
bash: free: command not foundThe fix is to install the procps package. On Debian and Ubuntu:
sudo apt-get update && sudo apt-get install procpsOn RHEL, CentOS, Rocky, and Fedora:
sudo dnf install procps-ngInside a container you may not have sudo. Either install as root within the container or read /proc/meminfo directly with cat or grep, which requires no package at all.
You typed an unsupported option. The error looks like this, with the offending letter after the word option:
free: invalid option
free: incorrect option
Check the flag against the table above. A frequent cause is copying an option from BSD or macOS documentation, where free does not exist in the same form. On macOS the nearest equivalents come from vm_stat and top.
Output wraps across lines in a narrow terminal. The wide format with -w shortens each line by splitting buff/cache into two columns, or simply widen the terminal window before running free -h.
The command seems to hang and never exits. You probably used -s without -c. That behavior is by design. Press Ctrl+C to stop, or add -c with a sample count.
Numbers disagree between two tools. free, top, and monitoring dashboards sample at different moments and define categories differently, so small disagreements are normal. Large disagreements usually mean you are comparing free on the host with a tool measuring a single process, or comparing host memory with a container limit. See the section on schedulers and containers below.
Using free With Job Schedulers and Containers

On an HPC cluster managed by Slurm, free reports the whole physical memory of the node, not your allocation. If your batch script requests 40 GiB with a directive such as mem=40G in the SBATCH header, and the node has 512 GiB total, free -h inside the job still shows the node's full totals. To see what your job actually consumed, use the scheduler's accounting output, for example sacct with memory fields, or run /usr/bin/time -v around your command, which reports "Maximum resident set size" at completion.
/usr/bin/time -v bwa mem reference.fa reads.fq > aligned.sam 2> align.logThe log will contain a line like:
Maximum resident set size (kbytes): 34816000That peak, about 33.2 GiB, is the number to request from the scheduler next time, plus headroom. This combination, free for node-level reality and /usr/bin/time -v for job-level peaks, is the practical core of memory management in linux for bioinformatics.
The same distinction applies to containers. Inside a Docker or Singularity container, free typically shows host memory, while the container may be capped at a lower limit through a cgroup. A job can exceed the container's cap and be killed even though free reports plenty of available memory. When working in containers, treat the cgroup limit, not the host's available value, as your budget, and verify actual usage with the container runtime's statistics command or the cgroup memory files under /sys/fs/cgroup.
Practical Tips for Memory-Safe Bioinformatics Pipelines
These free command memory usage bioinformatics tips come from recurring patterns in real pipeline work.
Check memory at the exact moment of launch. A node that was empty an hour ago may now host a colleague's 200 GiB assembly. Run free -h immediately before submitting, and again right after the job starts.
Give each memory-hungry tool an explicit budget. Most bioinformatics tools accept a memory flag, and setting it explicitly prevents a single stage from consuming everything:
samtools sort -m 4G -T tmpsort -o sorted.bam aligned.bam
sort -S 8G -k1,1 large_table.txt
For Java-based tools such as GATK and Picard, set the JVM heap with the -Xmx flag, for example -Xmx32g. Leave room outside the heap for the JVM's own overhead, which is typically several GiB for large heaps.
Cap tools that cache indexes in RAM. Index loading is where many pipelines peak. If your aligner's index almost fills the node, the job will fail at startup or during a later concurrent allocation, so measure the peak with /usr/bin/time -v on a small test input first.
Watch the Swap row during long jobs. If used swap climbs above zero while your pipeline runs, the node is under memory pressure and every swapped page costs you disk-speed instead of RAM-speed. Treat nonzero swap growth during a memory-sensitive stage as a signal to reduce concurrency or move the job.
Correlate memory with the pipeline stage. Pair your free log with the pipeline's own progress output, for example the per-file messages from an aligner. When a failure happens, you want to know both what stage was running and what the memory profile looked like at that moment. Root-cause analysis of workflow failures works best when measurements and process stages are captured together, a principle that applies to workflow improvement in any domain where service quality depends on repeatable process execution [2].
Verify optimizations with before and after numbers. When you switch to a leaner tool version or adjust flags, record peak memory from before and after runs. Published work shows the payoff of such measurement: the crux-lfq command in Crux v5.0 reduced memory usage by 26 percent relative to its predecessor while also running 1.9 times faster, a gain that only became demonstrable because memory was measured [1]. Your own comparisons can be just as concrete.
Common Mistakes and Limitations
The following mistakes account for most confusion around free in bioinformatics settings.
Reading the free column as usable memory. The single most common error. The free column excludes reclaimable page cache, so it understates what you can allocate. Use available.
Assuming buff/cache is wasted memory. It is the opposite. The page cache accelerates repeated reads of your reference genomes and FASTQ files. The kernel hands it back the moment a process needs RAM. Do not run cache-dropping commands to "clean up" memory, because this only slows your next reads and changes nothing about real capacity.
Confusing GiB with GB. free uses binary units, so 62Gi is 62 gibibytes, about 66.6 billion bytes. Marketing specifications for servers usually quote decimal GB, so a "64 GB" server reports roughly 62 GiB under free -h. When your math is off by about 7 percent, this is usually why.
Trusting a single snapshot for a variable job. Memory usage in a pipeline is a curve, not a constant. A snapshot taken during the trim stage tells you nothing about the assembly stage. Use repeated sampling or /usr/bin/time -v to capture the peak.
Believing free inside a container or cgroup-limited job. As described above, free shows host totals. Inside a capped container it can report memory that your process cannot use, leading to jobs killed by the cgroup out-of-memory handler despite healthy-looking free output.
Expecting per-process attribution. free aggregates everything. To find which process holds memory, use ps aux, sort=-rss (with the sort expression written out in your shell) or top sorted by resident memory. A two-line ps query usually identifies the culprit in seconds.
Ignoring the OOM killer's silence. When the kernel kills a process for memory, the pipeline may simply stop with a generic nonzero exit. Check the kernel log for confirmation:
dmesg | grep -i "out of memory"or on systemd systems:
journalctl -k | grep -i "oom"If you find an OOM event, your job peaked above what was available, and the fix is a larger allocation or a smaller footprint, not a retry with identical settings.
Over-relying on swap. Swap makes a job "fit" on paper while running orders of magnitude slower. A pipeline that thrashes through swap can take days where it would take hours in RAM. Design for the Mem row, treat swap as a safety net.
One limitation worth stating plainly. These commands describe the machine, not your science. The right memory allocation for a given dataset depends on the tool, its parameters, and the data itself, so individual cases need testing on a small input before the full run.
A Complete Worked Example From Check to Verify
Here is the full sequence for a realistic job, a RNA-seq alignment on a shared 62 GiB node.
One. Baseline check before launch.
free -h total used free shared buff/cache available
Mem: 62Gi 8.4Gi 39Gi 0.5Gi 12Gi 51Gi
Swap: 8.0Gi 0B 8.0GiAvailable is 51 GiB.
Two. Estimate the peak. The aligner index for a mouse transcriptome plus genome consumes roughly 30 GiB, the sort buffer is set to 4 GiB, and overhead is about 1 GiB, so the estimated peak is 35 GiB. Headroom is 16 GiB, comfortably above the 10 percent rule of thumb. Proceed.
Three. Start monitoring in a second terminal.
watch -n 5 free -hFour. Launch the job with an explicit budget.
/usr/bin/time -v hisat2 -x mm10_index -1 sample_R1.fq -2 sample_R2.fq 2> hisat2.log | samtools sort -m 4G -T tmpsort -o sample.sorted.bamFive. Observe the wave. During index loading, used climbs from 8.4 GiB toward 40 GiB. During sorting it plateaus near 35 to 40 GiB. Swap stays at zero. All healthy signs.
Six. Verify the peak. The hisat2.log file contains the /usr/bin/time -v output:
Maximum resident set size (kbytes): 33619968That is about 32 GiB peak for the aligner stage, close to the estimate. Record it in your pipeline notes. Next time you request memory from a scheduler for this stage, you request 36 to 40 GiB and have a measured justification.
Seven. Confirm the node recovered. After the job completes, one more free -h shows available returning toward its baseline as the process tree exits and the page cache normalizes. If available stays depressed, a child process or a hung intermediate may still be running, which ps will confirm.
Frequently Asked Questions
What is the difference between free and available memory in the free command?
The free column counts only completely unused RAM, while available estimates how much memory can be handed to new work after the kernel reclaims cache. Always use available for capacity decisions.
Does the free command report memory in GiB or GB?
It reports binary units, so -h output in Gi means gibibytes, each equal to 1024 mebibytes. A server advertised with decimal GB will show a smaller GiB number under free.
How do I see memory usage updating in real time?
Run watch -n 5 free -h for a self-refreshing view every 5 seconds, or free -h -s 5 -c 20 to print 20 samples and exit.
Why does my idle server show almost no free memory?
The kernel uses spare RAM for the page cache to speed up file reads, which pushes the free column down. That memory is reclaimable, which is why available stays high.
How do I find which process is using the most memory?
free is system-wide only. Use top, htop, or ps aux sorted by resident set size to identify the specific process.
Why does free show different memory than my Slurm allocation?
free reports the whole physical node, not your allocation. Check job-level usage with the scheduler's accounting tools or with /usr/bin/time -v around your command.
How much available memory do I need before starting an alignment?
Compare the tool's estimated peak, including its index, against available, and keep headroom of roughly 10 percent of total RAM or more. Measure the real peak on a small input with /usr/bin/time -v before scaling up.
Can I use the free command on macOS?
No. free is part of the Linux procps package. On macOS use vm_stat or top instead, and on Windows-based workflows check memory through the task manager or WSL.
Further Reading
- Advancements in rapid sludge moisture content detection: A comprehensive review of methods and online monitoring techniques.
- Real-time intelligence framework for microplastic monitoring and coastal resilience.
- Controlling ammonia in aquatic environments: a critical review linking monitoring, prevention, and recovery.