How to Use findOverlaps with GRanges in R
By Dr. Zubair Khalid, DVM, MS, PhD ·

By the end of this walkthrough you will be able to take two sets of genomic intervals, such as ChIP-seq peaks and gene models, find every overlapping pair with findOverlaps, reshape the result into an analysis-ready table, control exactly what counts as a match, and verify that the numbers you report are correct. You will also know why findOverlaps sometimes returns zero hits when the coordinates look like they overlap, and how to fix each cause.
You need R 4.1 or newer, the BiocManager installer, and the GenomicRanges package from the Bioconductor project. The IRanges package, which provides the underlying interval algebra, attaches automatically with GenomicRanges. Two optional packages help with real-world data: rtracklayer for reading BED and GTF files, and GenomeInfoDb for chromosome naming. Everything in this tutorial runs in memory on a laptop.
Interval overlap testing is one of the most frequent tasks in R for bioinformatics. Peaks versus genes, variants versus exons, reads versus transcripts, motifs versus promoters, all reduce to the same question: which intervals in set A share at least one position with which intervals in set B. The findOverlaps function answers that question, and this guide treats it as a short Bioconductor tutorial focused on one task done well.
What findOverlaps Does
A GRanges object is Bioconductor's standard container for genomic intervals. It stores, for each range, four things: a chromosome name (the seqnames), a start and end position held in an IRanges object, a strand (+, -, or * for unstranded), and any number of metadata columns (mcols) such as gene IDs or scores. It also carries a seqinfo payload that records chromosome names, lengths, and the genome assembly, which becomes useful for consistency checks later.
findOverlaps(query, subject) compares every range in the query against every range in the subject and returns a Hits object: a compact structure of integer indices listing each pair that overlaps under the rules you set. The query is the set of ranges you are asking about, and the subject is the reference collection you are asking against. The two roles matter, because several related functions treat them asymmetrically.
Before running anything, internalize the coordinate system. GRanges and IRanges use 1-based, closed coordinates, meaning both the start and the end position are included in the range. A gene listed as chr1:1000-1800 covers 1800 - 1000 + 1 = 801 positions. BED files use a different convention, 0-based and half-open, where the end is excluded. Import tools handle that conversion for you, and manual conversion is a classic source of off-by-one errors, a point that returns in the mistakes section.
The core operation is simple set arithmetic on integers. Two ranges overlap when they share at least one position on the same chromosome, with compatible strands. Everything else in this tutorial, the type, minoverlap, maxgap, and select arguments, refines that definition.
Installing the Packages
Install from Bioconductor with BiocManager, then attach the library:
if (!requireNamespace("BiocManager", quietly = TRUE)) {
    install.packages("BiocManager")
}
BiocManager::install("GenomicRanges")

library(GenomicRanges)
packageVersion("GenomicRanges")
The last line prints your installed version, for example '1.58.0'. Any reasonably recent release supports everything shown here. If library(GenomicRanges) fails with Error in library(GenomicRanges) : there is no package called 'GenomicRanges', run the BiocManager::install() line first. If you skip the library call entirely, the first findOverlaps attempt fails with Error: could not find function "findOverlaps", because the function lives in IRanges and reaches your session through GenomicRanges.
Record sessionInfo() output when you publish an analysis. Overlap results do not depend on package version in most cases, but reviewers appreciate the record.
Building Test GRanges Objects
The cleanest way to learn the semantics is with four fake genes and five fake peaks, small enough to check by hand:
genes <- GRanges(
  seqnames = c("chr1", "chr1", "chr2", "chr3"),
  ranges   = IRanges(start = c(1000, 5000, 2000, 8000),
                     end   = c(1800, 5600, 2600, 8900)),
  strand   = c("+", "-", "+", "+"),
  gene_id  = paste0("gene", 1:4)
)

peaks <- GRanges(
  seqnames = c("chr1", "chr1", "chr2", "chr4", "chr1"),
  ranges   = IRanges(start = c(1500, 5200, 2300, 1000, 1150),
                     end   = c(1700, 5400, 2500, 1200, 1250)),
  strand   = rep("*", 5),
  peak_id  = paste0("peak", 1:5)
)

genes
peaks
Printing genes gives:
GRanges object with 4 ranges and 1 metadata column:
    seqnames    ranges strand |   gene_id
       <Rle> <IRanges>  <Rle> | <character>
  [1]     chr1   1000-1800      + |      gene1
  [2]     chr1   5000-5600      - |      gene2
  [3]     chr2   2000-2600      + |      gene3
  [4]     chr3   8000-8900      + |      gene4
  -------
  seqinfo: 3 sequences from an unspecified genome
The peaks print similarly, with five ranges spread over three chromosome names. The strand value * means unstranded, which is what most peak callers produce, and it matches both + and - during overlap tests. The gene_id and peak_id columns are mcols, and they ride along through subsetting, which is what makes the join step later so convenient.
findOverlaps with GRanges, Step by Step
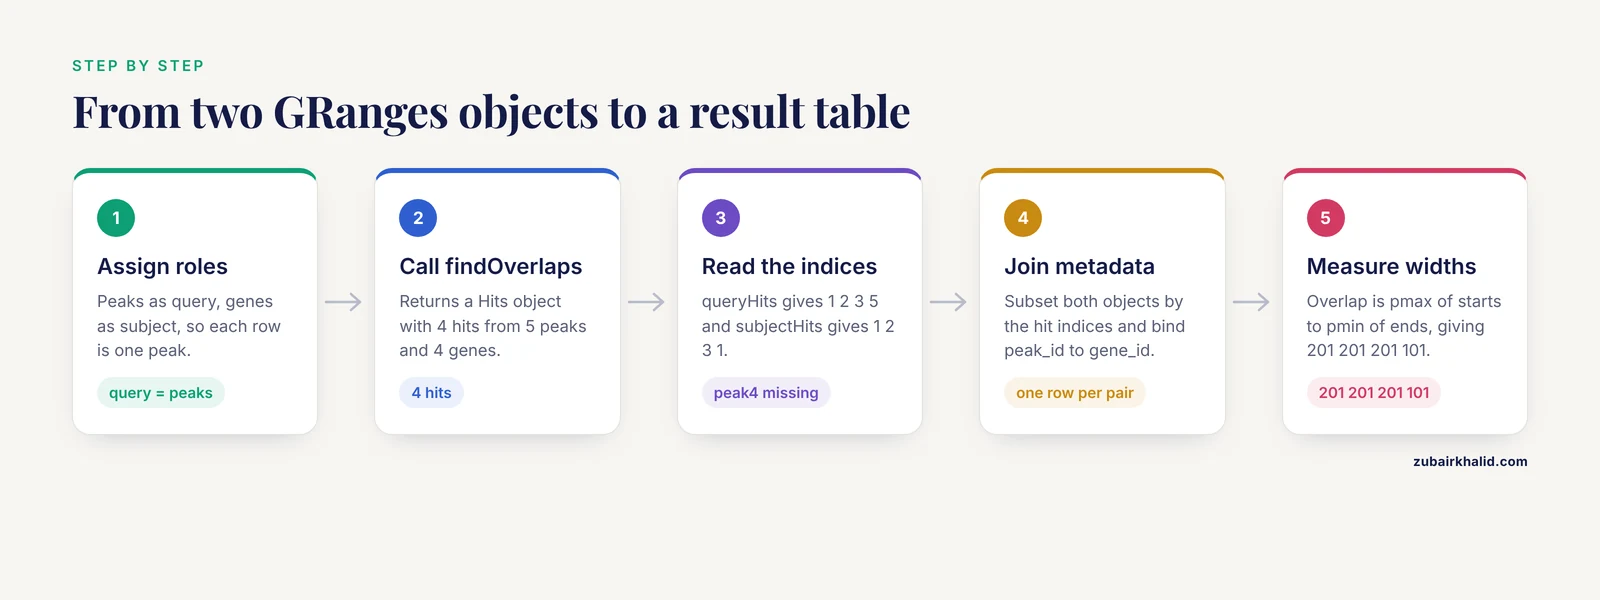
This is the working heart of the tutorial. The biological question: which peaks fall inside or overlap which genes, and by how much.
Step 1: Assign Query and Subject Roles
Decide which set drives the result. Here the peaks are the query, because you want one row of thinking per peak, and the genes are the subject. If you later want per-gene counts, you can swap the roles in a second call.
Step 2: Call findOverlaps
hits <- findOverlaps(peaks, genes)
hits
Output:
Hits object with 4 hits and 0 metadata columns:
      queryHits subjectHits
       <integer>   <integer>
  [1]         1           1
  [2]         2           2
  [3]         3           3
  [4]         5           1
  -------
  queryLength: 5 / subjectLength: 4
Four pairs survived. Reading them: peak1 overlaps gene1, peak2 overlaps gene2, peak3 overlaps gene3, and peak5 also overlaps gene1. Peak4 sits on chr4, where no gene exists, so it produced nothing. Rows come back ordered by query index, then subject index, and the footer confirms the lengths of both inputs.
Step 3: Read the Hits Object
A Hits object is two parallel integer vectors, not a table of ranges. Extract the indices with the accessors:
queryHits(hits)
# [1] 1 2 3 5

subjectHits(hits)
# [1] 1 2 3 1
Position 4 of the peaks never appears on the query side, which is how you know it had no match. Convert the whole thing to a plain table when you want to inspect it:
as.data.frame(hits) queryHits subjectHits
1 1 1
2 2 2
3 3 3
4 5 1Step 4: Build a Result Table with Metadata
Use the hit indices to subset both objects and bind the metadata together. This is the join step, and it is where findOverlaps pays off compared with hand-rolled matching:
results <- data.frame(
  peak_id    = peaks$peak_id[queryHits(hits)],
  gene_id    = genes$gene_id[subjectHits(hits)],
  chr        = as.character(seqnames(peaks))[queryHits(hits)],
  peak_start = start(peaks)[queryHits(hits)],
  peak_end   = end(peaks)[queryHits(hits)],
  gene_start = start(genes)[subjectHits(hits)],
  gene_end   = end(genes)[subjectHits(hits)]
)
results
peak_id gene_id chr peak_start peak_end gene_start gene_end
1 peak1 gene1 chr1 1500 1700 1000 1800
2 peak2 gene2 chr1 5200 5400 5000 5600
3 peak3 gene3 chr2 2300 2500 2000 2600
4 peak5 gene1 chr1 1150 1250 1000 1800One warning that saves debugging time: if a query range hits three subjects, it contributes three rows to this table. That duplication is correct join behavior, but downstream code that assumes one row per peak will silently miscount. Decide early whether you want all pairs, or one representative pair per query.
Step 5: Measure Overlap Widths
The number of shared positions per pair comes from straightforward arithmetic on the matched pairs. For each hit, the overlap starts at the larger of the two starts and ends at the smaller of the two ends:
q_idx <- queryHits(hits)
s_idx <- subjectHits(hits)

ov_start <- pmax(start(peaks)[q_idx], start(genes)[s_idx])
ov_end   <- pmin(end(peaks)[q_idx],   end(genes)[s_idx])
ov_width <- pmax(ov_end - ov_start + 1, 0)
ov_width
# [1] 201 201 201 101
Check one by hand: peak1 spans 1500-1700 and gene1 spans 1000-1800, so the shared block is 1500-1700, which is 201 positions inclusive. The final pmax(..., 0) guards against negative values if you reuse this code on pairs that might not overlap. The pintersect() function computes the same thing for pairs you already know overlap, returning a GRanges of the shared blocks.
Controlling the Match: Every Argument That Matters
The default call answers the loosest question: any shared position counts. Five arguments tighten or loosen that definition. Each is best learned with a three-range example you can verify in your head.
type
The type argument changes what geometry qualifies as a match:
q <- GRanges("chr1", IRanges(100, 300))
s <- GRanges(c("chr1", "chr1", "chr1"),
             IRanges(start = c(100, 150, 400),
                     end   = c(250, 320, 500)))

findOverlaps(q, s)                 # 2 hits: q vs s1 and q vs s2
findOverlaps(q, s, type = "start") # 1 hit:  q vs s1 only
findOverlaps(s, q, type = "within")# 1 hit:  s1 inside q
The default "any" keeps every pair with at least one shared position, so s1 (100-250) and s2 (150-320) both hit. type = "start" requires identical start positions plus an overlap, which keeps only s1. type = "within" requires the query to sit entirely inside the subject, so flipping the roles shows that s1 (100-250) fits inside q (100-300) while s2 (150-320) pokes out past position 300. There is also type = "end" for identical ends and type = "equal" for a perfect match of chromosome, interval, and strand.
minoverlap
minoverlap sets a floor on the number of shared positions, which is how you demand more than a one-base touch:
q <- GRanges("chr1", IRanges(100, 110))
s <- GRanges("chr1", IRanges(106, 120))

findOverlaps(q, s)                  # 1 hit, 5 shared positions (106-110)
findOverlaps(q, s, minoverlap = 5)  # 1 hit
findOverlaps(q, s, minoverlap = 6)  # 0 hits
The shared block 106 through 110 contains exactly 5 positions, so the threshold at 6 kills the hit. This argument is the right tool when a single stray base at a boundary would otherwise create a spurious annotation.
maxgap
maxgap extends matching to nearby ranges that do not literally touch. It is the number of positions you allow between two ranges and still call them a match:
q <- GRanges("chr1", IRanges(100, 200))
s <- GRanges("chr1", IRanges(260, 300))

findOverlaps(q, s)                # 0 hits
findOverlaps(q, s, maxgap = 100)  # 1 hit
Fifty-nine positions separate the two ranges (201 through 259), so a maxgap of 100 bridges them. The default value of -1 disables gap bridging entirely, so only true overlaps survive. Two cautions: maxgap measures the gap between ranges, not the distance between their start positions or midpoints, and its interaction with type = "start", "end", and "within" has extra rules documented on the ?findOverlaps man page. When a collaborator says "call it overlapping if it is within 50 bases", maxgap = 50 is usually the parameter they mean, but confirm whether they measure from the interval edge or the center.
select
By default you get every pair. The select argument collapses the result to at most one hit per query element:
q <- GRanges("chr1", IRanges(start = c(100, 500, 900),
                             end   = c(200, 600, 950)))
s <- GRanges(c("chr1", "chr1", "chr1"),
             IRanges(start = c(150, 180, 550),
                     end   = c(160, 190, 580)))

findOverlaps(q, s)
# 3 hits: (1,1), (1,2), (2,3)

findOverlaps(q, s, select = "first")
# [1]  1  3 NA
Query 1 hit two subjects, so select = "first" keeps the lowest subject index for it. Query 3 had no hit at all and comes back as NA. The choices are "all" (default), "first", "last", and "arbitrary", where "arbitrary" makes no promise about which hit you get. For biologically meaningful selection, such as the highest-scoring peak per gene, retrieve all hits and rank them yourself with mcols values.
Summary of key options
| Argument | Default | What it controls | Typical example |
|---|---|---|---|
type | "any" | Match geometry: "any", "start", "end", "within", "equal" | type = "within" |
minoverlap | 0 | Minimum shared positions required per hit | minoverlap = 20 |
maxgap | -1 | Bridges gaps up to this many positions between ranges | maxgap = 50 |
ignore.strand | FALSE | When TRUE, ignores strand entirely | ignore.strand = TRUE |
select | "all" | Keeps one hit per query instead of all | select = "first" |
Strand Rules and ignore.strand
For GRanges, findOverlaps respects strand by default. The matching rules are: + matches only +, - matches only -, and * matches anything. A demonstration worth memorizing:
plus_peak  <- GRanges("chr7", IRanges(5500, 5600), strand = "+")
minus_gene <- GRanges("chr7", IRanges(5550, 5700), strand = "-")

findOverlaps(plus_peak, minus_gene)                        # 0 hits
findOverlaps(plus_peak, minus_gene, ignore.strand = TRUE)  # 1 hit

any_strand <- GRanges("chr7", IRanges(5550, 5700), strand = "*")
findOverlaps(plus_peak, any_strand)                        # 1 hit
The ranges overlap by 51 positions, yet the default call returns nothing because + and - are incompatible. Set ignore.strand = TRUE whenever strand is meaningless for your comparison, such as ATAC-seq peaks against gene bodies. Conversely, never set it reflexively, because strand-aware matching is exactly what you want when pairing spliced reads to transcripts.
Unstranded features deserve special attention. Peak callers typically emit *, which happily matches annotated genes on either strand, so peak-to-gene overlaps rarely need ignore.strand. Motif matches and RNA-seq features, which carry real strand, are where silent strand mismatches bite.
The Overlap Function Family
findOverlaps anchors a family of convenience wrappers that save you from extracting indices manually. All accept the same type, minoverlap, maxgap, and ignore.strand arguments.
| Function | Returns | Typical use |
|---|---|---|
findOverlaps() | Hits object | Pair identities for joins |
countOverlaps() | Integer vector, one value per query | How many subjects hit each query |
overlapsAny() or %over% | Logical vector | Filter one set by another |
subsetByOverlaps() | GRanges | Keep only query ranges that overlap |
nearest() | Integer vector | Closest subject, even without overlap |
mergeByOverlaps() | Combined table | Paired query and subject metadata in one object |
Watching the query-subject asymmetry in action:
countOverlaps(peaks, genes)
# [1] 1 1 1 0 1

countOverlaps(genes, peaks)
# [1] 2 1 1 0
The first call counts, per peak, how many genes it touches. The second counts, per gene, how many peaks touch it. Gene1 absorbs two peaks, so its count is 2, while four of five peaks have exactly one gene. Same four underlying pairs, different summaries, and choosing the wrong direction is a real analysis bug.
Filtering and subsetting:
peaks %over% genes
# [1] TRUE TRUE TRUE FALSE TRUE

subsetByOverlaps(peaks, genes)
GRanges object with 4 ranges and 1 metadata column:
seqnames ranges strand | peak_id
<Rle> <IRanges> <Rle> | <character>
[1] chr1 1500-1700 * | peak1
[2] chr1 5200-5400 * | peak2
[3] chr2 2300-2500 * | peak3
[4] chr1 1150-1250 * | peak5
-------
seqinfo: 3 sequences from an unspecified genomeTwo set-operation functions round out the toolkit, and they answer different questions than findOverlaps. intersect(peaks, genes) returns the shared genomic space with overlapping blocks merged, which for the toy data is 953 positions across three blocks on chr1 and chr2. nearest(peaks, genes) returns the closest gene for every peak regardless of overlap, giving 1 2 3 NA 1 here, with NA for the chr4 peak because no gene shares its chromosome. Use findOverlaps when you need the pairs, intersect when you need the shared bases, and nearest when absence of overlap is itself informative.
Working with Real Files: BED, GTF, and Data Frames
Toy objects prove semantics, but real analyses start from files. The rtracklayer package imports common formats directly into GRanges and handles coordinate conversion correctly:
library(rtracklayer)

peaks <- import("peaks.bed", format = "bed")
gtf   <- import("annotation.gtf", format = "gtf")
exons <- gtf[gtf$type == "exon"]
BED coordinates arrive converted from the file's 0-based half-open convention into GRanges' 1-based closed convention, which removes the single most common source of one-base errors. GTF and GFF imports carry attributes such as gene_id and transcript_id as metadata columns, so you can filter to exons or genes before overlapping.
If your data lives in a data frame, makeGRangesFromDataFrame builds the object for you:
df <- data.frame(
  chrom = c("chr1", "chr1", "chr2"),
  start = c(1500, 5200, 2300),
  end   = c(1700, 5400, 2500),
  score = c(42.1, 18.7, 33.3)
)

peaks <- makeGRangesFromDataFrame(df, keep.extra.columns = TRUE)
peaks
GRanges object with 3 ranges and 1 metadata column:
seqnames ranges strand | score
<Rle> <IRanges> <Rle> | <numeric>
[1] chr1 1500-1700 * | 42.1
[2] chr1 5200-5400 * | 18.7
[3] chr2 2300-2500 * | 33.3
-------
seqinfo: 2 sequences from an unspecified genomeThe function auto-detects column names like chrom, start, and end, and assigns * strand when none is provided. Pass keep.extra.columns = TRUE or your score column vanishes.
Two harmonization steps prevent most real-world zero-hit mysteries. First, chromosome naming must agree between query and subject. Inspect both sides with seqlevels(peaks) and seqlevels(genes), and reconcile with a rename such as seqlevels(peaks) <- sub("^chr", "", seqlevels(peaks)) or with GenomeInfoDb::seqlevelsStyle(). Second, confirm that both objects refer to the same genome build, recorded in genome(peaks) and genome(genes) when set. Peaks called on one assembly will not land on genes from another, and nothing in the overlap machinery will warn you.
A frequent derived question is peak-to-promoter assignment. Build promoter intervals explicitly, then overlap against them:
proms <- promoters(genes, upstream = 2000, downstream = 200)
hits_prom <- findOverlaps(peaks, proms)
Performance Tips for Larger Data
findOverlaps does not compare every query against every subject. It builds an indexed interval structure over the subject, so the cost tracks the number of hits produced rather than the full query-by-subject grid. Millions of short ranges against a few hundred thousand annotations is routine on a workstation. The practical tips concern avoiding waste:
- Batch your queries. One call with 100,000 ranges beats 100,000 calls with one range, because the subject index gets built once. If you find
findOverlapsinside a loop, hoist it out and split the Hits afterward:
hits <- findOverlaps(peaks, genes)
hits_per_peak <- split(subjectHits(hits), queryHits(hits))- Request counts when counts suffice.
countOverlapsandoverlapsAnyavoid materializing pair identities, which saves memory on large jobs. - Collapse redundant subjects. Overlapping transcript models multiply hits for the same locus.
reduce(genes, ignore.strand = TRUE)merges them into disjoint blocks, though it drops metadata columns, so keep the original for attribute lookups. - Trim the result early.
select = "first"or"arbitrary"caps output size when you only need one anchor per query. - Split by chromosome for very large jobs, running
findOverlapson per-chromosome subsets and recombining the Hits. This bounds peak memory and makes failures easier to isolate. - Delay conversion. Operating on the Hits indices is cheaper than repeatedly coercing GRanges objects to data frames.
If a project outgrows all of this, the honest escape hatch is chunking by genome region rather than switching toolkits, because strand rules and seqinfo consistency are exactly what you lose when you hand-roll interval matching elsewhere.
Checking That Your Results Are Right
Overlap code fails quietly, so build in three cheap checks on every analysis.
First, cross-check totals. The number of Hits rows must equal the sum of per-query counts:
length(hits) == sum(countOverlaps(peaks, genes))
# [1] TRUE
Second, recompute a few pairs by hand. Take the first hit, print both ranges, and do the arithmetic:
peaks[queryHits(hits)[1]]
genes[subjectHits(hits)[1]]
Peak1 spans chr1:1500-1700 and gene1 spans chr1:1000-1800, so every peak base lies inside the gene and the overlap width must equal the peak width, 201. Confirm the computed vector agrees. If you used minoverlap, assert that every width clears the threshold:
all(ov_width > 0)
all(ov_width >= 5)   # if minoverlap = 5 was used
summary(ov_width)    # look for suspicious one-base hits
Third, sanity-check the biology at known loci. A housekeeping gene with a strong signal in your peak file should appear in the results, and a chromosome absent from the annotation should contribute zero hits. Clusters of hits concentrated on one chromosome, or widths dominated by single-base touches, usually indicate a naming or build problem rather than biology. The overlap machinery itself guarantees that reported pairs share a chromosome and compatible strand, so direct your skepticism at the inputs, especially genome build and seqnames, where errors produce plausible-looking nonsense.
Common Mistakes and Limitations
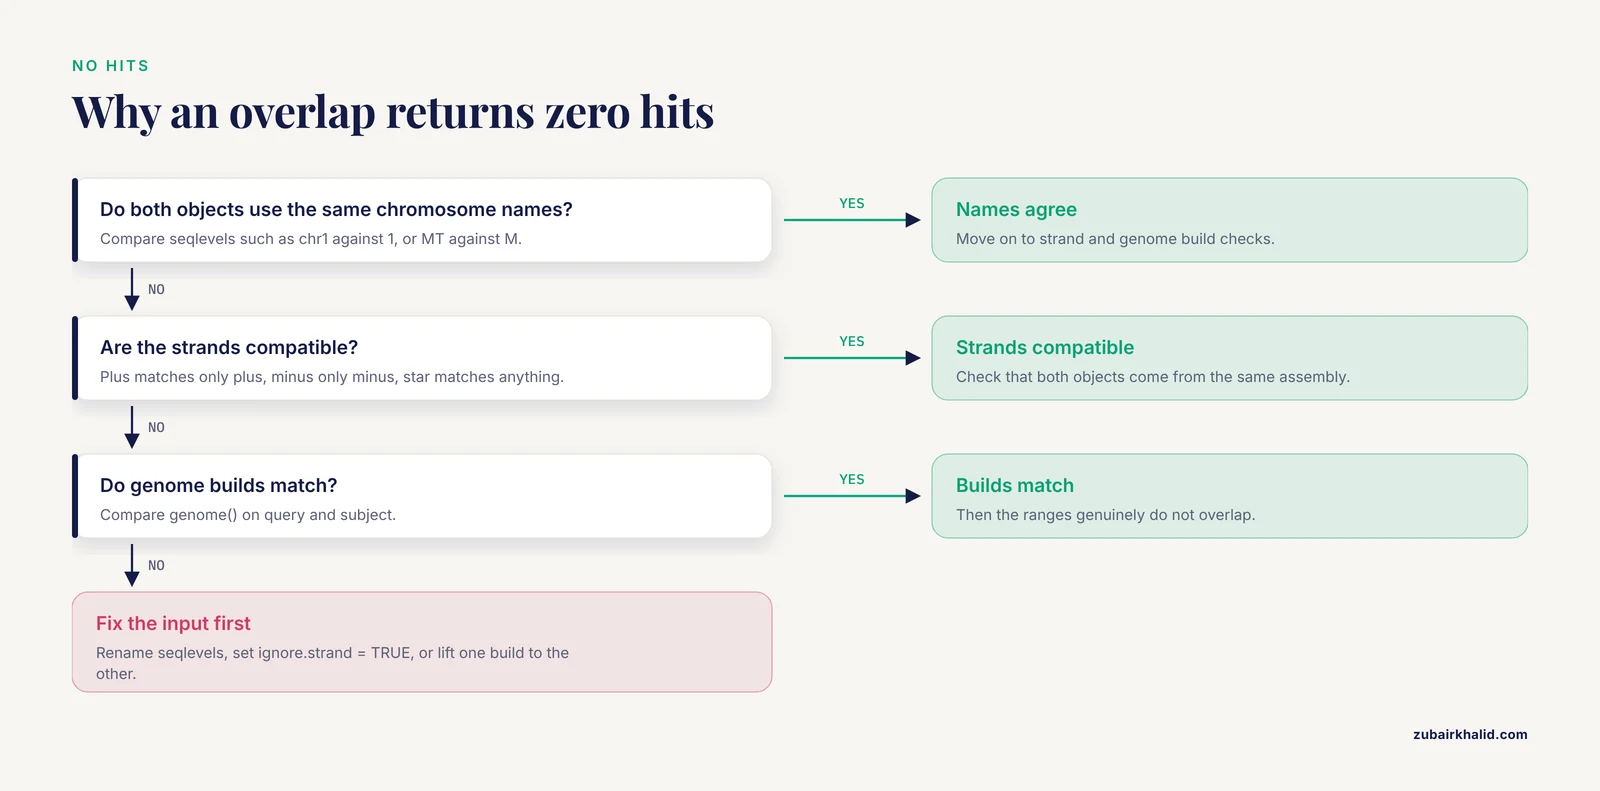
These are the failures that consume the most debugging time in real projects, listed with their fixes.
- Silent zero hits from chromosome naming. One object uses
chr1, the other uses1, or one usesMTwhile the other usesM. Nothing errors, you simply get an empty result. Diagnose withintersect(seqlevels(query), seqlevels(subject)), and if the intersection is empty, rename before overlapping. - Assuming strand is ignored. For GRanges,
ignore.stranddefaults toFALSE. A + query never matches a - subject. Checkunique(strand(query))before concluding that an overlap is absent. - Manual coordinate conversion. BED is 0-based half-open, GRanges is 1-based closed. Adding or subtracting 1 by hand, sometimes twice, shifts every interval. Import with rtracklayer and let the library convert.
- Confusing query and subject direction.
countOverlaps(peaks, genes)andcountOverlaps(genes, peaks)produce different vectors over different lengths. Before any family call, state which set you are summarizing over. - Treating the Hits object like a data frame.
hits$queryHitsfails, because$is not defined for Hits. UsequeryHits(hits),subjectHits(hits), oras.data.frame(hits). - Expecting
intersect()to return pairwise overlaps.intersect(x, y)merges both sets and returns shared genomic space, losing pair identity. Per-pair widths come fromfindOverlapsplus thepmax/pminarithmetic shown earlier. - Redundant subjects inflating results. A gene locus covered by multiple transcript models generates one hit per model, which can triple apparent support. Reduce the subject, or select one model per gene, before counting.
- Mixing genome builds. Coordinates from two assemblies overlap at random. Record
genome()on both objects, and lift one side to the other before any comparison. - Misreading
maxgap. It bridges the gap between interval edges. It is not a center-to-center distance, and it interacts withtypein ways documented on the man page. Test it on two ranges with a known separation before trusting it in production. - Pathological hit counts. One broad query range, such as an entire chromosome band, can hit tens of thousands of subject ranges and blow up memory. Cap with
select, reduce the subject, or work chromosome by chromosome. - Zero-width ranges. Insertion-style features can be represented with zero width, and their overlap behavior has special rules described in the IRanges documentation. Test such data explicitly rather than assuming.
Two limitations frame the whole method. findOverlaps performs interval algebra only: it knows nothing about sequence content, expression, or statistical significance, so enrichment questions need a permutation framework on top of the raw overlaps. And everything lives in memory, which is fine up to tens of millions of ranges but means truly enormous collections need chunking by chromosome or region.
Frequently Asked Questions
What is the difference between findOverlaps and countOverlaps?
findOverlaps returns the identity of every overlapping pair as a Hits object, while countOverlaps returns only the number of subjects that hit each query element. Use the former for joins and the latter for per-range tallies.
Why do I get zero hits when the coordinates clearly overlap?
The usual cause is a mismatch the function cannot bridge: different chromosome naming styles such as chr1 versus 1, incompatible strands, or coordinates from different genome builds. Check seqlevels, strand, and genome on both objects.
How do I get the actual overlapping base pairs?
Subset the query and subject with queryHits and subjectHits, then compute the shared block with pintersect or with the pmax/pmin arithmetic on starts and ends.
How do I ignore strand information?
Pass ignore.strand = TRUE to findOverlaps or to any function in the overlap family. Remember that the default is strand-aware for GRanges.
Does findOverlaps work with GRangesList?
Yes. The returned hit indices refer to elements of the unlisted object, so use togroup() to map unlisted positions back to their original list elements.
How do I keep only one overlap per query range?
Use select = "first", select = "last", or select = "arbitrary", or retrieve all hits and rank them yourself using metadata columns such as score.
Can findOverlaps handle millions of ranges?
Yes, it uses indexed interval search rather than exhaustive pairwise comparison. Stay practical by batching queries into single calls, reducing redundant subjects, and requesting counts instead of pair lists when pair identity is not needed.
How does this compare to bedtools intersect?
Both identify interval overlaps. Keeping the step in R preserves strand rules, metadata columns, and reproducible scripting in one environment, while bedtools operates on files and streams and suits pipeline stages outside R.