How to Find Overlapping Genomic Regions in R: A Bioconductor Approach
By Dr. Zubair Khalid, DVM, MS, PhD ·

By the end of this article you will be able to load two sets of genomic coordinates into R, find every pair of regions that overlaps, count overlaps per region, compute the exact number of shared base pairs and the percent overlap, merge redundant intervals, filter one set by the other, annotate overlaps against gene models, and export the results as a BED file. Everything runs in R using the Bioconductor ecosystem, which is the standard toolkit for this kind of work in r for bioinformatics.
You need R (4.1 or newer is sensible), Bioconductor packages GenomicRanges, IRanges, GenomeInfoDb, and rtracklayer, plus optionally GenomicFeatures with a transcript database for gene annotation. No other software is required. All worked examples below use small synthetic coordinates so you can reproduce every output on your own machine before pointing the same code at your ChIP-seq peaks, GWAS loci, or regions of homozygosity.
Why Interval Overlap Is a Core Task in R for Bioinformatics
Almost every genomic question that involves two sets of coordinates is an interval overlap question in disguise. A few published examples show how central this operation is.
In a study of artificial selection in layer chickens, researchers called over 141,000 regions of homozygosity across 686 hens and then asked which runs of homozygosity, condensed into 23 ROH islands, overlapped regions carrying selection signatures detected by a separate method [1]. That is a findOverlaps call at heart. A study of long G-quadruplex-capable regions in the human genome identified 301 such loci and then asked how many overlapped annotated enhancers, arriving at 217, which then drove the rest of the analysis [2]. Work on HIV-1 integration mapped proviral insertion sites and tested whether they fell inside R-loop enriched intronic regions of active genes, again a direct overlap question [3]. A mouse hypothalamus epigenetics study found that regions of postnatal epigenetic maturation were enriched in genomic intervals associated with human body mass index heritability, which required intersecting mouse-derived regions with human GWAS signal [4].
Overlap logic also appears in genetics beyond annotation. A genome-wide association strategy for substance dependence deliberately searched for chromosomal regions tagged by clusters of nominally significant SNPs appearing in several independent samples, treating overlapping clusters across studies as evidence of replication [5]. A machine learning method for prostate cancer GWAS, DEPTH, ranks groups of markers by considering overlapping groups of contiguous SNPs rather than testing each SNP alone [6]. In a selection-scan comparison in domestic dogs, the overlap between two outlier-detection approaches was itself the result of interest, since only modest overlap was observed between a demography-aware method and an empirical outlier approach [7]. In Mycobacterium tuberculosis, whole-genome sequencing revealed multiple independent large-scale duplications that overlapped the same genomic region, which is how the authors established that the duplication event was not lineage specific [8].
The common thread is that a region list from method A and a region list from method B must be reconciled at the coordinate level. Bioconductor's GenomicRanges package is the standard, vectorized, memory-efficient way to do that reconciliation in R.
How Bioconductor Represents Genomic Intervals
Two classes carry almost all the weight. IRanges stores an interval as an integer start and width on a number line, with no chromosome and no strand. GRanges wraps IRanges and adds three things: seqnames (the chromosome), strand (+, -, or *), and optional metadata columns such as a peak name, a p value, or a gene ID. GRanges objects also carry a seqinfo slot that can hold chromosome lengths and a genome build label, and you will want that later.
A genomic region 1,000 to 1,499 on chr1 is therefore IRanges(start = 1000, width = 500) inside a GRanges entry with seqnames = "chr1". Width is always stored, and end is computed as start plus width minus 1, so end 1499 equals start 1000 plus width 500 minus 1. Keep that identity in mind, because it is the source of the single most common off-by-one error in this workflow, covered later.
Step-by-Step: Find Overlapping Genomic Regions in R
Step 1. Install the Bioconductor packages
install.packages("BiocManager")
BiocManager::install(c(
  "GenomicRanges",
  "IRanges",
  "GenomeInfoDb",
  "rtracklayer",
  "GenomicFeatures",
  "TxDb.Hsapiens.UCSC.hg38.knownGene"
))
Then load what you need for the walkthrough.
library(GenomicRanges)
library(GenomeInfoDb)
library(rtracklayer)
Step 2. Build or import your two sets of regions
For a reproducible example, create a query set of four peaks and a subject set of three genes.
peaks <- GRanges(
  seqnames = c("chr1", "chr1", "chr2", "chr2"),
  ranges   = IRanges(start = c(1000, 1300, 5000, 9000),
                     width = c( 500,  400,  300,  200)),
  strand   = "*",
  name     = paste0("peak", 1:4)
)

genes <- GRanges(
  seqnames = c("chr1", "chr1", "chr2"),
  ranges   = IRanges(start = c(1200, 6000, 8800),
                     width = c(2000, 1000,  700)),
  strand   = c("+", "-", "+"),
  gene_id  = c("GENE1", "GENE2", "GENE3")
)
For real data, read a BED file with rtracklayer, which converts BED coordinates to GRanges coordinates for you.
peaks <- import.bed("peaks.bed")A GTF or GFF gene annotation imports the same way and can be filtered to gene rows.
gtf <- import("genes.gtf", format = "gtf")
genes <- gtf[gtf$type == "gene"]
Step 3. Inspect and validate the objects
Print both objects and check the range of coordinates against what you expect from the source file.
peaks
genes
seqlevels(peaks)
seqlevels(genes)
Expected output for peaks looks like this.
GRanges object with 4 ranges and 1 metadata column:
    seqnames    ranges strand |      name
       <Rle> <IRanges>  <Rle> | <character>
  [9]     chr1   1000-1499      * |       peak1
  [10]     chr1   1300-1699      * |       peak2
  [5]     chr2   5000-5299      * |       peak3
  [1]     chr2   9000-9199      * |       peak4
  -------
  seqinfo: 2 sequences from an unspecified genome, no seqlengths
If your peaks show coordinates in the millions on a chromosome where you expected thousands, you probably read a different genome build or the wrong column. Catch that now, not after the overlap.
Step 4. Run findOverlaps
hits <- findOverlaps(peaks, genes)
hits
Expected output.
Hits object with 3 hits and 0 metadata columns:
      queryHits subjectHits
       <integer>   <integer>
  [9]         1           1
  [10]         2           1
  [5]         4           3
  -------
  queryLength: 4 / subjectLength: 3
The query is the first argument and the subject is the second. Each row of the Hits object is one overlapping pair, given as row indices into the query and subject objects. Here peak1 and peak2 both hit GENE1, peak3 hits nothing, and peak4 hits GENE3. Convert to a plain data frame at any time with as.data.frame(hits).
Step 5. Pull out paired ranges and compute overlap widths
The Hits object gives you index pairs. Use them to subset both objects in parallel and intersect each pair element-wise with pintersect.
q_hits <- peaks[queryHits(hits)]
s_hits <- genes[subjectHits(hits)]
ov <- pintersect(q_hits, s_hits)

result <- data.frame(
  peak       = peaks$name[queryHits(hits)],
  gene       = genes$gene_id[subjectHits(hits)],
  overlap_bp = width(ov),
  peak_bp    = width(q_hits)
)
result$percent_of_peak <- round(100 * result$overlap_bp / result$peak_bp, 1)
result
Expected output.
   peak  gene overlap_bp peak_bp percent_of_peak
1 peak1 GENE1        300     500            60.0
2 peak2 GENE1        400     400           100.0
3 peak4 GENE3        200     200           100.0
peak1 spans 1000 to 1499, GENE1 starts at 1200, so the shared stretch is 1200 to 1499, which is 300 base pairs out of a 500 base pair peak, or 60 percent.
Step 6. Count overlaps per region
When you only need a per-region tally, countOverlaps is faster and simpler than managing Hits indices.
countOverlaps(peaks, genes)Expected output.
[9] 1 1 0 1The output is a vector parallel to peaks, so you can attach it as a metadata column and filter directly.
peaks$n_genes <- countOverlaps(peaks, genes)
peaks[peaks$n_genes > 0]
Step 7. Filter one set by the other with subsetByOverlaps
To keep only the peaks that touch at least one gene, use subsetByOverlaps or its operator form.
peaks_with_genes <- subsetByOverlaps(peaks, genes)
identical(peaks_with_genes, peaks %over% genes)
Expected output.
[9] TRUEBoth return peak1, peak2, and peak4, dropping peak3. The operator form is convenient inside pipes, while the function form accepts the same type, minoverlap, and ignore.strand arguments as findOverlaps.
Step 8. Merge and partition regions with reduce and disjoin
reduce merges ranges that overlap or touch into maximal non-overlapping blocks. peaks 1 and 2 share positions 1300 to 1499, so they collapse into one interval.
reduce(peaks)Expected output.
GRanges object with 3 ranges and 0 metadata columns:
    seqnames    ranges strand
       <Rle> <IRanges>  <Rle>
  [9]     chr1   1000-1699      *
  [10]     chr2   5000-5299      *
  [5]     chr2   9000-9199      *
disjoin instead cuts every range at every boundary in the set, producing a base-pair level partition.
disjoin(peaks)Expected output has four pieces on chr1, since 1000-1699 minus the 1300-1499 boundary structure splits into 1000-1299, 1300-1499, and 1500-1699, plus the two chr2 pieces unchanged. Pass with.revmap = TRUE to either function to receive a metadata column that tells you which original ranges contributed to each output range, which is how you trace a merged block back to its sources.
Step 9. Compute percent overlap with the denominator you actually mean
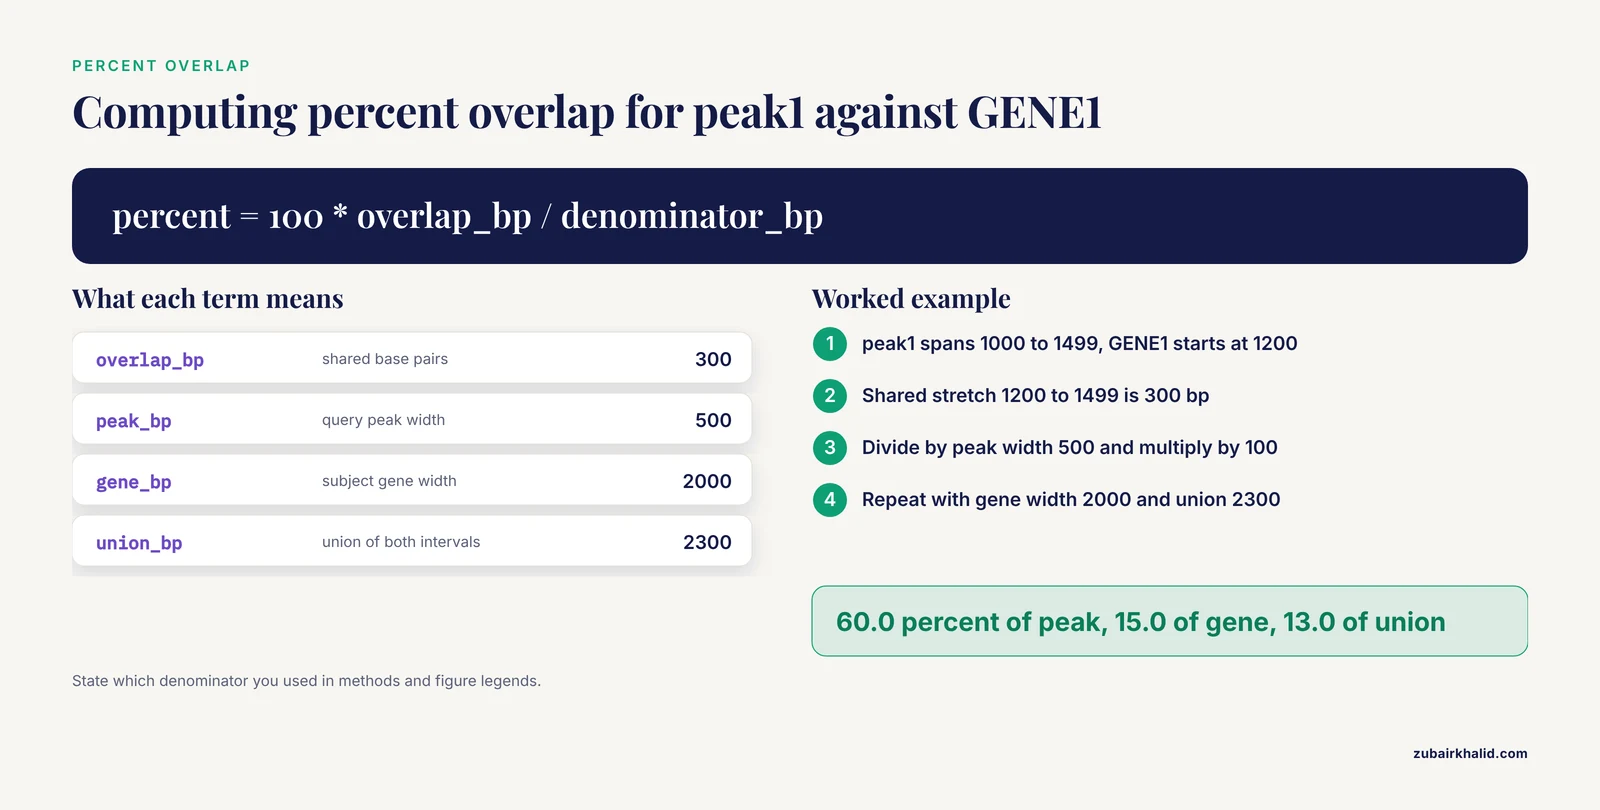
Percent overlap is ambiguous until you choose a denominator. Three defensible choices exist.
union_bp <- width(punion(q_hits, s_hits, fill.gap = TRUE))

result$pct_of_subject <- round(100 * result$overlap_bp / width(s_hits), 1)
result$pct_of_union   <- round(100 * result$overlap_bp / union_bp, 1)
result
Expected output adds two columns. For peak1 against GENE1, the overlap is 300 bp, the gene is 2,000 bp, and the union of the two intervals is 2,300 bp, giving 15.0 percent of the gene and 13.0 percent of the union. Most papers reporting "the fraction of the peak covered by the annotation" use percent of query, the 60.0 percent figure from Step 5. State your denominator in methods and figure legends, because reviewers ask.
Step 10. Use set operations when you need presence or absence, not pairing
intersect, union, and setdiff treat the two objects as sets of base pairs.
reduce(peaks)                  # merged query blocks
intersect(peaks, genes)        # base pairs present in both
union(peaks, genes)            # base pairs present in either
setdiff(peaks, genes)          # base pairs in peaks but not in genes
setdiff(peaks, genes) returns chr1 1000 to 1199, the part of peak1 outside GENE1, and chr2 5000 to 5299, because peak2 and peak4 fall entirely inside their genes and vanish. This is exactly the logic behind tools built for finding regions present in targets and absent from neighbors, such as the fur program for diagnostic marker design, which returns regions found in all target genomes and none of the close relatives [10]. When your question is "which parts of my regions are NOT annotated," setdiff is the tool.
Step 11. Annotate overlaps against gene models
For human work, a TxDb gives you gene bodies and exons without downloading files manually.
library(GenomicFeatures)
txdb <- TxDb.Hsapiens.UCSC.hg38.knownGene
gene_gr <- genes(txdb)

peaks$gene_id <- NA
hits <- findOverlaps(peaks, gene_gr)
peaks$gene_id[queryHits(hits)] <- gene_gr$gene_id[subjectHits(hits)]
If a peak hits multiple genes, this loop-style assignment keeps the last hit. For one clean row per peak-gene pair, keep the data frame from Step 5 instead. For chromatin interaction data such as Hi-C or ChIA-PET, where each record is a pair of anchors rather than a single interval, the GenomicInteractions package extends this annotation and summarization machinery to two-sided genomic features [9].
Step 12. Export results
hits_df <- as.data.frame(hits)
write.csv(result, "peak_gene_overlaps.csv", row.names = FALSE)

export.bed(reduce(peaks), "peaks_merged.bed")
The CSV is for collaborators and notebooks. The merged BED is what you will load into a genome browser or hand to downstream tools.
Overlap Parameters That Change Your Answer
Four arguments to findOverlaps control what "overlap" means. Getting them wrong does not produce an error, it produces the wrong answer.
| Function | What it does | Key parameters |
|---|---|---|
| findOverlaps | Returns all query-subject hit pairs | type, minoverlap, maxgap, ignore.strand, select |
| countOverlaps | Number of subject hits per query | same as findOverlaps |
| subsetByOverlaps | Keeps query ranges with at least one hit | type, minoverlap, ignore.strand |
| reduce | Merges overlapping and touching ranges | min.gapwidth, with.revmap |
| disjoin | Splits all ranges into disjoint pieces | with.revmap |
| intersect, union, setdiff | Base-pair set algebra | ignore.strand |
| pintersect | Element-wise intersection of parallel objects | drop.nohit.ranges |
| nearest, distanceToNearest | Closest neighbor, including non-overlaps | ignore.strand, select |
type selects the relationship. "any" is default and means any shared base pair. "start" requires identical starts, "end" identical ends, "within" requires the query to sit entirely inside the subject, and "equal" requires identical bounds. For peaks inside genes, use type = "within".
findOverlaps(peaks, genes, type = "within")Expected output shows only query 2 hitting subject 1 and query 4 hitting subject 3, because peak1 sticks out of GENE1 on the left.
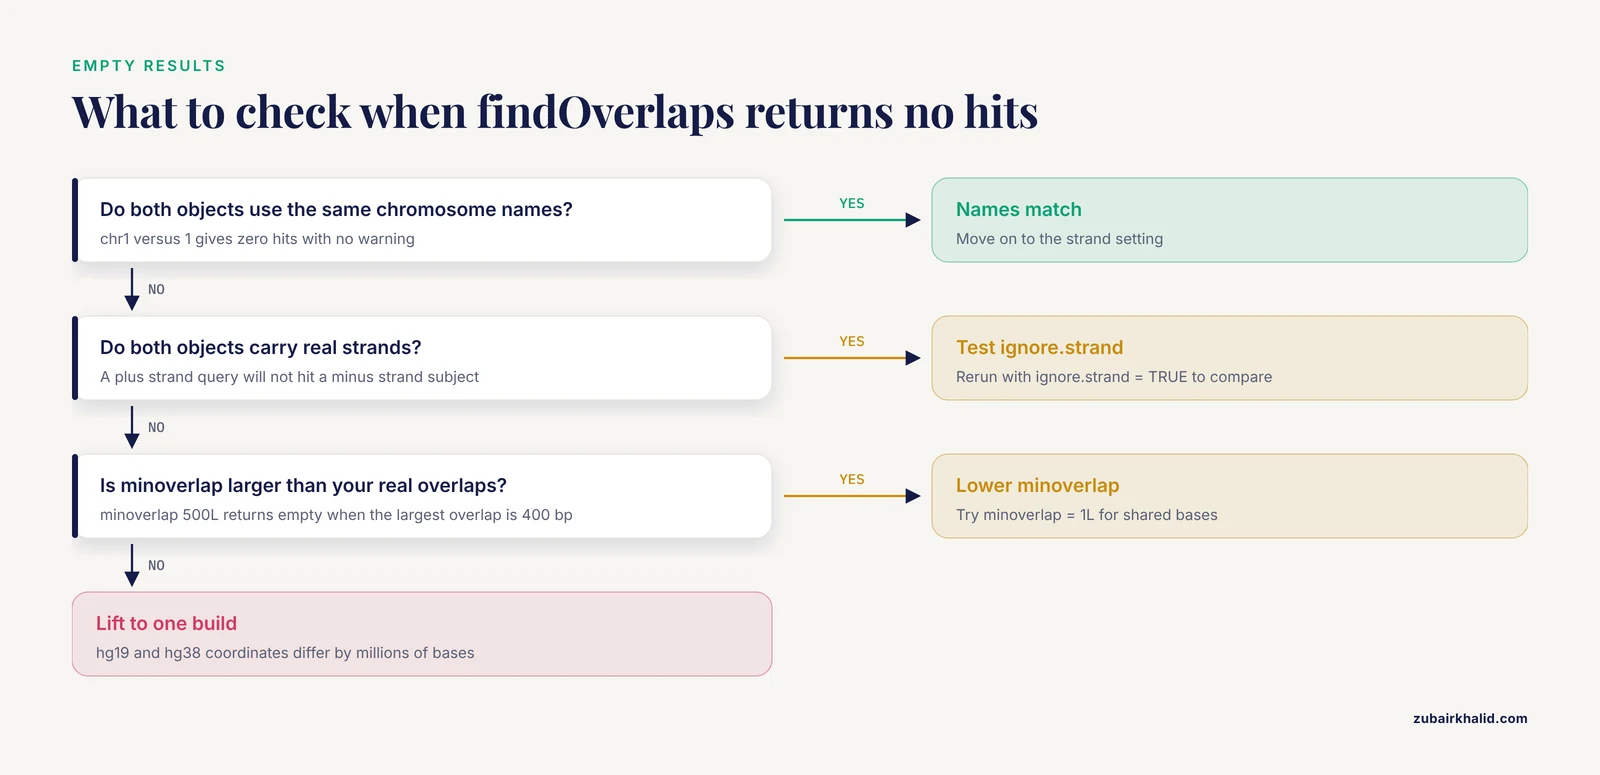
minoverlap sets the minimum number of shared base pairs. The important subtlety is that the default behavior treats merely adjacent ranges as overlapping. peak1 ends at 1499 and an annotation starting at 1500 would count as a hit under the defaults. To require genuine shared nucleotides, pass minoverlap = 1L, and to demand a substantial shared stretch, pass the threshold in bases.
findOverlaps(peaks, genes, minoverlap = 1L)    # at least 1 shared base
findOverlaps(peaks, genes, minoverlap = 500L)  # at least 500 shared bases
Expected output for minoverlap = 500L is an empty Hits object, because the largest overlap in the example is 400 bp. A zero-length result where you expected hits is often just an over-aggressive minoverlap.
maxgap allows nearby ranges with a small gap between them to count as overlapping. The default value of -1 means no extra gap is tolerated beyond the adjacency behavior described above. Positive values let a peak 50 bp away from a gene count as a hit, which is sometimes exactly what you want for sparse annotations and sometimes quiet false positives.
ignore.strand defaults to FALSE in GenomicRanges findOverlaps. With strand-aware matching, a + strand query will not hit a - strand subject, while any range with strand matches everything. ChIP-seq peaks are commonly stored with , so this rarely bites, but stranded RNA-seq features or ATAC cut sites will. If you see fewer hits than expected and both objects carry real strands, test with ignore.strand = TRUE to see whether strand is the explanation.
How to Check Your Result Is Right
Verify with an independent calculation before trusting the output.
First, spot-check one hit by hand. Take the first row of the result data frame, print both intervals, and confirm the overlap arithmetic on paper.
q_hits[9]
s_hits[9]
Expected output confirms peak1 at chr1:1000-1499 and GENE1 at chr1:1200-3199, so 300 shared positions.
Second, cross-check totals two ways. The number of rows in the Hits object should equal sum(countOverlaps(peaks, genes)).
length(hits) == sum(countOverlaps(peaks, genes))Expected output is TRUE.
Third, test a synthetic case with a known answer. Add an interval you constructed deliberately to overlap or not overlap, run the pipeline, and confirm the label.
test_peak <- GRanges("chr1", IRanges(1200, 1299), strand = "*")
countOverlaps(test_peak, genes)
Expected output is 1, since 1200 to 1299 sits inside GENE1.
Fourth, check the genome bookkeeping. If you set seqlengths on one object and not the other, or different seqlengths on each, combining them produces warnings about incompatible sequence information. Warnings about out-of-bound ranges mean some coordinates exceed the chromosome length you declared, which almost always points to a genome-build mismatch.
Common Mistakes and Limitations
BED coordinate arithmetic. BED files are zero-based half-open, meaning the line chr1 999 1499 describes positions 1000 through 1499 in one-based inclusive notation. rtracklayer's import.bed handles this correctly. The error appears when people parse BED with read.delim and build a GRanges manually. Correct manual conversion is IRanges(start = bed_start + 1, width = bed_end - bed_start). Adding 1 to the end column instead of the start column shifts every region by one base and silently corrupts fine-grained overlap counts.
Chromosome naming mismatches fail silently. One object with "chr1" and another with "1" produces zero hits from findOverlaps with no error and no warning. Standardize before overlapping.
seqlevels(peaks) <- sub("^chr", "", seqlevels(peaks))The GenomeInfoDb package offers seqlevelsStyle() to detect naming convention and keepSeqlevels() with a pruning.mode argument to restrict both objects to their shared chromosomes.
shared <- intersect(seqlevels(peaks), seqlevels(genes))
peaks <- keepSeqlevels(peaks, shared, pruning.mode = "coarse")
genes <- keepSeqlevels(genes, shared, pruning.mode = "coarse")
Strand and minoverlap defaults. Both are covered in the parameter section and both belong here because they fail silently. The practical tips for finding overlapping genomic regions in R are to write the arguments explicitly even when they match the defaults, so the intent is visible in your script and in your methods section.
Double-counting with overlapping query ranges. If your query contains overlapping intervals, as raw peak callers sometimes emit, a subject region can match the same query content multiple times through different query rows. Run reduce() on the query first if each base pair should count once, and keep the revmap column to preserve provenance.
Genome build mixing. hg19 and hg38 coordinates differ by millions of bases on many chromosomes. Two region sets from different builds will still produce overlaps where coordinates happen to coincide, which makes the result plausible and wrong. Lift one set to the other with a dedicated crossmap tool before overlapping, and record the build in the seqinfo genome slot.
Region-level overlap is not variant-level identity. When GWAS studies report overlapping regions, the overlap can reflect broad linkage disequilibrium blocks rather than the same causal variant. The wheat root lesion nematode GWAS, for example, found significant SNPs falling inside large LD blocks with the corresponding haplotypes [11], so the unit of overlap there is a haplotype block, not a single allele. The substance dependence replication study reached a similar conclusion explicitly, expressing high confidence in overlapping clusters of regions but more modest confidence in the identification of individual regions and genes within them [5]. Interpret a base-pair overlap as evidence that two analyses point at the same neighborhood, not that they found the same mechanism.
Method agreement is not automatic. The dog selection-scan comparison found that a majority of empirical outlier regions showed no overlap with a demography-aware analysis of the same genomes [7]. When two of your own region lists overlap poorly, the overlap code is usually fine and the region definitions are the variable worth examining.
Scale is rarely the problem. findOverlaps builds an index over the subject, so queries against millions of subject ranges are routine. Sort both objects with sort() first for predictable performance, use select = "first" when you only need one hit per query, and resist writing for-loops over individual ranges, which is the usual cause of overnight runtimes. The plyranges package offers dplyr-style verbs over GRanges if you prefer that syntax, built on the same underlying machinery.
Overlap does not imply function. A peak overlapping an enhancer annotation supports, but does not prove, a regulatory relationship. The G-quadruplex study treated enhancer overlap as one line of evidence and then tested promoter-enhancer relationships further rather than stopping at the intersect [2]. Plan at least one downstream measurement, such as expression or perturbation data, after the coordinate reconciliation.
Frequently Asked Questions
What does findOverlaps return exactly?
It returns a Hits object, one row per overlapping query-subject pair, with two integer columns giving row indices into the query and the subject. Convert it with as.data.frame(hits) to join metadata from both sides.
How do I count how many annotations hit each of my regions?
Call countOverlaps(query, subject), which returns an integer vector parallel to the query. Assign it to a metadata column with query$n_hits <- countOverlaps(query, subject) and filter or summarize from there.
Why did my overlap results change when strand was involved?
GenomicRanges treats strand as part of the match by default, so a + strand range will not hit a - strand range, while * matches anything. Either pass ignore.strand = TRUE or confirm both objects carry the strand convention you intend.
How do I calculate the percent of my peak that overlaps an annotation?
Extract the hit pairs with queryHits and subjectHits, run pintersect on the paired ranges, then divide width(pintersect output) by width(query subset) and multiply by 100. Choose the query, the subject, or the union as the denominator and state which one you used.
Do I need rtracklayer to read BED files into GenomicRanges?
You do not strictly need it, but you should use it, because import.bed converts BED's zero-based half-open coordinates to GRanges one-based inclusive coordinates correctly. Manual parsing is the leading source of one-base offsets in overlap analyses.
What is the difference between reduce and disjoin?
reduce merges overlapping and adjacent ranges into the minimal set of maximal blocks, while disjoin splits all ranges at every boundary into disjoint pieces. Use reduce for deduplication and merging, and disjoin when you need a base-pair level partition of the space.
How do I deal with chr1 versus 1 chromosome names?
Standardize one object to match the other before overlapping, for example with seqlevels(x) <- sub("^chr", "", seqlevels(x)), or use the seqlevelsStyle and keepSeqlevels functions from GenomeInfoDb. Mismatches return zero hits silently, so check seqlevels on both objects whenever a result comes back empty.
Can these functions handle millions of ranges?
Yes. GenomicRanges operations are vectorized and indexed over the subject, so overlap searches over millions of intervals are routine in R for bioinformatics. Sort both objects, restrict to shared chromosomes, and use countOverlaps or select = "first" when the full pair list is unnecessary.
Sources
- Runs of homozygosity and selection signature analyses reveal putative genomic regions for artificial selection in layer breeding
- Characterization of long G4-rich enhancer-associated genomic regions engaging in a novel loop:loop ‘G4 Kissing’ interaction
- Aquarius helicase facilitates HIV-1 integration into R-loop enriched genomic regions
- Sex-specific epigenetic development in the mouse hypothalamic arcuate nucleus pinpoints human genomic regions associated with body mass index
- “Replicated” genome wide association for dependence on illegal substances: genomic regions identified by overlapping clusters of nominally positive SNPs
- Use of a novel non-parametric version of DEPTH to identify genomic regions associated with prostate cancer risk
- Demographically-Based Evaluation of Genomic Regions under Selection in Domestic Dogs
- Independent Large Scale Duplications in Multiple M. tuberculosis Lineages Overlapping the Same Genomic Region
- GenomicInteractions: An R/Bioconductor package for manipulating and investigating chromatin interaction data.
- Fur: Find unique genomic regions for diagnostic PCR
- Genome-wide association study in hexaploid wheat identifies novel genomic regions associated with resistance to root lesion nematode (Pratylenchus thornei)