How to Find Population Frequencies for a Variant in Ensembl
By Dr. Zubair Khalid, DVM, MS, PhD ·

By the end of this guide you will be able to take any human variant, whether you know it as an rsID, an HGVS string, or a chromosomal coordinate, and pull its allele frequencies across the major reference populations hosted in Ensembl. You will do this three ways: interactively in the Ensembl genome browser, programmatically through the Ensembl REST API, and at scale with the Ensembl Variant Effect Predictor (VEP). You will also learn how to judge whether a frequency actually applies to the population you care about, which is where most lookups go wrong.
What you need on hand is simple. For the browser route, a web browser and an identifier for your variant. For the API route, a terminal with curl, or Python 3 with the requests library installed. For the VEP route, either the public VEP web form or a machine where the command-line VEP tool is installed. No local databases are required for any of the three routes.
Why Population Frequency Matters in Variant Interpretation
Population frequency is the proportion of chromosomes in a reference population that carry a given allele. A variant that appears in five percent of healthy people is a poor candidate for causing a rare Mendelian disease, while a variant completely absent from tens of thousands of control genomes gains weight as a candidate. Variant interpretation guidelines used across clinical genetics treat population rarity as one of the strongest pieces of benign and pathogenic evidence, so the lookup is not optional housekeeping. It is part of the argument.
The practical stakes show up constantly in published work. A study of the c.788C>T variant in TGFB1 in South Indian otosclerosis cases compared its own genotyping against Ensembl 1000 Genomes and Ensembl NHLBI Exome data alongside gnomAD and Genome Asia 100K, and found the variant ranged from zero to 11.21 percent across those databases, with homozygote frequencies between zero and 1.25 percent [1]. The spread of those numbers is the lesson. Different databases sample different people, and a single-source frequency lookup would have told a very different story depending on which database the author opened first.
Frequency mismatch is also a classic red flag for an ancestry gap. In a Pakistani whole-exome study of COVID-19 severity, the recurrent missense variant rs199726033 in SVIL had a cohort minor allele frequency of 29.2 percent, far above the 1.051 percent reported for South Asians in the gnomAD v4 database [2]. Both numbers can be true. The cohort was recruited for severe disease and was small, while gnomAD samples the broad population. Reading those two numbers side by side, rather than one in isolation, is the habit this guide builds.
Three Routes at a Glance
| Route | Input you supply | What you get back | Best for |
|---|---|---|---|
| , - | , - | , - | , - |
| Genome browser | rsID, gene name, or coordinate | Allele counts and frequencies per population, visualized | One or a few variants, checking context |
| REST API | rsID or HGVS, one call per ID or batched | Structured JSON with counts and frequencies per population | Scripts, small-to-medium batches, pipelines |
| VEP (web or command line) | Variant list in VCF, default, or other format | Annotated output with consequences plus frequency fields | Many variants, prioritization workflows |
Pick the browser for a single variant you want to understand, the API when you want the numbers in code, and VEP when frequency is one of twenty fields you need for a hundred variants. The three routes draw on the same underlying Ensembl Variation databases, so a disagreement between routes usually means a formatting mistake rather than a data conflict.
What You Need Before You Start
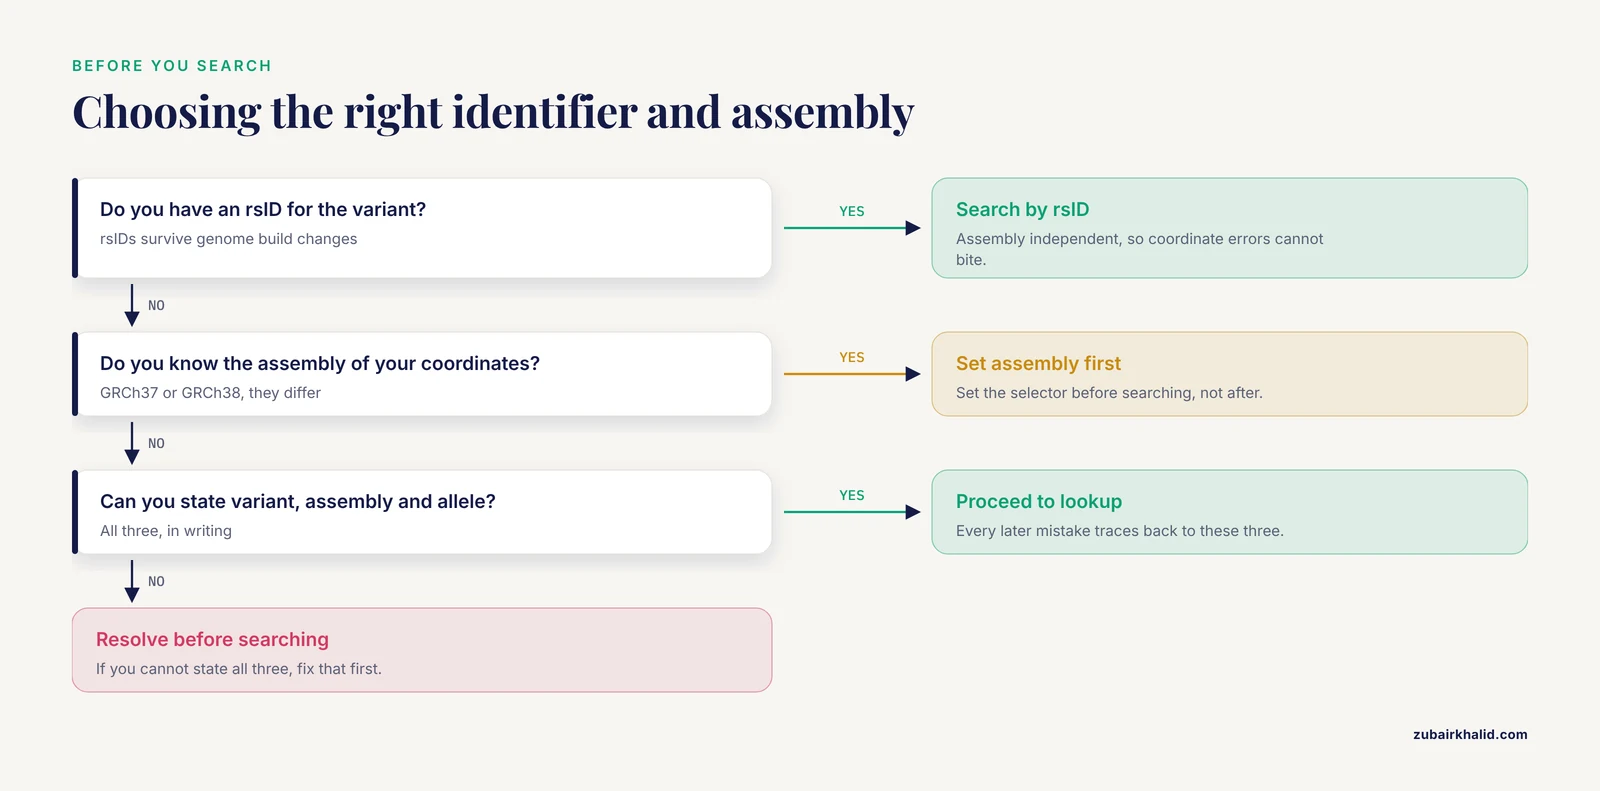
Gather as many of the following as you have. The more identifier forms you hold, the fewer dead ends you hit.
- rsID. The dbSNP reference number, such as rs334. This is the most robust identifier because it survives genome build changes.
- HGVS notation. A description such as
c.20A>Tfor a coding change, ideally with a transcript number, org.notation with a chromosome. HGVS (Human Genome Variation Society) notation describes a variant relative to a reference sequence. - Chromosomal coordinate. A position such as a chromosome, start, end, and the reference and alternate alleles. Coordinates are assembly specific.
- Assembly. GRCh37 or GRCh38. Ensembl serves both. GRCh38 is the current assembly and the default on the main site. GRCh37 remains available for legacy data, and the same physical base sits at a different coordinate in each.
- Reference and alternate alleles. Knowing which allele you care about matters, because Ensembl reports the frequency of each allele separately, and "minor allele frequency" refers to whichever allele is less common in that population, which is not always your allele of interest.
A quick self-check before any lookup: write down the variant, the assembly, and the exact allele whose frequency you want. If you cannot state all three, resolve that first, because every mistake cataloged later in this article traces back to one of them.
Finding an Ensembl Variant Population Frequency Step by Step in the Genome Browser
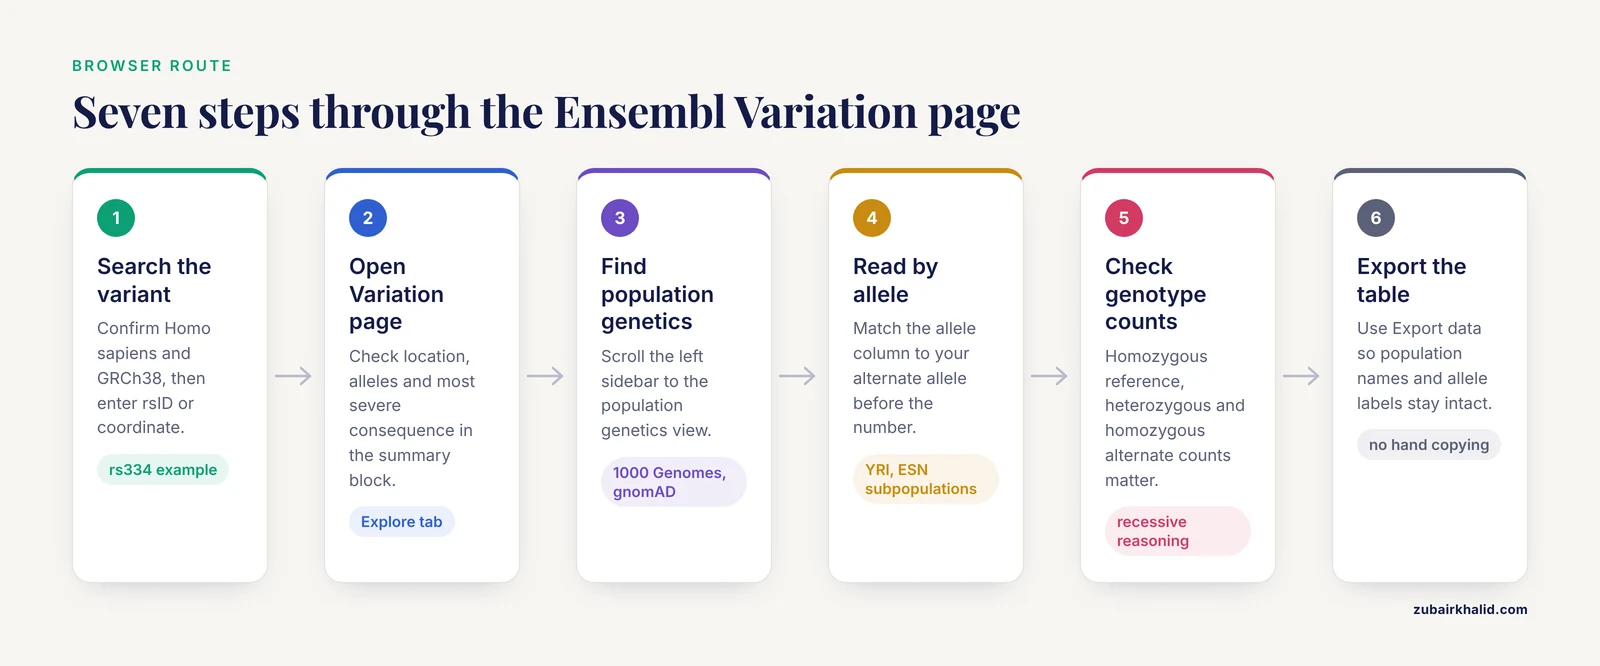
This is the fastest route and the best starting point for learning how to use Ensembl. The steps below form the core of any ensembl genome browser tutorial on variation data.
Step 1. Open the Ensembl site and search for your variant
Go to ensembl.org, confirm the species is Homo sapiens, and confirm the assembly shown near the search box is GRCh38 unless you deliberately want GRCh37. Type your identifier into the search box. For rs334, the direct page lives at a predictable address:
https://www.ensembl.org/Homo_sapiens/Variation/Explore?v=rs334If you search by coordinate instead, use the format chromosome:start-end, for example 11:5227002-5227002 for a single base. If the search returns nothing, the first thing to check is the assembly selector, because a GRCh37 coordinate searched against GRCh38 lands on the wrong base or no base at all.
Step 2. Open the Variation page
The search results show the variant under the "Variant" category. Clicking it opens the Variation page, which opens on the "Explore" tab by default. Scan the summary block first. Confirm the location, the alleles, and the most severe consequence. If the page shows a different gene or a different allele string than you expected, stop and reconcile before trusting any numbers on the page.
Step 3. Find the population genetics section
Scroll the tabbed left sidebar to "Population genetics". This view draws allele counts and frequencies from the population-scale sequencing projects loaded into Ensembl Variation. For human data you will typically see entries from 1000 Genomes and gnomAD, and older datasets such as the NHLBI Exome Sequencing Project remain available for variants that studies queried historically, which is exactly how the TGFB1 otosclerosis study pulled its Ensembl frequency comparisons [1]. Each project appears as a track or an expandable block, often grouped by super-population.
Step 4. Read the frequency table correctly
The 1000 Genomes data in Ensembl is organized by the project's own structure, five super-populations covering African, American, East Asian, European, and South Asian ancestry groups, each containing named subpopulations. Yoruba samples appear as YRI and Esan samples as ESN, the two Nigerian groups that a pharmacogenomic study of CYP2D6, CYP3A5, DPYD, and TPMT variants retrieved directly from the Phase 3 1000 Genomes data through Ensembl [3]. For each population the table gives the allele, the frequency as a fraction of chromosomes, and often the count of chromosomes carrying that allele. Read the allele column before the number column. The frequency of your alternate allele is the row whose allele matches your alternate, not the row with the smaller number.
Step 5. Check genotype counts, not just allele frequencies
Many views also show genotype counts, meaning how many individuals were homozygous reference, heterozygous, and homozygous alternate. These matter for recessive reasoning. The TGFB1 study cited above tracked homozygote frequencies of zero to 1.25 percent across databases precisely because a single carrier tells a different story than a homozygote [1]. A variant with a low allele frequency but recurrent homozygotes in one population is behaving differently from one seen only in single heterozygotes.
Step 6. Look at the genomic context while you are there
The Variation page links to the Region in Detail view, where the variant sits among genes, regulatory marks, and other variants. Two studies in the cited literature took exactly this combined approach, using Ensembl alongside resources such as VarSome, dbSNP, ClinVar, and the GWAS Catalog to connect candidate variants to disease biology [4], and pulling variant lists from Ensembl before running pathogenicity predictions on them [5]. The frequency number is one fact. Context determines what it means.
Step 7. Export what you found
Use the "Export data" controls on the page to save the table rather than transcribing it by hand. Exports preserve population names and allele labels, which are the two fields people mistype when copying from a screen.
Using the Ensembl REST API for Frequencies
The REST API returns the same data as the browser in structured JSON, which is what you want for reproducibility. The Nigerian pharmacogenomics study cited above used exactly this combination of the Ensembl REST API and genome browser to pull Phase 3 1000 Genomes allele counts and frequencies for its variants of interest [3], so this route is established practice in the literature, not just a convenience.
Step 1. Query a single variant
The variation endpoint returns full record including population data when you pass the pops parameter:
curl 'https://rest.ensembl.org/variation/human/rs334?content-type=application/json&pops=1'A truncated, illustrative slice of the response looks like this:
{
  "id": "rs334",
  "allele_string": "A/T",
  "most_severe_consequence": "missense_variant",
  "populations": {
    "1000GENOMES:phase_3:AFR": [
      {"allele": "A", "frequency": 0.861, "count": 829, "population": "1000GENOMES:phase_3:AFR"},
      {"allele": "T", "frequency": 0.139, "count": 133, "population": "1000GENOMES:phase_3:AFR"}
    ],
    "1000GENOMES:phase_3:ALL": [
      {"allele": "A", "frequency": 0.993, "count": 4974, "population": "1000GENOMES:phase_3:ALL"}
    ]
  }
}
Treat the exact numbers here as placeholders. What matters is the structure. The populations object maps each population key, such as 1000GENOMES:phase_3:AFR, to a list with one entry per allele, and each entry carries the allele, its frequency, and its count. Filter on the allele field in your code. Do not assume the second entry is your allele.
Step 2. Batch several variants in one call
For more than a handful of rsIDs, use the POST form of the same endpoint:
curl -H 'Content-Type: application/json' -H 'Accept: application/json' \
  https://rest.ensembl.org/variation/human \
  -d '{"ids": ["rs334", "rs699", "rs2229993"]}'
The response is a JSON object keyed by each input ID. This is far gentler on the service than looping single requests and keeps your rate under the limits documented on the Ensembl REST site. Keep your request rate modest in general. The service is shared infrastructure for the whole field.
Step 3. Do the same thing in Python
import requests
import time

rsids = ["rs334", "rs699", "rs2229993"]
allele_of_interest = "T"

for rsid in rsids:
    url = "https://rest.ensembl.org/variation/human/" + rsid
    response = requests.get(
        url,
        headers={"Content-Type": "application/json"},
        params={"pops": 1},
    )
    response.raise_for_status()
    data = response.json()
    for population, entries in data.get("populations", {}).items():
        for entry in entries:
            if entry["allele"] == allele_of_interest:
                print(rsid, population, entry["frequency"], entry["count"])
    time.sleep(0.2)
The time.sleep(0.2) line holds the script to about five requests per second, a comfortable pace for the public service. When the key you want is missing, the code prints nothing rather than crashing, because data.get("populations", {}) returns an empty dictionary. Silent no-data is itself a signal. If a variant you expected to be well characterized prints nothing, check the identifier and the assembly before concluding the variant is rare.
Step 4. Get frequencies with consequences in one call
If you want the frequency alongside predicted consequence in a single request, the VEP endpoint accepts an rsID directly:
curl 'https://rest.ensembl.org/vep/human/id/rs334?content-type=application/json'The response is a JSON array with one element per variant, and the colocated_variants field carries known variant records including frequency objects where data exists. A heavily truncated response sketch:
[
  {
    "id": "rs334",
    "most_severe_consequence": "missense_variant",
    "colocated_variants": [
      {
        "id": "rs334",
        "frequencies": {
          "T": {
            "gnomadg:afr": {"af": 0.14, "ac": 419, "an": 3146}
          }
        }
      }
    ]
  }
]
Again, the values are illustrative. The field names follow the pattern of an allele key at the top level, then per-population objects holding an allele frequency af, an allele count ac, and a total allele number an. Building frequency fields by hand from ac divided by an is a useful sanity check on any table you are reading.
Annotating Variants with VEP to Get Frequencies at Scale
VEP is the open-source annotation tool built by the Ensembl team. It predicts variant consequences against the Ensembl or RefSeq gene sets and reports phenotype associations and allele frequencies from studies including gnomAD, and it is updated roughly every quarter to keep gene, variant, and phenotype information current [6]. It runs three ways, as a command-line tool, through the REST API, and through a web form, and the web form was written up as a full tutorial precisely because it gives sophisticated analysis through a simple interface [6].
Using the VEP web interface
The web route is the right choice when you have dozens to a few thousand variants and no need to automate.
- Open the VEP page linked from ensembl.org and choose "New job".
- Paste your variants. A VCF chunk, an rsID list, or HGVS strings all work as input.
- Select Homo sapiens and GRCh38, unless your input coordinates are GRCh37, in which case select GRCh37 explicitly. This single dropdown prevents the most common broken-output scenario.
- In the options, enable the frequency annotations you want, including the population frequency data Ensembl provides and the gnomAD plugin where available in the plugin list. Because VEP reports allele frequencies from studies including gnomAD as part of its standard annotation set [6], you will see frequency columns or structured frequency blocks in the output without extra work.
- Submit the job, wait for the email or on-page completion notice, and download the results as a tab-delimited table for spreadsheets or JSON for scripts.
Using VEP on the command line
For large files and pipelines, install VEP and use a prebuilt cache. The option names below are given exactly as they appear in the VEP documentation. On the command line each one is passed to the vep program with standard flag syntax, which the documentation page for each option shows.
| Option | What it does |
|---|---|
| , - | , - |
cache | Uses a prebuilt local Ensembl cache instead of live database connections |
assembly | Pins the assembly, GRCh37 or GRCh38 |
af | Adds 1000 Genomes allele frequencies to the output |
af_1kg | Adds 1000 Genomes frequencies explicitly by project |
af_gnomad | Adds gnomAD frequencies to the output |
max_af | Reports the maximum allele frequency observed across sourced populations |
check_existing | Cross-references existing variant records such as dbSNP entries |
pick | Emits one consequence line per variant for simpler downstream parsing |
plugin | Loads a plugin, including frequency plugins such as the gnomAD plugin |
Two workflow patterns from the literature show why the command-line route earns its complexity. A COVID-19 severity exome study annotated against GRCh38 with VEP and then filtered on predicted pathogenicity plus population allele frequencies to isolate low-frequency and rare candidates [2]. A sickle cell GWAS in Saudi Arabia used VEP for functional annotation of its association signals [7]. In both cases frequency and consequence traveled together in one annotated file, which is exactly the pairing you want when triaging candidate lists.
VEP also extends beyond human data. An RNA-seq variant-calling study in horses used VEP to call and filter sequence variants against the equine genome, so the same annotation logic generalizes across species where Ensembl provides the required resources [8].
A Complete Worked Example From rsID to Interpreted Frequency
Walk through the whole chain once with rs334, the sickle-cell variant in HBB, to lock the workflow in. Sickle cell disease is a fitting example because a Saudi case-control GWAS of the disease annotated its findings with VEP and faced exactly the frequency-comparison questions this guide covers [7].
- State the question precisely. What is the frequency of the T allele at rs334 in West African populations under GRCh38?
- Browser check. Open the Variation page for rs334, go to Population genetics, and confirm the allele string and the gene context on the page match your expectation.
- API pull. Run the
curlcommand from the API section withpops=1and save the JSON to a file namedrs334.jsonso you have a permanent record. - Filter in code. Run the Python loop above with
allele_of_interest = "T"and read the per-population lines. Expect the African super-population line to stand out sharply from the global line, because this allele is ancestry stratified by definition. - Cross-check with VEP. Run the VEP REST call on the same rsID and confirm the frequency block agrees with the variation endpoint. Agreement between two independent code paths is your validation that the identifier resolved correctly.
- Interpret with context. A high frequency in one population and near absence elsewhere is not an error. It is a signal that any disease claim for this variant must be population specific, the same reasoning that led the TGFB1 study to report a frequency range spanning zero to 11.21 percent across databases rather than a single number [1].
That six-step pattern, state, check, pull, filter, cross-check, interpret, transfers unchanged to any variant.
Comparing Your Own Cohort With Ensembl Reference Populations
A frequent real task is placing your cohort's observed frequency in context. The literature gives a template for doing this well.
Match populations honestly. The Nigerian pharmacogenomics study restricted its primary analysis to the 207 Nigerian individuals in 1000 Genomes, split as 108 Yoruba and 99 Esan, rather than averaging across Africa [3]. The Burmese refugee pharmacogenetics study compared its 62 participants against Ensembl populations neighboring Myanmar and America and found roughly 20 percent frequency differences for OPRM1, CYP2D6, SLCO1B1, MTHFR, and VKORC1 variants [9]. Both conclusions came from choosing the closest reference population, not the largest one.
Report disagreement rather than hiding it. The DPYD exome study in Russian oncology patients compared observed allele frequencies against European and East Asian reference populations precisely because DPYD shows substantial population variability [10]. The SVIL COVID study reported its 29.2 percent cohort frequency against the 1.051 percent gnomAD South Asian figure side by side and then investigated the difference [2]. When your cohort and the reference disagree by an order of magnitude, that is a finding about sampling, ancestry, or selection, and it belongs in your paper.
Pull the reference numbers the same way every time. Retrieving Ensembl frequencies through one documented route, such as the REST API, and citing the release makes the comparison reproducible for reviewers, which is the practice the Nigerian study followed [3].
Common Mistakes and Limitations
These are the errors that actually corrupt frequency lookups, in rough order of how often they bite.
- Assembly mismatch. A GRCh37 coordinate searched against GRCh38 resolves to the wrong base, and every frequency you read afterward is for a different variant. Always search by rsID when one exists, and if you must use coordinates, set the assembly selector before searching, not after.
- Ancestry mismatch. Comparing a cohort to the wrong reference population produces fake surprises. The SVIL study's 29.2 percent versus 1.051 percent gap was resolvable only because both numbers were read as ancestry-specific facts. The Burmese study's 20 percent discrepancies against Ensembl populations make the same point from the other direction [9]. Super-population averages can bury the group you actually care about, so drill into subpopulations before concluding anything.
- Reading "no data" as "absent". A frequency of zero in a database means zero among the chromosomes sampled, which may be a few hundred. Absence of a row in the population table means the project did not genotype or provide that region at all. These are different statements, and confusing them inflates rarity claims. The spread from zero to 11.21 percent across four databases for one TGFB1 variant shows how differently the same variant can look depending on who was sampled [1].
- Ignoring exome versus genome capture. Exome-based datasets only cover capture targets, and coverage varies between designs. A variant absent from an exome dataset may simply fall outside its targets. When a study compares Ensembl exome resources against genome resources and gets different ranges, capture differences are one reason [1].
- Confusing minor allele frequency with your allele's frequency. Minor allele frequency describes whichever allele is less common in that population. If your allele is the major allele somewhere, the MAF column describes the other one. Always resolve frequencies by allele label, never by position in the table.
- Trusting a single database for a consequential claim. Studies that matter routinely triangulate. The TGFB1 work used Ensembl 1000 Genomes, Ensembl NHLBI Exome, gnomAD, and Genome Asia 100K together [1]. The TMPRSS2 expression-variant work pulled frequencies across multiple large databases including Ensembl [11]. One database is a hint. Four that agree are evidence.
- Assuming low frequency settles pathogenicity. Very low population frequency is consistent with pathogenicity, and an ESR2 in silico screen flagged predicted damaging variants with very low population frequencies, but those were computational predictions requiring further validation, not clinical proof [5]. Frequency evidence combines with segregation, functional, and disease data. It never stands alone.
- Stale cached versions. VEP updates roughly quarterly, and Ensembl releases refresh the underlying variation data on their own schedule [6]. If a frequency in your saved output disagrees with a fresh lookup, check release versions before assuming anyone made an error. Record the Ensembl release number and VEP version in your methods section.
Tips for Faster, Cleaner Ensembl Variant Population Frequency Lookups
- Lead with the rsID. It is assembly independent, so it sidesteps the most damaging error in this workflow.
- Verify the reference allele first. Before reading any frequency, confirm on the Variation page that the reference allele on the page matches your VCF or manuscript. Strand and orientation errors are silent otherwise.
- Work top down. Read the super-population frequency first, then the subpopulation, then the specific group of interest. This prevents over-reading a small subpopulation count while still keeping the fine detail available.
- Batch through the API. Anything you will repeat belongs in a script. A short requests loop with a sleep keeps you well inside service limits and produces a file you can rerun when Ensembl releases update.
- Save your inputs and outputs. Store the exact query URLs or POST bodies alongside the JSON responses. Reproducibility in a paper starts with the query, not the analysis.
- Cross-check against an independent resource. Validating Ensembl findings against dbSNP, ClinVar, or the GWAS Catalog is standard practice in published variant screens [4], and comparing across large genome databases was likewise the approach taken in the TMPRSS2 work [11].
- Use frequency as a filter, not a verdict. Filtering pipelines that combine population allele frequency with pathogenicity prediction, as the COVID severity exome study did, are the mainstream pattern [2]. Ensembl's frequency fields feed that filter directly.
- Record versions. Note the Ensembl release, the assembly, and the VEP version if you use it [6]. A frequency without a version is not reproducible.
Frequently Asked Questions
Which population databases can I see frequencies from in Ensembl?
The human Variation pages show allele frequencies from large population sequencing projects loaded into Ensembl Variation, most prominently 1000 Genomes and gnomAD, with older resources such as the NHLBI Exome project also available for many variants. Published studies have drawn on Ensembl 1000 Genomes and Ensembl NHLBI Exome data alongside gnomAD for frequency comparisons [1], and other work has retrieved 1000 Genomes Phase 3 counts and frequencies directly through Ensembl [3].
Does it matter whether I use GRCh37 or GRCh38?
Yes, completely. Coordinates differ between the two assemblies, so a coordinate-based search against the wrong assembly finds the wrong base or nothing at all. Use rsIDs when possible, and if you enter coordinates, set the assembly selector first. The main ensembl.org site defaults to GRCh37-era archives being served separately, so check which assembly the page reports before reading numbers.
Why does one database show a frequency and another shows nothing?
Different projects sampled different people and used different capture technologies, so the same variant can be present in one dataset and unobserved in another. The TGFB1 variant c.788C>T ranged from zero to 11.21 percent across four public databases [1]. Absence from one project is not proof the variant is absent from humanity.
How do I look up frequencies for many variants at once?
Use the POST form of the Ensembl REST variation endpoint with a JSON list of IDs, or run the list through VEP in web or command-line form. VEP reports allele frequencies from studies including gnomAD as part of its annotation output and is designed for batch annotation with filtering [6]. The Python loop in this article handles small batches through single requests with a delay.
What is the difference between allele frequency and minor allele frequency?
Allele frequency is the share of chromosomes in a population carrying a specified allele. Minor allele frequency is the share carrying whichever allele is less common in that population, which can be a different allele from your variant of interest. Resolve frequencies by allele label in Ensembl output rather than by assuming the smaller number describes your allele.
Can I do this for non-human species?
Yes, with caveats. Ensembl hosts variation data for many species and VEP runs against non-human genomes, as demonstrated by an equine RNA-seq variant study that used VEP for variant calling and filtering in horses [8]. However, population-frequency depth depends on what sampling projects exist for that species, so expect far richer frequency data for human than for most organisms.
How current are the frequencies in Ensembl?
Ensembl refreshes variation data with each release cycle, and VEP is updated roughly every quarter to incorporate the latest gene, variant, and phenotype information [6]. For a manuscript, record the Ensembl release number and the date of your lookup so reviewers can reproduce the numbers.
Does a very low population frequency mean my variant is pathogenic?
No. Low frequency is consistent with pathogenicity and strengthens a candidate case, but it is one line of evidence. An in silico screen of ESR2 variants identified strongly predicted damaging variants with very low population frequencies, yet those findings remained computational and required further validation [5]. Interpret frequency alongside consequence prediction, segregation, functional data, and disease context.
Sources
- Case-Control Genotyping of the c.788C>T Variant of Transforming Growth Factor-Beta 1 Gene in Otosclerosis in the South Indian Population.
- Whole-exome sequencing identifies a missense variant in the cytoskeletal gene SVIL implicating actin remodeling in COVID-19 severity in a Pakistani cohort.
- Clinically actionable pharmacogenomic variants for anticancer therapy in Nigeria: first comprehensive variant profiling in underrepresented Nigerian cohorts.
- Whole-exome sequencing identifies cancer-associated variants of the endo-lysosomal ion transport channels in the Saudi population.
- In Silico Characterization of Pathogenic ESR2 Coding and UTR Variants as Oncogenic Potential Biomarkers in Hormone-Dependent Cancers.
- Annotating and prioritizing genomic variants using the Ensembl Variant Effect Predictor-A tutorial.
- Unraveling the Complex Genomic Interplay of Sickle Cell Disease Among the Saudi Population: A Case-Control GWAS Analysis.
- Sequence variant analysis of RNA sequences in severe equine asthma.
- Allelic frequencies of 60 pharmacogene variants assessed within a Burmese population residing in northeast Indiana, USA.
- Allelic Variants of the DPYD Gene in Russian Patients with Cancer: The Results of Exome Sequencing.
- Genetic variants that influence SARS-CoV-2 receptor TMPRSS2 expression among population cohorts from multiple continents.