Ensembl Gene View vs. Transcript View: Which One Should You Use
By Dr. Zubair Khalid, DVM, MS, PhD ·

Ensembl Gene View shows a whole gene locus, every transcript it produces, and everything annotated around it. Transcript View shows a single one of those transcripts in full detail, from its 5'UTR through each exon to its protein product. The rule of thumb is simple. Start in Gene View when your question is about the gene as a biological unit. Switch to Transcript View the moment your question names a specific transcript, exon, UTR, or protein.
Ensembl, produced jointly by EMBL-EBI and the Wellcome Sanger Institute, is a genome browser and annotation system covering vertebrates and dozens of other species. Its display is organized around the gene, but almost nothing in molecular biology behaves as one clean string of sequence. Most human protein-coding genes produce several transcripts, called isoforms, and those isoforms can differ in exons, untranslated regions, and the protein they encode. The gap between the gene as a locus and the transcript as a molecule is exactly what the two views are built around, so choosing between them is really a choice about your unit of analysis.
This guide covers the difference between the Ensembl gene view and the transcript view, when to use Ensembl gene view, when to drop to the transcript level, and how both fit into a working browser workflow. It ends with bulk retrieval, because most real projects outgrow clicking within an hour.
How to Use Ensembl: A Minimal Genome Browser Tutorial
Open www.ensembl.org, type a symbol such as BRCA1 into the search box, choose the species, and the site takes you straight to the gene page. Three view levels organize the whole browser.
- Region view draws a stretch of chromosome with every annotated feature on it.
- Gene View narrows to one gene and everything attached to it.
- Transcript View narrows further to a single transcript.
Stable identifiers follow a predictable scheme. Genes carry ENSG prefixes, transcripts ENST, proteins ENSP, and exons ENSE, each followed by a number. A version suffix after a dot increments whenever the model changes, so a versioned transcript ID pins the exact exon structure you looked at. Record versioned IDs in methods sections and pipelines, because an unversioned ID can point to a different model after a future release.
The location image draws exons as blocks. Filled blocks are coding sequence, unfilled blocks are untranslated regions, and thin connecting lines are introns. Genes on the minus strand are drawn reversed, so their exon 1 sits at the higher chromosomal coordinate. Every page carries an Export data menu that converts what you see into FASTA or tab-delimited text, which becomes important once you outgrow clicking.
A few terms recur throughout. A gene is a locus the annotators treat as one unit, usually because its transcripts share sequence or function. A transcript is a model of a mature RNA, built from exons (the retained blocks) with introns (the intervening sequence) spliced out. The untranslated regions, called the 5'UTR and 3'UTR, flank the coding sequence (CDS). A cDNA is the DNA copy of that mature RNA. A biotype is the annotation label for what a feature is, such as protein_coding, lncRNA, or nonsense_mediated_decay. An isoform is one of several transcript variants produced by the same gene.
Gene View: The Gene as a Locus
Gene View answers the question, what is this gene and what is known about it. The page is organized around the locus, the physical position on the chromosome, and it stacks every piece of annotation Ensembl holds onto that position.
What the transcript table tells you
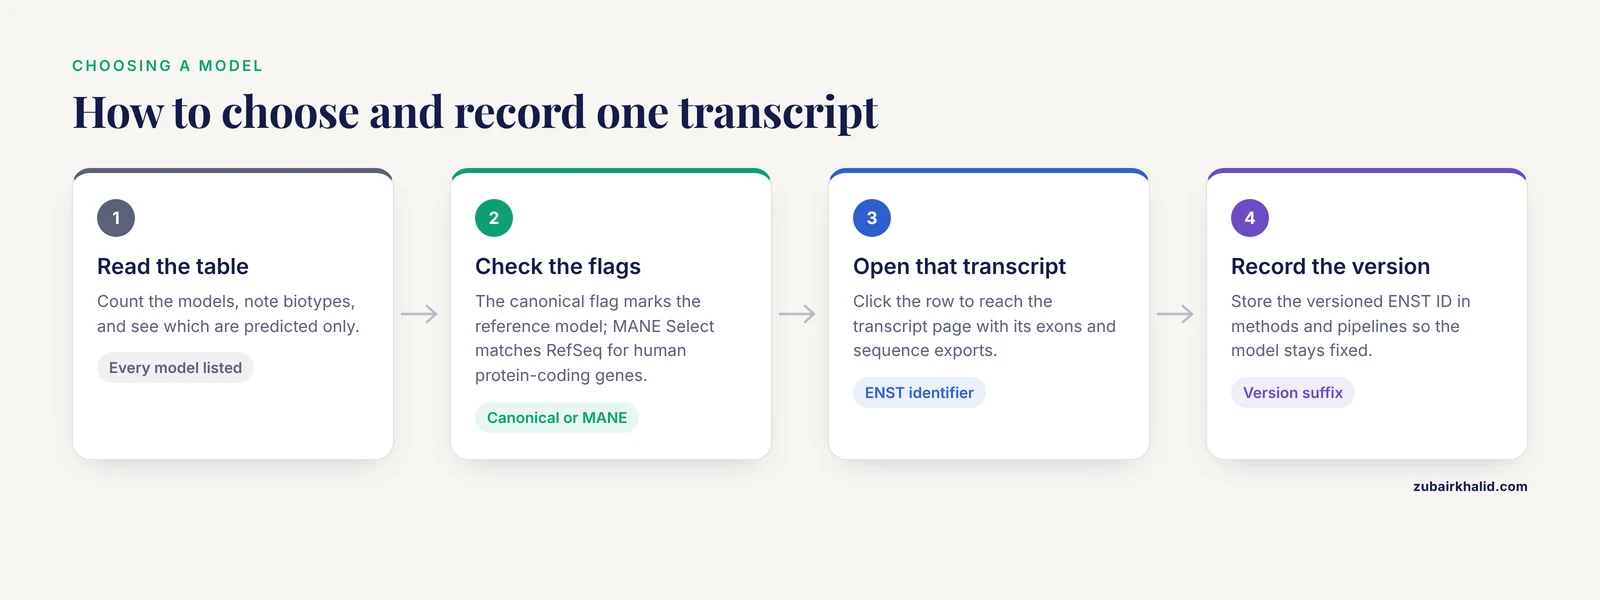
The transcript table is the heart of the page. It lists every transcript model with its identifier, biotype, length, and flags. Two flags deserve attention. The canonical flag marks the transcript Ensembl treats as its reference model for the gene, usually the best supported and most conserved one. The MANE Select flag, present for human protein-coding genes, marks the transcript matched one-to-one with the RefSeq record at NCBI as the agreed reference for clinical and computational work. If you ever have to justify why you analyzed one isoform and not another, those two flags are the defensible answer.
Read the table before anything else on the page. It tells you how many models exist, which are protein-coding, which are predicted only, and which one is canonical. Every downstream task, from primer design to variant annotation, inherits that choice.
What lives only at gene level
Around the table, the gene page carries data that only make sense for the locus as a whole. The variation section maps variants onto the gene with their predicted consequences per transcript. The phenotype section collects disease associations. The comparative genomics section lists orthologues (genes in other species that descend from the same ancestral gene) and paralogues (duplicates that arose within the same genome), organized into gene trees. The regulation section shows regulatory features annotated across the locus. External references link out to UniProt, RefSeq, OMIM, and model organism databases.
Other resources confirm the pattern that the gene is the hub. CancerGenes, built to prioritize candidate genes for cancer resequencing projects, annotates each gene with its structure, protein length, transcript count, and experimentally determined transcript control regions, and links out to both the UCSC and Ensembl browsers [1]. Xenbase, the database for Xenopus frogs, builds gene-specific pages that gather expression, function, disease links, and reagents, then connect each gene to Ensembl, NCBI Entrez, and UniProt [2]. When a curator wants to describe a biological unit, the gene is the address.
Gene View for comparative genomics
Cross-species questions start here. Orthologue tables and gene trees let you trace a gene across species before you pull any sequence, and standardized manual annotation across vertebrate genomes was an explicit design goal of the curation effort behind these resources, precisely so that orthologue comparisons would hold up [3]. The practical habit is to check the support level of the orthologue, then open the orthologous gene's own page in the other species, where you will again face the gene-versus-transcript choice.
Transcript View: One Transcript, End to End
Transcript View answers a different question, what exactly does this transcript contain and encode. Click any transcript in the gene table and the page narrows to that one model, identified by its ENST identifier.
The exon and sequence half of the page
The summary block states the biotype and the canonical and MANE flags. The exon table gives the chromosomal coordinates of every exon, its stable exon ID, and its phase, a number that tracks where each exon boundary falls inside a codon. Phase matters when you splice exons together yourself, because a boundary that splits a codon must join a boundary with the matching phase or the reading frame breaks.
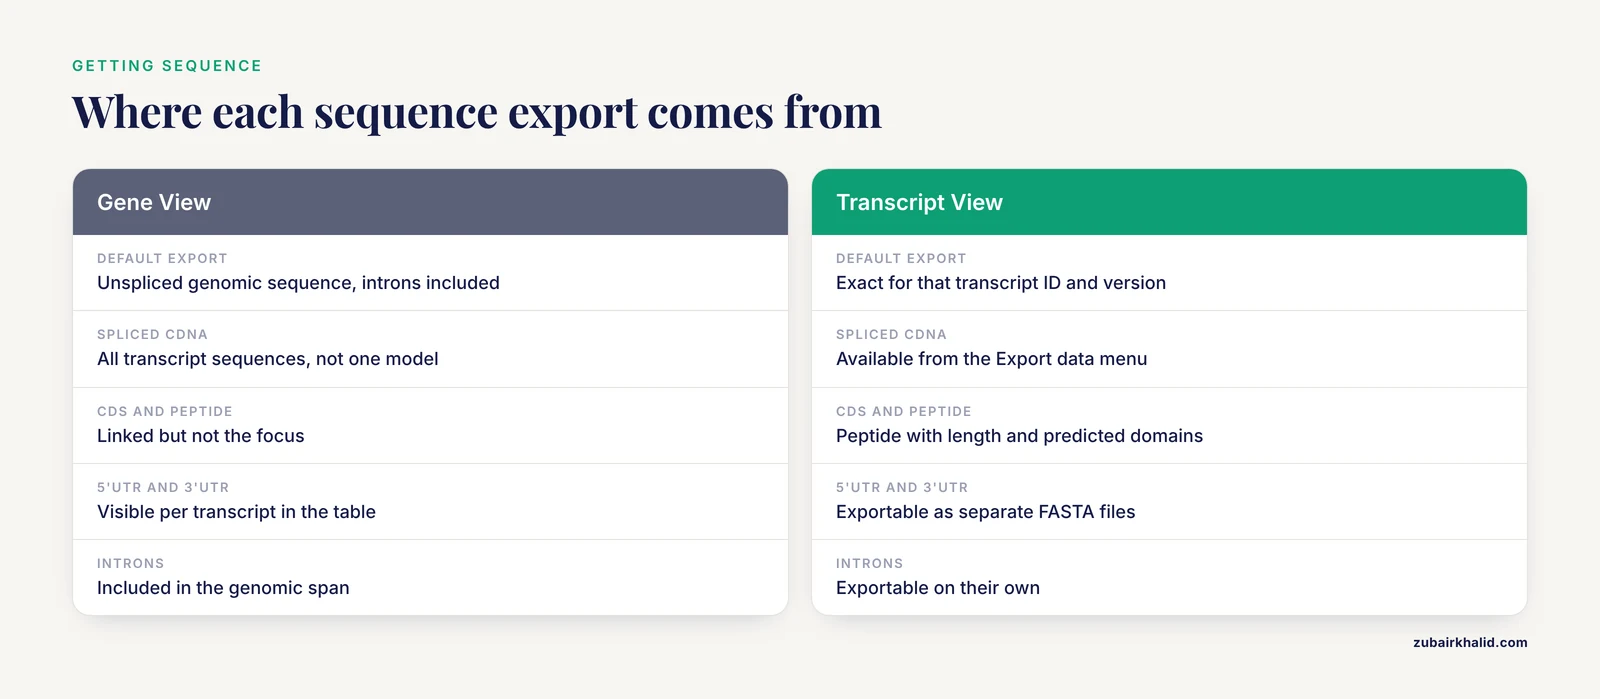
The sequence section is where Transcript View earns its keep. From this one page you can export the cDNA (the spliced transcript), the CDS (just the coding bases), the peptide (the translated protein), the 5'UTR, the 3'UTR, individual exons, the introns, and the unspliced genomic span. Each export is exact for that transcript ID and version.
The protein half of the page
For protein-coding transcripts, the page adds the translation with its length, predicted domains from sources such as Pfam and PROSITE, and the matching UniProt entry. This is where a coding variant becomes interpretable, because a residue only means something in the context of the protein it lands in. Supporting evidence tracks show the mRNA and protein alignments that justify the model, exon by exon, which is the fastest way to see whether a small exon or a long UTR rests on real data.
Three kinds of work that live almost entirely at this level
Exon-level experimental design. PCR-based resequencing of candidate disease genes proceeds exon by exon, and the design burden is real. The TrAPSS system for mutation screening was built around this problem, noting that public genome resources make the sequence easy to view but leave the information management to the user. Their published example, ten Leber congenital amaurosis genes (an inherited retinal dystrophy) totaling 149 exons, is the scale at which manual primer design collapses [4]. Every one of those exons is defined in a transcript view, not the gene view.
UTR-level regulation. Features in the 5'UTR, upstream start codons, upstream open reading frames (uORFs), GC content, RNA motifs, and secondary structures, change how efficiently a transcript is translated. A study of the ABCA1 gene, which causes Tangier disease when lost, retrieved 5'UTR sequences for 55 vertebrate orthologues from Ensembl and UCSC and mapped conserved upstream ORFs, transcription factor motifs (some cancer related), and a target site for the microRNA hsa-miR-4474-3p onto them [5]. None of that is reachable from the gene page alone, because UTRs belong to individual transcripts.
Transcript-anchored post-transcriptional data. A-to-I RNA editing, the conversion of adenosine to inosine in RNA, is the most common non-transient epitranscriptome modification, meaning a chemical change to the RNA molecule itself. REDIportal catalogs around 16 million such editing sites and connects its recoding events to Ensembl transcripts [6]. An editing site only changes a protein if it lands inside the CDS of a transcript that is actually expressed, so the transcript is the anchor.
Ensembl Gene View vs. Transcript View at a Glance
The two views are not competitors. They are two zoom levels over the same annotation, and this table is the fastest way to see which one your question belongs to.
| Feature | Gene View | Transcript View |
|---|---|---|
| Unit shown | One gene locus and every transcript it produces | One transcript of that gene |
| Primary identifier | ENSG (gene ID) | ENST (transcript ID) |
| Exon structure | All transcripts overlaid on the locus | The exact exon set of that transcript, with codon phase |
| UTRs | Visible per transcript in the table and image | Full detail, exportable as 5'UTR and 3'UTR FASTA |
| Protein | Linked but not the focus | Central, with peptide sequence, length, and domains |
| Variants | All variants across the locus | Variants with consequences computed on that transcript |
| Phenotypes and disease links | Prominent | Usually inherited from the gene |
| Homology | Orthologues, paralogues, and gene trees | Not the focus |
| Regulatory features | Regulatory regions across the locus, where annotated | Not the focus |
| Typical exports | Unspliced genomic sequence, all transcript sequences | cDNA, CDS, peptide, exons, introns, UTRs for that transcript |
| Typical question | What is this gene and what is known about it | What exactly does this transcript contain and encode |
The deepest difference is the unit of analysis. Gene View treats the gene as the object and summarizes its transcripts. Transcript View treats one transcript as the object and exposes everything attached to it. Variant interpretation shows the split most sharply. The gene page can tell you that a variant exists in the locus, but whether it changes a protein, hits a splice site, or sits in a 5'UTR depends on which transcript you ask, and that answer is computed per transcript.
Which View Answers Which Question
So, Ensembl gene view or transcript view? For most tasks the honest answer is both, in a fixed order, gene first and transcript second. The table maps common tasks to the view where the work actually happens.
| Task | Start in | Why |
|---|---|---|
| Find a gene by symbol or disease | Gene View | The search box lands there |
| Inventory isoforms and biotypes | Gene View | The transcript table lists every model |
| Confirm the canonical or MANE transcript | Gene View | The flags sit in the transcript table |
| Get exon coordinates for PCR primers | Transcript View | Primers bind one transcript's exons [4] |
| Pull cDNA or peptide for BLAST | Transcript View | Those sequences are defined per transcript |
| Map a coding variant to a protein change | Transcript View | Consequences are computed per transcript [7] |
| Analyze 5'UTR or 3'UTR features | Transcript View | UTRs belong to individual transcripts [5] |
| Find orthologues in other species | Gene View | Comparative genomics lives on the gene page |
| Check phenotypes or disease associations | Gene View | Phenotype panels are gene-level |
| View regulatory regions around the gene | Gene View | Regulation is annotated across the locus |
| See neighboring genes | Gene View | Genomic context is gene-level |
| Check recoding RNA edits on a transcript | Transcript View | Editing sites are anchored to transcripts [6] |
If you cannot decide, start in Gene View. Any transcript is one click away, and the gene-level context prevents the most common error in this area, which is analyzing an isoform that is poorly supported or barely expressed.
A note on naming. Some older papers and tools say gene view to mean the entire browser page for a gene, transcript graphics included. On the current Ensembl site, the gene page contains the transcript table, and each row opens the transcript page. The distinction used in this guide matches the tabs as they exist today.
Worked Scenarios
Scenario 1: A variant upstream of the start codon in ABCA1
You are handed a rare variant that sits upstream of the annotated start codon of ABCA1 (ENSG00000165029), and you need to know whether it could matter.
- Search ABCA1 and open the gene page. Confirm the locus, the biotype, and the set of transcripts.
- Read the transcript table and open the main protein-coding transcript.
- On the transcript page, find where the 5'UTR ends and the CDS begins, and locate your variant inside the UTR.
- Export the 5'UTR sequence and scan it for upstream start codons, upstream ORFs, GC content, RNA motifs, and secondary structure.
- Use the comparative data on the gene page to pull orthologous 5'UTRs and look for conserved blocks around your variant.
That is, step for step, the design of a published ABCA1 analysis. The authors studied 5'UTR features across 55 vertebrate orthologous genes retrieved from Ensembl and UCSC, and reported conserved upstream ORFs, including a primate ORF overlapping the main ORF, conserved hairpin structures, transcription factor motifs, and a microRNA target site [5]. Because loss of ABCA1 causes Tangier disease, a rare disorder of cholesterol transport, a conserved regulatory variant in its 5'UTR is a credible hypothesis, and only the transcript view can place the variant relative to the start codon.
Scenario 2: Exon-by-exon PCR primers for a screening project
Your lab is resequencing a panel of candidate disease genes in patient cohorts, exon by exon.
- On each gene page, confirm the gene identity and count its transcripts.
- Choose the reference transcript, usually the canonical or MANE Select model, and record its versioned ENST ID.
- Open the transcript page and export the exon sequences and coordinates for that transcript.
- Design primers per exon, keeping amplicons clear of splice junctions unless you intend to span them, and note the phase of each boundary.
- Repeat per gene, and store the transcript IDs alongside the primer tables so the design stays reproducible.
This is the workflow TrAPSS was built to accelerate. Its authors describe the administrative burden of screening hundreds of genes and thousands of exons in thousands of patients, and give ten Leber congenital amaurosis genes, 149 exons, as the scale where manual primer design becomes an information management problem [4]. The exon list that drives the whole project is a transcript-level object.
Scenario 3: Mapping rare nonsynonymous variants to the right protein isoform
You have a list of rare coding variants and want to know which ones threaten protein function. A nonsynonymous SNP (nsSNP) is a single-base change that alters an amino acid, and minor allele frequency (MAF) describes how often the rarer allele appears in a population.
- On each gene page, list the protein-coding transcripts.
- For each transcript, open the transcript view and pull the peptide, its length, and its predicted domains.
- Map your variant onto each transcript and record which isoforms change a residue inside a conserved domain.
- Prioritize variants that hit the same conserved residue across the isoforms that matter.
A computational study of rare pathogenic variants in esophageal cancer markers followed this logic. It collected 126 protein isoforms from NCBI and Ensembl across 28 esophageal cancer genes, restricted to nsSNPs with MAF under 1 percent, and mapped ten rare coding variants onto 23 transcript-level variants in genes including GRB7, SLCO1A2, HIF1AN, KCNQ3, and DLL1. The substitutions fell at conserved residues, and structural modeling predicted losses of protein stability and domain integrity [7]. The gene page alone cannot produce that result, because the unit of analysis is the isoform.
Bulk Retrieval: When the Browser Is Not Enough
Clicking scales to a handful of genes. Past that, Ensembl offers three bulk routes, and all of them preserve the gene-versus-transcript distinction. Everything the two views display is available programmatically, keyed by the same ENSG, ENST, and ENSP identifiers, because the browser is a viewer, not a pipeline component.
BioMart, linked from the Ensembl home page, is the point-and-click bulk tool. Choose the Ensembl genes database and your species, apply a filter such as a gene list or chromosomal region, then select attributes. Transcript-level attributes include the cDNA sequence, the CDS, the peptide, and the 5'UTR and 3'UTR coordinates for every transcript. Gene-level attributes include the ENSG ID, biotype, and description. The output downloads as a table or FASTA file.
The REST API serves the same data to scripts. A minimal call pulls the cDNA for one transcript:
curl -H 'Content-Type: application/json' 'https://rest.ensembl.org/sequence/id/ENST00000357654?type=cdna'The response is JSON with the sequence in the seq field, here the BRCA1 cDNA. The same endpoint accepts other sequence types, including cds, peptide, and unspliced genomic, and the official documentation lists a plain-text output option. Swap the identifier and the call works from any language.
For whole-genome work, download the released GTF or GFF3 annotation file plus the cDNA and peptide FASTA files from the Ensembl FTP site. A GTF file is a tab-delimited annotation of every gene, transcript, exon, and codon boundary on the genome, and it is the format most alignment and quantification tools consume. Pin the release number alongside your results, the same way you record a genome assembly, because annotation changes between releases.
Whole-genome studies lean on these exports. One survey of repetitive elements downloaded 5' and 3' UTR sequences plus upstream and downstream flanks for the human gene set from the Ensembl database, then classified 1,068,400 repeats into 37 classes and 1,235 subclasses across 33,761 genes and 57,365 transcripts, and found tandem repeats (short motifs repeated head-to-tail) clustered near transcription start sites, the positions where transcription begins [8]. Desktop tools follow the same pattern. GenePalette retrieves annotated sequence from GenBank or Ensembl and displays transcription factor binding sites relative to the introns and exons of annotated genes, from kilobase scales down to single nucleotides [9].
Finally, match the archive to your assembly. If your reads were aligned to GRCh37, the previous human assembly, browse the dedicated GRCh37 archive site rather than the current release, because coordinates do not transfer between assemblies.
Annotation Quality: Why the Same Gene Looks Different in Different Places
The annotation you browse is a curated product, not a raw fact, and its quality varies by species and by resource.
For human and mouse, Ensembl ships annotation produced with the GENCODE project, which combines automated pipelines with manual curation. The Vertebrate Genome Annotation (Vega) database was built to hold exactly that kind of manual annotation of finished vertebrate sequences on an Ensembl-style schema, with every gene structure supported by transcriptional evidence you can examine in the browser [3].
Curation changes conclusions. In the ENCODE Genome Annotation Assessment Project, which challenged annotation groups to reproduce the curated GENCODE set, most mRNA models matched closely at the level of exon and intron coordinates. Protein annotation did not. GENCODE assigned proteins to 41 percent of the mRNAs in the benchmark regions, while AceView, a cDNA-based annotation built from GenBank, dbEST, and RefSeq evidence, did so in virtually all [10]. The transcript you open in Transcript View is therefore only as complete as the evidence behind it, and the absence of a protein product is not proof that none exists.
Resource boundaries matter as well. H-InvDB mapped 244,709 human cDNAs onto the hg19 assembly and identified 43,829 gene loci. Of its annotated genes, 19,309 were not present in RefSeq or Ensembl at the time, and among those, 233 turned out to encode proteins and 11 were known Mendelian disorder genes [11]. A gene missing from one database is not missing from biology, which is why Ensembl pages carry cross-references instead of claiming to be the only record.
Outside the well-curated species, expect thinner models. Ensembl Rapid Release carries preliminary annotation for newly assembled genomes. The house sparrow genome carried 23,574 transcripts in Rapid Release, and an RNA-Seq-based reannotation expanded that to 38,592 transcripts while adding 5'UTRs to 82.7 percent and 3'UTRs to 93.8 percent of transcripts, with 96.4 percent completeness against the standard single-copy gene set for the passerine lineage (BUSCO) [12]. A transcript in such a genome may look like bare coding sequence simply because its UTRs were never annotated.
The practical checks follow directly. In Gene View, look at the annotation source and the evidence tracks. In Transcript View, look at the supporting mRNA and protein alignments before you trust a UTR boundary or a small exon.
Common Mistakes and Limitations
- Taking the first transcript in the table. Table order is not a recommendation. Use the canonical flag, or the MANE Select flag for human protein-coding genes, and state in your methods which transcript you used and why.
- Ignoring version suffixes. Two versions of the same ENST describe different model states. Pipelines that store unversioned IDs can silently change meaning after a release, and papers that cite unversioned IDs cannot be reproduced exactly.
- Exporting the wrong sequence from the gene page. The default genomic export is unspliced and includes every intron. If you meant the spliced cDNA, the CDS, or the peptide, export from the transcript page or specify the type explicitly.
- Trusting UTR boundaries everywhere equally. UTR annotation depends on transcript evidence, and some genomes, especially rapid-release assemblies, carry sparse UTR models. A transcript that shows no 5'UTR may simply be missing its annotation rather than lacking a UTR in nature.
- Assuming exon numbers are stable. Exon 3 of one transcript is not exon 3 of another isoform of the same gene. Anchor every claim to a versioned transcript ID, not to an exon number.
- Mixing coordinate conventions. The Ensembl browser and Ensembl GTF files use 1-based, fully closed coordinates. BED files use 0-based, half-open intervals. Converting wrong shifts every interval by one base and quietly breaks overlap tests.
- Forgetting strand. On minus-strand genes the browser draws the gene reversed, exon 1 sits at the higher coordinate, and a script that naively sorts coordinates in ascending order will read the transcript backwards.
- Treating transcript counts as biology. The number of isoforms shown is a property of the annotation, and different resources disagree, sometimes substantially. Report the count together with the resource and release.
- Working on a stale assembly. Coordinates from GRCh37 do not match GRCh38. Use the archive site that matches your alignment, or lift your coordinates with a dedicated conversion tool before comparing anything.
- Eyeballing variant consequences. Ensembl ships the Variant Effect Predictor (VEP) to compute consequences against every transcript of a gene. Reading the location image is a sanity check, not a consequence call.
One limitation sits above all of these. A browser view supports interpretation, it does not replace it. Individual variant calls and experimental decisions need review by a qualified specialist who knows the case, the tissue, and the literature.
Frequently Asked Questions
What is the difference between the Ensembl gene view and the transcript view?
Gene View shows the entire gene locus with all of its transcripts, variants, phenotypes, and homologues, while Transcript View shows one specific transcript with its exact exons, UTRs, and protein product. Gene View is the hub and Transcript View is the detail page. Most workflows touch both, starting at the gene and dropping down the moment a specific sequence is needed.
When should I use the Ensembl gene view?
Use Gene View when your question is about the gene as a unit, such as what the gene does, which isoforms exist, which species share it, which phenotypes are associated, or what sits next to it in the genome. It is also the landing page, so every search starts there even when the answer ends up in a transcript.
Which transcript should I pick when Ensembl shows several?
Pick the transcript flagged as canonical, or the MANE Select transcript for human protein-coding genes, unless your dataset or experiment was defined against a different isoform. Record the versioned transcript ID in your methods so the choice is reproducible.
How do I download a cDNA, CDS, or UTR sequence from Ensembl?
Open the transcript's page and use the Export data menu, which offers cDNA, CDS, peptide, 5'UTR, 3'UTR, exons, introns, and unspliced genomic sequence. For many transcripts at once, use BioMart or the REST API, and for whole genomes use the GTF and FASTA files on the FTP site.
Why does the same variant look different in different transcripts?
Because consequences are computed per transcript. A variant can be coding in one isoform, intronic in another, and 5'UTR in a third, so its predicted effect changes with the transcript you query. That is a property of the annotation, not an error, and it is why variant reports must name the transcript.
Can I use Ensembl transcript view for non-model organisms?
Yes, the views work the same way, but annotation depth varies by species. Newly added genomes often carry preliminary transcript models with sparse UTRs and limited functional annotation, so check the evidence tracks before treating any boundary as settled.
Sources
- CancerGenes: a gene selection resource for cancer genome projects.
- Navigating Xenbase: An Integrated Xenopus Genomics and Gene Expression Database.
- The Vertebrate Genome Annotation (Vega) database.
- Transcript annotation prioritization and screening system (TrAPSS) for mutation screening.
- Functionally Significant Features in the 5' Untranslated Region of the ABCA1 Gene and Their Comparison in Vertebrates.
- REDIportal: toward an integrated view of the A-to-I editing.
- Computational identification of rare pathogenic genomic variants in esophageal cancer markers: Transcript-level analysis, sequence-based insights, and structural-functional impacts of non-synonymous SNPs.
- Characterization and distribution of repetitive elements in association with genes in the human genome.
- GenePalette: a universal software tool for genome sequence visualization and analysis.
- AceView: a comprehensive cDNA-supported gene and transcripts annotation.
- H-InvDB in 2013: an omics study platform for human functional gene and transcript discovery.
- Rapid genome functional annotation pipeline anchored to the house sparrow (Passer domesticus, Linnaeus 1758) genome reannotation.