How to Find DNA Methylation Data in Ensembl
By Dr. Zubair Khalid, DVM, MS, PhD ·

After reading this guide you will be able to open any human or mouse gene in Ensembl, switch on the methylation signal tracks, layer them with CpG island and regulatory build annotations, and export the same data through the REST API, the public MySQL server, or BioMart. You will also know which steps people get wrong, such as querying the wrong genome build or searching for methylation tracks in species that do not carry them.
What you need on hand before starting:
- A web browser for the graphical workflow at www.ensembl.org
- Optionally, curl for REST calls, a MySQL client for database queries, and R with the biomaRt package for scripted work
- A gene symbol or a genomic coordinate range you care about
- The genome build you are working in, for example GRCh38 for human or GRCm39 for mouse
What Ensembl Actually Stores for DNA Methylation
Ensembl is not primarily a methylation data producer. The Ensembl regulation resources collect epigenetic marks, transcription factor binding, and DNA methylation for human and mouse, integrate them, and present a functional annotation of regulatory elements along both genomes [1]. Starting from well-studied cell lines, the resource has expanded toward a greater variety of samples as data become available [1].
Three distinct layers matter for methylation work:
- Methylation signal tracks. Percent methylation values at individual CpG sites or short regions, measured per cell type or cell line, largely drawn from large epigenomics projects. The browser displays these as histograms.
- CpG island annotations. Sequence-based predictions of GC-rich regions rich in CpG dinucleotides. These are not measurements of methylation. Many genes carry CpG islands at promoters, and methylation of those islands often represses transcription.
- The regulatory build. Ensembl's merged annotation of promoters, enhancers, CTCF binding sites, and open chromatin regions, each tied to the epigenomes in which they were observed [1].
A practical consequence of this architecture: Ensembl gives you processed, genome-aligned methylation values and regulatory context, while raw sequencing reads live at the source projects. Published studies use Ensembl in exactly this way. One analysis of colorectal cancer methylation clusters mapped significant methylation probes to Ensembl Regulatory build 89, focusing on promoter regions and bound regions, and identified 253 genes with aberrant promoter methylation across four methylation subtypes, with BMP4 as the most prominent candidate [2]. Another integration of 104 studies on microRNA epigenetics used Ensembl, together with CpG island and transcription factor binding site resources, to build a regulatory atlas for the miR-34 gene family, which was silenced by DNA methylation in the highest number of cancer types among 158 methylation-regulated human miRNAs [3].
Terms You Need Before Clicking Anything
DNA methylation is the addition of a methyl group to cytosine, in vertebrates almost always at a cytosine followed by guanine, written CpG. It is a stable but reversible epigenetic mark that influences gene expression without changing the DNA sequence.
CpG island is a stretch of DNA with high GC content and a high observed to expected ratio of CpG dinucleotides. Promoter CpG islands are the classic substrate for aberrant hypermethylation in cancer and for tissue-specific silencing.
Bisulfite sequencing is the reference measurement method. Sodium bisulfite converts unmethylated cytosines to uracil while methylated cytosines survive, so readout after sequencing gives methylation per site. Reduced representation bisulfite sequencing, or RRBS, enriches for CpG-rich fragments to keep costs down.
Percent methylation, also called a beta value, is the fraction of reads that appear methylated at a given CpG. The standard estimate is:
beta = methylated reads / (methylated reads + unmethylated reads)A beta of 0.85 means roughly 85 percent of molecules at that CpG carry the methyl mark in that sample.
Ensembl release is the version number of the database. Releases update every few months, and regulation data, gene models, and even coordinates can shift between releases. Published work often names its release explicitly. One long-read isoform survey, for example, notes that Ensembl v109 annotates roughly 252,798 distinct RNA isoforms over 62,710 gene bodies [4], and a heart failure lncRNA study cross-referenced its transcripts against Ensembl release 73 on genome reference build GRCh37 [5]. Citing your release number makes your work reproducible.
A Step by Step Ensembl Genome Browser Tutorial for Methylation Data
This is the fastest route for most readers. The goal here is to view methylation signal over a promoter region of interest. The example uses BRCA1. Coordinates change between releases, so always confirm them on the gene page rather than trusting a guide, including this one.
- Open www.ensembl.org. On the home page, select Homo sapiens and confirm the assembly reads GRCh38. If you need the older GRCh37 assembly, go to grch37.ensembl.org instead, which serves archived releases such as the release 73 build used in published lncRNA analyses [5].
- Type a gene symbol, for example BRCA1, into the search box and press enter. Ensembl returns a list of matching genes across species and assemblies. Click the human BRCA1 entry under GRCh38.
- On the gene page, scroll to Region in detail and click the region link, or use the Location tab. On chromosome 17 in GRCh38, BRCA1 sits at roughly 17:43,044,295 to 43,125,482 on the minus strand, so its promoter lies to the right of the gene body in the default view.
- Click Configure this page in the left-hand menu. A panel opens with track categories such as Sequence and regulatory features, Variation, and Comparative genomics.
- Under Sequence and regulatory features, switch on:
- Methylation (ENCODE), the percent methylation signal track
- Regulatory Build, the merged regulatory features
- CpG islands, the GC-rich island annotation
- Click the check mark to save and redraw. The main panel now shows, from top to bottom, transcripts, the regulatory build blocks, methylation histograms, and CpG island bands.
- Zoom to the promoter. Type a narrower range into the jump-to box, for example 17:43065000-43075000, or drag-select with the mouse. Expected output at this zoom: a dense stack of colored methylation blocks over the promoter CpG island, each color representing one assayed cell type or cell line, with block height proportional to percent methylation from 0 to 100 percent. Fully unmethylated active promoters sit near the baseline. Hypermethylated cancer-associated promoters read high across most cell types.
- Click any methylation block. A popup reports the cell type, the assay, and the methylation value at that position. This is how you answer the question that draws people to the track in the first place: is this specific CpG methylated in a specific cell context.
- To keep the view, click Export data in the left-hand menu. You can save the region as a BED or GFF file of the displayed features, or as an image for a figure.
For mouse, the workflow is identical: select Mus musculus, confirm the current GRCm assembly, and configure the same regulatory and methylation tracks. Ensembl maintains these regulation resources for human and mouse specifically [1].
Pulling the Same Data with the REST API
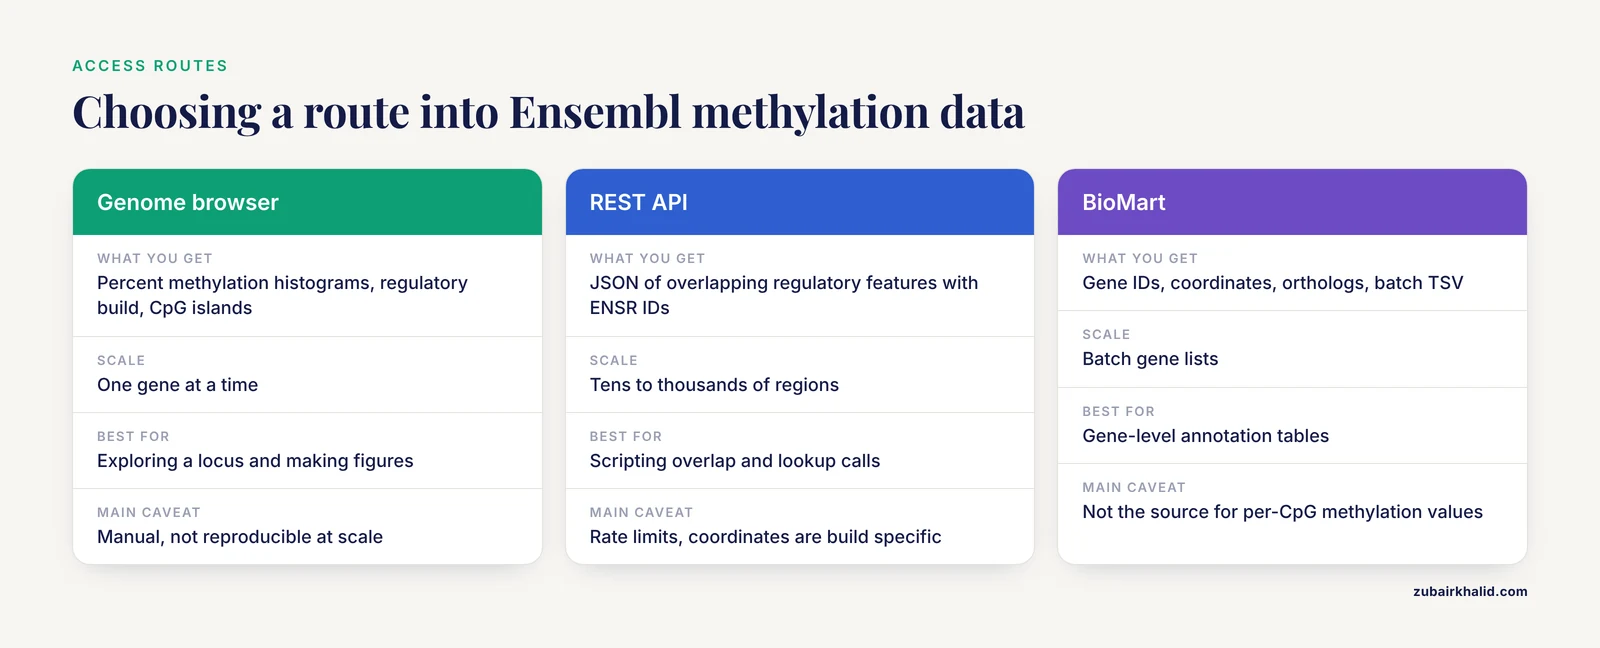
The graphical view does not scale. If you need methylation context for 50 genes or 50,000 probes, script it. Ensembl exposes all of its data through REST endpoints as well as Perl and REST APIs [1].
Regulatory features overlapping a region come from the overlap endpoint:
curl -s "https://rest.ensembl.org/overlap/region/human/17:43070000-43072000?feature=regulatory_feature" \
  -H "Content-Type: application/json"
Expected output is a JSON array. Identifiers and coordinates below are illustrative, your call will return the features that actually overlap your coordinates in the current release:
[
  {
    "assembly_name": "GRCh38",
    "end": 43071520,
    "feature_type": "regulatory_feature",
    "id": "ENSR0000XXXXXX",
    "start": 43070211,
    "strand": 1
  }
]
Each regulatory feature carries a stable Ensembl ID beginning with ENSR. To see which epigenomes contributed to a feature and its activity state, follow with the regulatory feature lookup endpoint:
curl -s "https://rest.ensembl.org/regulatory/homo_sapiens/ENSR0000XXXXXX?content-type=application/json"Practical notes for scripting:
- Set a User-Agent header with your contact email when you batch query. Ensembl applies rate limits and asks heavy users to identify themselves. Add a short sleep between calls.
- HTTP status 400 with a JSON body containing an
"error"key means your request was malformed, most often a coordinate outside the assembly or a wrong build. HTTP 429 means you hit the rate limit, back off and retry. - Coordinates are always assembly specific. A REST call against GRCh38 returns GRCh38 coordinates, nothing else.
Querying the Public MySQL Server
Ensembl runs a public MySQL database server at ensembldb.ensembl.org, and all regulation data are freely available through it [1]. Regulation tables live in the funcgen database family. Database names carry the release and assembly, for example homo_sapiens_funcgen_112_38, so first list what is available:
mysql -u anonymous -h ensembldb.ensembl.org -e "SHOW DATABASES LIKE 'homo_sapiens_funcgen%'"Expected output looks like this, with the numbers tracking the current release:
+---------------------------------------+
| Database (%homo_sapiens_funcgen%)     |
+---------------------------------------+
| homo_sapiens_funcgen_112_38           |
| homo_sapiens_funcgen_111_38           |
| homo_sapiens_funcgen_110_38           |
+---------------------------------------+
Then query regulatory features in a coordinate window. This example pulls features on chromosome 17 between 43,070,000 and 43,072,000, joining the feature type table to get readable names:
mysql -u anonymous -h ensembldb.ensembl.org -e "
SELECT f.stable_id, t.name AS feature_type, f.start, f.end
FROM homo_sapiens_funcgen_112_38.regulatory_feature f
JOIN homo_sapiens_funcgen_112_38.feature_type t
  ON f.feature_type_id = t.feature_type_id
WHERE f.seq_region_id = (
  SELECT seq_region_id
  FROM homo_sapiens_core_112_38.seq_region
  WHERE name = '17'
)
AND f.start BETWEEN 43070000 AND 43072000"
Expected output is a table of ENSR identifiers with feature types such as enhancer, promoter, promoter flanking region, CTCF binding site, and open chromatin, plus their start and end coordinates:
+-----------------+----------------+----------+----------+
| stable_id       | feature_type   | start    | end      |
+-----------------+----------------+----------+----------+
| ENSR0000XXXXXX  | Promoter       | 43070211 | 43071520 |
| ENSR0000YYYYYY  | Enhancer       | 43071805 | 43072010 |
+-----------------+----------------+----------+----------+
Two cautions apply. First, release numbers in the database names change every cycle, so hardcoding 112 guarantees eventual breakage, either through the exact MySQL error ERROR 1049 (42000): Unknown database 'homo_sapiens_funcgen_112_38' or through silent schema drift. Resolve the current release programmatically or check the Ensembl release page. Second, the funcgen tables give you regulatory features and their epigenome assignments. The per-CpG percent methylation histograms are rendered by the website from source project data, so for bulk methylation values you will usually combine Ensembl regulatory context with signal files from the originating epigenomics projects.
BioMart and biomaRt for Batch Annotation
BioMart is Ensembl's web query builder, and biomaRt is its R interface. Published work relies on both for pulling Ensembl data into pipelines. One comparative brain study used the biomaRt package against the BioMart Ensembl website to acquire orthologous genes across species before epigenomic modeling [6].
Web BioMart, step by step:
- Click BioMart on any Ensembl page, or go to the BioMart section of ensembl.org.
- Choose Dataset, then Ensembl Genes, then Homo sapiens genes.
- Under Filters, open REGION and enter chromosome, start, and end, for example chromosome 17, 43,044,295 to 43,125,482.
- Under Attributes, expand GENE, then EXTERNAL, and tick stable ID, chromosome name, start, end, strand, and gene name.
- Click Results and export as TSV or copy the generated URL for reuse in scripts.
In R, the same query reads:
library(biomaRt)
ensembl <- useEnsembl(biomart = "genes", dataset = "hsapiens_gene_ensembl")
brca1 <- getBM(
  attributes = c("ensembl_gene_id", "chromosome_name",
                 "start_position", "end_position", "strand"),
  filters    = c("hgnc_symbol"),
  values     = "BRCA1",
  mart       = ensembl
)
print(brca1)
Expected output is a one-row data frame with the Ensembl gene ID, coordinates, and strand. Use these coordinates as input to the REST or MySQL steps above to fetch overlapping regulatory features, or feed them into a CpG island overlap analysis.
A practical division of labor: BioMart and biomaRt excel at gene-level annotations and IDs. Methylation-specific objects, the regulatory build and its epigenome assignments, come more cleanly from the browser export, REST, or funcgen tables.
FTP Downloads and Working Across Builds
For bulk access, the Ensembl FTP server at ftp.ensembl.org hosts per-release files, including regulation data under the regulation folder of each release directory. Regulatory build features and transcription factor binding sites download as GFF or similar tab-delimited formats that load directly into command line tools like bedtools for intersection with your own methylation peak or probe coordinate files.
Genome build drift is the single most consequential issue here. Reference coordinates are not interchangeable. If your methylation beta values or array probe positions were mapped to GRCh37, and you query Ensembl against GRCh38, you will look up the wrong positions. Two fixes exist:
- Use the dedicated GRCh37 archive at grch37.ensembl.org, which serves older releases on the old assembly, matching workflows anchored to releases such as release 73 [5]
- Lift coordinates between builds with an assembly converter or a chain-based tool before querying, then verify at least a handful of converted loci by eye in both browsers
The same discipline applies to non-human work. Ensembl Plants serves plant genomes and supported a recent identification of 35 maize Snf2-family chromatin remodeling genes with roles in abiotic stress response [7], and WormBase ParaSite, developed in collaboration with Ensembl Genomes, serves over 100 helminth species with multiple genome browsers and programmatic interfaces [8]. Gene and protein data for these species flow freely. Regulation resources with methylation signal tracks, in contrast, remain concentrated on human and mouse [1]. For non-model organisms, methylation questions usually require pulling CpG island or promoter sequences from Ensembl and taking them to species-specific methylation datasets or your own bisulfite data.
Worked Example: Connecting Ensembl Methylation Data to a Published Question
Suppose you read the colorectal cancer methylation study and want to examine BMP4 promoter methylation yourself [2]. The published workflow mapped significant methylation probes from genome-wide clustering onto Ensembl Regulatory build 89, restricted attention to probes falling in promoter or bound regions, and intersected methylated promoters across CIMP-high, CIMP-low, and two additional methylation clusters, yielding 253 candidate genes led by BMP4 [2].
To redo the Ensembl side of that workflow on the current release:
- Search BMP4 at www.ensembl.org and confirm the GRCh38 entry. Open Region in detail.
- Enable Methylation (ENCODE), Regulatory Build, and CpG islands as described above.
- Zoom to the promoter, upstream of the gene's first coding exon. In normal colorectal mucosa-derived contexts you expect an unmethylated promoter CpG island, and in CIMP-high tumor contexts you expect high methylation signal in the matching tumor datasets.
- Export the regulatory features over the promoter with Export data, or with the REST overlap call, and save the ENSR identifiers.
- Map your methylation array probe coordinates, from the platform manifest, against those regulatory features using bedtools intersect.
- Note that the published analysis used Regulatory build 89 [2]. Regulatory build content grows between releases as Ensembl expands its library of measured samples [1], so expect some features to be added or refined relative to build 89. Record your release number either way.
The miR-34 case shows the same pattern at a smaller scale. The miR-34a gene sits on chromosome 1p36 and the miR-34b and miR-34c genes sit on chromosome 11q23. The integrated analysis behind the miR-34 regulatory atlas used Ensembl alongside miRBase, TargetScan, MethPrimer, and other tools to assemble CpG island, transcription factor binding, and genetic variability context around these promoters [3]. In Ensembl you would search the miR-34a host region, turn on CpG island and methylation tracks, and export the promoter CpG island sequence for bisulfite PCR primer design with a tool such as MethPrimer, which is exactly how the original study combined these resources [3].
The biological payoff of methylation data retrieval is real. In a large community-based autopsy cohort, brain DNA methylation analyses were carried out in a subset of 225 individuals with both ex vivo MRI and methylation data, part of a study linking gene expression, methylation, and MRI transverse relaxation measures to late-life cognitive decline [9]. Every such analysis begins with the same first step this article teaches: anchoring methylation measurements to a consistent genome annotation.
Quick Reference: Ways to Access Ensembl Methylation and Regulatory Data
| Access method | Where | What you get | Best for | Main caveat |
|---|---|---|---|---|
| Genome browser tracks | ensembl.org, Configure this page | Percent methylation histograms, regulatory build, CpG islands, per-cell-type popups | Exploring one gene, figures | Manual, not reproducible at scale |
| Export data menu | Location page, left menu | BED, GFF, or image of the current view | Quick regional exports | Region limited |
| REST API | rest.ensembl.org overlap and lookup endpoints | JSON of overlapping regulatory features with ENSR IDs | Scripting tens to thousands of regions | Rate limits, coordinates are build specific |
| Public MySQL | ensembldb.ensembl.org, funcgen databases | Regulatory features, feature types, epigenome assignments, full SQL flexibility | Bulk joins with your own data | Release-numbered database names change |
| BioMart and biomaRt | ensembl.org BioMart, biomaRt in R | Gene IDs, coordinates, orthologs, batch TSV | Gene-level annotation tables | Not the source for per-CpG methylation values |
| FTP | ftp.ensembl.org regulation folder | Bulk regulatory build files per release | Pipelines, bedtools intersection | Check the folder contents for each release |
Ensembl DNA Methylation Data Tips
Layer tracks before interpreting. A methylation histogram alone tells you little. Turn on transcripts, CpG islands, and the regulatory build together. A highly methylated block inside a promoter CpG island overlapping a regulatory feature means something. The same block in a gene desert may not.
Read the popup, not just the color. Each methylation block carries the cell type and assay in its popup. Two adjacent blocks with different colors come from different cell types, and comparing them is the entire point of the track.
Record the release and the build in your notebook. Write down the release number shown in the page footer and the assembly name. Regulatory build 89 and release 73 on GRCh37 are real anchors from published studies, and your own reproduction should be anchored the same way.
Use VEP to connect methylation context to variants. The Ensembl Variant Effect Predictor annotates variants against regulatory and other functional features, and published association work uses VEP alongside tools like RegulomeDB and HaploReg for functional annotation of candidate polymorphisms [10]. If your methylation question eventually becomes a variant question, VEP is the bridge.
Export sequences for primer design. From any region view you can export the underlying sequence. CpG island sequences exported from Ensembl feed directly into bisulfite PCR primer design, as the miR-34 atlas workflow demonstrates with MethPrimer [3].
Complement Ensembl with other portals when useful. Ensembl and the UCSC Genome Browser carry overlapping but not identical annotations, and some published analyses pull CpG island definitions from UCSC while taking expression or sequence data from Ensembl [11]. Cross-checking one or two loci in both browsers is cheap insurance.
Prefer processed coordinate-anchored data from Ensembl, raw reads from source projects. Ensembl's strength is integration, a central and easy-to-query repository of reference epigenomes [1]. For raw bisulfite reads, go to the originating project's data portals and align them yourself.
Common Mistakes and Limitations
Searching for methylation tracks in the wrong species. The most common dead end is opening a zebrafish, maize, or helminth genome and looking for methylation histograms. The regulation resources with DNA methylation cover human and mouse [1]. Ensembl Plants and Ensembl Genomes partners serve gene, protein, and comparative data for many other species, as maize Snf2-family work [7] and helminth genomics [8] illustrate, but they do not carry the human-style methylation tracks.
Confusing CpG islands with methylation measurements. The CpG island track is a sequence-derived prediction. It will show you where methylation could act, never whether methylation is present. The Methylation (ENCODE) track is the measurement. If you report "hypermethylation" based only on a CpG island annotation, you have reported nothing about methylation.
Mixing genome builds. GRCh37 and GRCh38 coordinates differ for most loci, sometimes by hundreds of kilobases. Symptoms of this mistake include a methylation track that looks empty over your region of interest, or regulatory features that sit in a neighboring gene. Always match the build of your input coordinates to the build you query, using grch37.ensembl.org or a coordinate lift as needed.
Hardcoding release numbers. Database names like homo_sapiens_funcgen_112_38 and REST response fields shift across releases. Script against the current release resolved at runtime, or your pipeline will break at the next Ensembl update. Annotation scale also grows between releases, as the jump to roughly 252,798 annotated isoforms across 62,710 gene bodies in v109 shows [4], so old and new releases are not simply interchangeable.
Treating percent methylation as a pure binary state. Beta values near 0.5 are common and biologically meaningful, partial methylation at single CpGs is the norm rather than noise, and bisulfite conversion never reaches exactly 100 percent. Avoid declaring a CpG "methylated" or "unmethylated" from a single track value without considering assay precision and sample heterogeneity.
Ignoring cell type specificity. The methylation tracks summarize specific cell lines and cell types, weighted toward well-studied lines as Ensembl builds out its sample library [1]. A promoter unmethylated in every displayed cell type can still be methylated in a tumor or a tissue absent from the panel. Absence of signal in the track is absence of assayed data for that context, not proof of absence in biology.
Forgetting strand and promoter direction. Many genes sit on the minus strand. If you zoom to "upstream" in default orientation for a plus-strand gene but your gene is minus strand, you have walked into the gene body. Check the strand arrow on the gene view before interpreting promoter methylation.
Skipping the validation step. Before trusting any derived table, verify three loci by hand: open the coordinates in the browser, confirm the methylation block and regulatory feature you claim are actually there, and confirm the build label on the page. Five minutes of manual checking catches most export errors.
One framing limitation applies to everything above: Ensembl methylation resources describe genome biology at the sample and cell line level, and they cannot by themselves answer whether methylation matters in a specific patient, tissue, or experiment. That requires your own measurements analyzed against these annotations.
Frequently Asked Questions
Which species have DNA methylation data in Ensembl?
Human and mouse carry the regulation resources, including DNA methylation, epigenetic marks, and transcription factor binding [1]. Other species in Ensembl, Ensembl Plants, and Ensembl Genomes partners provide gene and sequence data but not these methylation tracks.
Is the methylation data in Ensembl raw or processed?
It is processed, genome-aligned percent methylation integrated from large epigenomics projects and rendered as browser tracks [1]. Raw bisulfite sequencing reads remain with the originating projects.
How do I find methylation data on the old GRCh37 build?
Use the dedicated archive site at grch37.ensembl.org, which serves historical releases on GRCh37, the assembly underlying older releases such as release 73 [5].
Can I download methylation percent values as a bulk file?
Regulatory build features download in bulk from the Ensembl FTP regulation folder and the public MySQL funcgen databases [1]. The per-CpG methylation histograms are website-rendered signal, so bulk percent methylation values usually come from the source epigenomics projects, combined with Ensembl's regulatory annotations.
Why does the methylation track look empty over my gene?
The most likely causes are a genome build mismatch, the track not being enabled under Configure this page, or no assayed cell type overlapping your exact coordinates. Confirm the build, re-enable the track, and zoom out slightly to check assay coverage.
What is the difference between CpG island tracks and methylation tracks?
CpG island tracks are sequence-based predictions of CpG-rich DNA, showing where methylation can occur. Methylation tracks show measured percent methylation per CpG or region in specific cell types. Both appear on the same Ensembl region view but answer different questions.
Can I work with Ensembl methylation and regulatory data in R?
Yes. The biomaRt package queries Ensembl BioMart for gene coordinates and annotations [6], and the REST API returns regulatory features as JSON that R handles natively. Combine the two to build a full scripted workflow.
How do I cite Ensembl data in my paper?
Record the Ensembl release number, the assembly, and the date accessed, and cite the Ensembl regulation resources paper for methylation and regulatory build data [1]. Published analyses typically name the exact build used, as in Regulatory build 89 for a colorectal cancer methylation mapping study [2].
Sources
- Ensembl regulation resources.
- In Silico Gene Prioritization Highlights the Significance of Bone Morphogenetic Protein 4 (BMP4) Promoter Methylation across All Methylation Clusters in Colorectal Cancer.
- Data integration of 104 studies related with microRNA epigenetics revealed that miR-34 gene family is silenced by DNA methylation in the highest number of cancer types.
- A bioinformatic survey of RNA isoform diversity and expression across 9 GTEx tissues using long-read sequencing data.
- Right ventricular long noncoding RNA expression in human heart failure.
- Human-specific protein-coding and lncRNA genes cast sex-biased genes in the brain and their relationships with brain diseases.
- Exploring the Roles of the Swi2/Snf2 Gene Family in Maize Abiotic Stress Responses.
- Using WormBase ParaSite: An Integrated Platform for Exploring Helminth Genomic Data.
- Association Between Brain Gene Expression, DNA Methylation, and Alteration of Ex Vivo Magnetic Resonance Imaging Transverse Relaxation in Late-Life Cognitive Decline.
- Association of FKBP5 gene polymorphism with insomnia symptoms in the depressive episodes of stress-related bipolar disorder.
- Impact of GC content on gene expression pattern in chicken.