How to Fix Common clusterProfiler Errors
By Dr. Zubair Khalid, DVM, MS, PhD ·

The single most common cause of clusterProfiler failures is a mismatch between the gene identifiers you feed the package and the identifiers in the annotation database behind it. The package expects, by default, Entrez Gene IDs for most enrichment functions, and nearly every mysterious empty result, mapping warning, or cryptic error traces back to that mismatch, a wrong organism setting, or a stale package installation. The published workflows that use clusterProfiler for over-representation analysis (ORA) and gene set enrichment analysis (GSEA) all begin with verified identifier handling before any statistical test is run, and your troubleshooting should follow the same order [1], [2].
clusterProfiler is the workhorse package in R for bioinformatics enrichment analysis. It powers functional interpretation across transcriptomics, proteomics, and metabolomics studies, from mosquito insecticide-resistance transcriptomes to quantitative proteomics pipelines [3], [2], [4]. Because so many different fields depend on it, the package has accumulated a well-known set of failure modes. This guide walks through each one, from the most frequent to the rarest, explains why it happens, and gives you a concrete fix.
A Five-Minute Diagnostic Sequence for clusterProfiler Errors
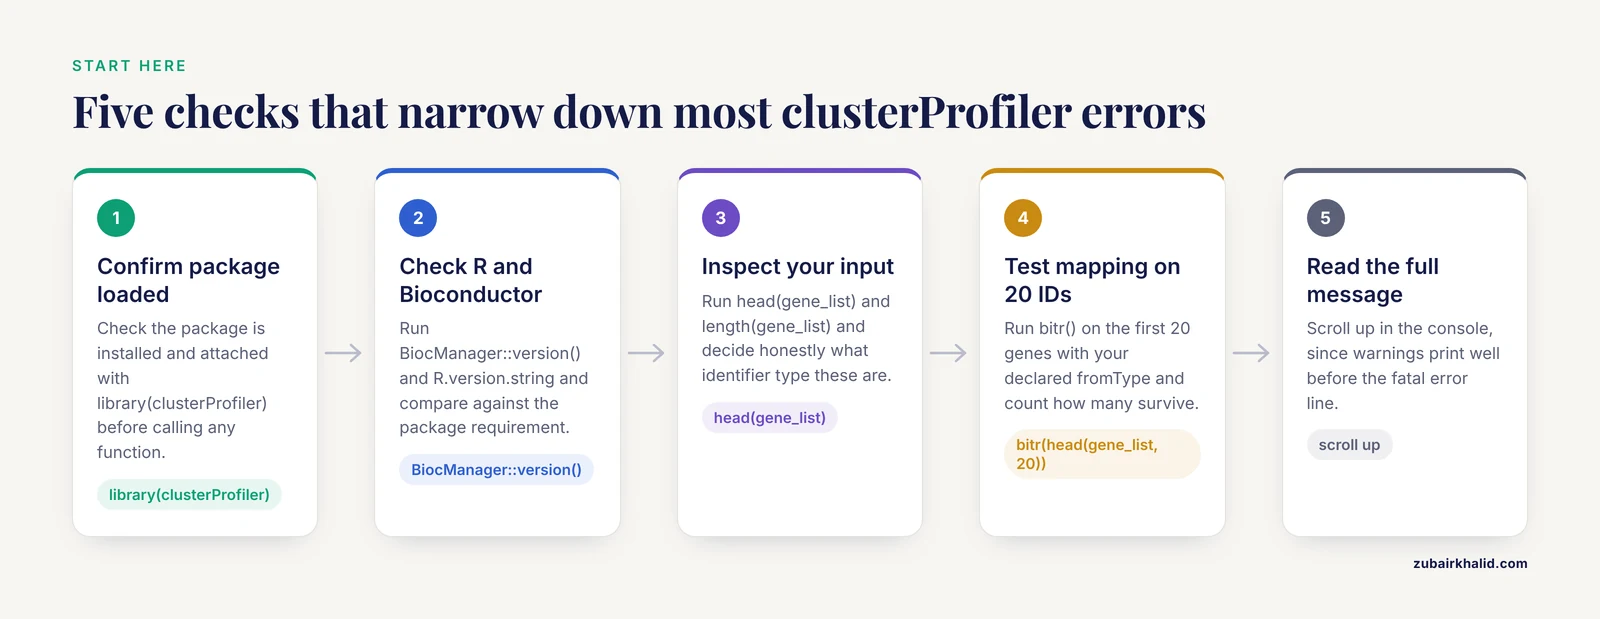
Before you touch any single error, run this short sequence. It resolves or narrows down more than half of all clusterProfiler problems.
- Confirm the package actually loaded. Run
"clusterProfiler" %in% rownames(installed.packages())and thenpackageVersion("clusterProfiler"). If the function error sayscould not find function, the package was never attached withlibrary(clusterProfiler). - Check your Bioconductor and R versions. Run
BiocManager::version()andR.version.string. A package built for one Bioconductor release will misbehave or refuse to load under another. - Inspect the first few elements of your input. Run
head(gene_list)andlength(gene_list). Ask yourself honestly what identifier type these are. Symbols, Ensembl IDs, RefSeq transcripts, and UniProt accessions all look plausible and all behave differently. - Test the mapping on a small subset. Run
bitr(head(gene_list, 20), fromType = "YOUR_ID_TYPE", toType = "ENTREZID", OrgDb = org.Hs.eg.db)and look at how many IDs survive. - Look at the full error message, not just the last line. clusterProfiler and its dependencies print warnings well before the fatal error. Scroll up in the console.
Write down what step 3 and step 4 show. Almost every error category below is diagnosed by one of those two checks.
clusterProfiler Errors Troubleshooting Table
This table covers the errors you will meet most often. Detailed causes and fixes follow in the sections below.
| Symptom | Likely cause | How to confirm | Fix |
|---|---|---|---|
| Warning that a percentage of input gene IDs fail to map | Input identifier type does not match the OrgDb | Run bitr() on 20 IDs and count survivors | Set the correct fromType and the correct organism database |
| "No gene can be mapped" or zero enrichment terms | Wrong organism, wrong ID space, or empty input after filtering | head() your input and compare against a known gene | Correct the OrgDb or organism argument |
could not find function "enrichGO" | Package installed but not attached, or not installed | %in% rownames(installed.packages()) check | library(clusterProfiler) or install it |
| "package or namespace load failed" with a version requirement | Bioconductor or R version mismatch | Compare BiocManager::version() with the requirement in the message | Upgrade R and Bioconductor together |
enricher_internal complains about terms | Malformed or empty TERM2GENE table | str() the table, check it has term and gene columns | Rebuild the table in the same ID space as your input genes |
| KEGG download or "not able to attach" errors | Network or API interruption, or wrong organism code | search_kegg_organism() for your species | Retry later, verify the three or four letter KEGG code |
| GSEA complains about duplicate names in the ranked list | Ties or duplicated gene identifiers in the named vector | anyDuplicated(names(geneList)) | Collapse duplicates, keep one value per gene |
| GSEA warning about ties in the preranked statistics | Discrete scores, such as many identical fold changes | table() the statistic | Use a continuous ranking metric or break ties |
| No significant terms after a correct run | Small gene list, oversized background, or strict cutoff | Inspect p.adjust range in the result object | Adjust cutoffs, review the background gene universe |
gseGO or GSEA() rejects the gene list | Ranked vector is not sorted or is not numeric-named | is.numeric(), names(), check order | sort(decreasing = TRUE) a named numeric vector |
| Plotting functions fail on a result object | Result object created by an older package version | class() of the object | Rerun the analysis in the current version |
Error: cannot allocate vector of size ... | Memory exhaustion, often from largeTERM2GENE tables or many parallels | gc(), check object sizes | Reduce input size, close other sessions, use a larger machine |
Error 1: Gene Identifier Mapping Failures
This is the error you will hit first, and you will hit it repeatedly across projects. The message usually appears as a warning from bitr(), the built-in ID converter, stating that some or most of your input gene IDs failed to map. In severe cases the follow-on enrichment function reports "No gene can be mapped" and stops.
The mechanism. Every enrichment database, whether GO, KEGG, or a custom gene set, is keyed to one specific identifier space, almost always Entrez Gene IDs, which are numeric identifiers maintained by NCBI. clusterProfiler asks you to declare your input type through arguments such as keyType in enrichGO() or fromType in bitr(). If you declare the wrong type, the database lookup returns nothing. The failure is silent in the sense that the code keeps running, then collapses downstream with a confusing message.
The three most common variants.
- You pass gene symbols to a function expecting Entrez IDs without setting
keyType = "SYMBOL". Fix it either by converting first withbitr()or by declaring the type in the enrichment call. - You use Ensembl gene IDs, which look like
ENSG00000141510, and assume they are symbols. They are not, and the mapping fails almost completely. - You use the wrong species database. Mouse symbols frequently match human ones, so a mouse dataset against
org.Hs.eg.dbmaps partially and produces plausible-looking but wrong results. Partial mapping is more dangerous than total failure because it hides the error.
The fix. Always convert to Entrez IDs at the start of the script, once, and carry those IDs through the rest of the analysis. This is standard practice in the published clusterProfiler workflows for proteomics and metabolomics, where authors convert their feature identifiers before ORA and GSEA [2], [4].
library(clusterProfiler)
library(org.Hs.eg.db)

gene_map <- bitr(gene_symbols, fromType = "SYMBOL",
                 toType = "ENTREZID", OrgDb = org.Hs.eg.db)
head(gene_map)
Read the mapping report line that bitr() prints. If more than a small fraction of IDs fail, stop and investigate your input rather than pushing forward. For proteomics data, remember that you usually start from UniProt or protein identifiers and may need an extra conversion step to gene level before enrichment [2].
Error 2: "could not find function" and Installation Failures
Two distinct problems hide behind this message. First, the package may be installed but never attached. R does not load packages automatically. Run library(clusterProfiler) before calling any function. Second, the package may never have installed, often because it lives on Bioconductor rather than CRAN and someone tried install.packages() alone.
The harder version of this error is a load failure with a version demand in the message, something like a namespace requiring a newer dependency than the one installed. This happens when R or Bioconductor is partially upgraded. clusterProfiler sits high in a dependency tree that includes AnnotationDbi, DOSE, and ggplot2 family packages, so a mismatch anywhere breaks the load.
The fix.
if (!require("BiocManager", quietly = TRUE))
    install.packages("BiocManager")
BiocManager::install("clusterProfiler")
If versions conflict, upgrade R itself to the current release, then reinstall Bioconductor packages in a fresh session. A Bioconductor tutorial workflow always pins one R version to one Bioconductor release, and mixing releases across a project is the leading cause of "it worked last month" failures in R for bioinformatics generally.
A short safety note applies here. Install packages from CRAN or Bioconductor only, and be cautious with scripts downloaded from third-party repositories, since install scripts execute arbitrary code on your machine. Working with clinical omics data also carries a privacy hazard, so de-identify sample metadata before it ever reaches an analysis script.
Error 3: "No gene can be mapped" and Empty Enrichment Results
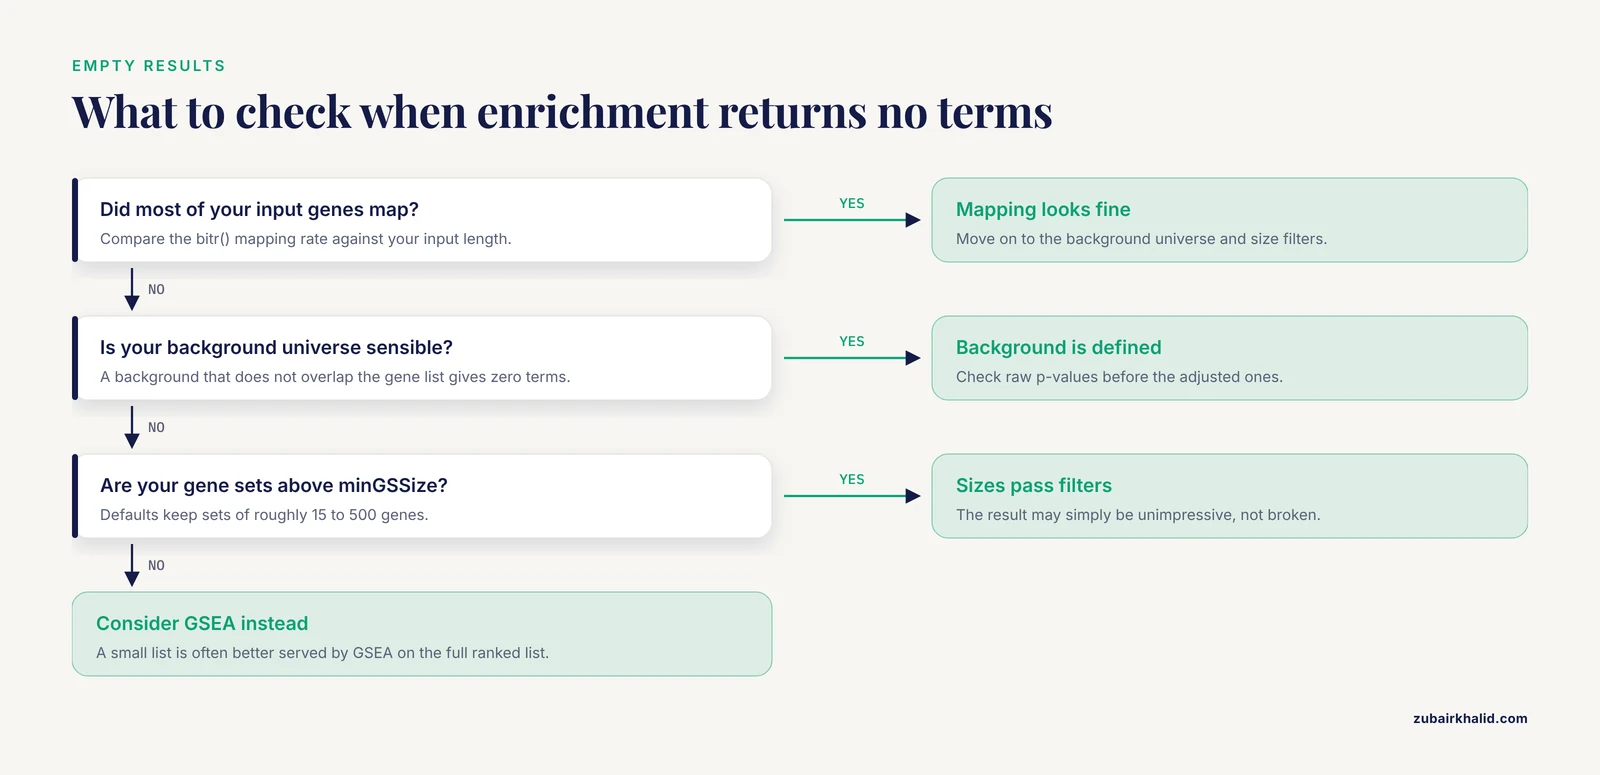
When enrichGO(), enrichKEGG(), or enricher() returns an object whose result slot has zero rows, three causes dominate.
Cause one, the wrong universe. The background gene universe is the set of genes you declare as tested. If your background is huge and your gene list is small, few terms reach significance. If you pass a background that does not overlap your gene list at all, you get zero terms. Inspect the result object directly with head(res@result) or as.data.frame(res) and look at the raw p-value column before the adjusted one. Raw p-values that look reasonable but adjusted values near 1 point to a background problem.
Cause two, size filters. clusterProfiler filters gene sets by size before testing. The defaults keep sets with roughly 15 to 500 genes, controlled by minGSSize and maxGSSize. If your custom gene sets are all smaller than the minimum, everything gets filtered and the function reports that no terms were tested. Lower minGSSize deliberately, with a stated reason, when you have a legitimate small gene set.
Cause three, a gene list that shrank to nothing. The package drops input genes it cannot map before testing. If mapping failed for 90 percent of your input, what remains may be too few to test anything. Go back to Error 1.
Empty results are not always errors. Recent applications show that conventional pathway enrichment genuinely returns little for some datasets, for example compounds with few differentially expressed genes in a toxicogenomics study, where the authors turned to complementary methods to recover signal [5]. If your biology is real but your list is small, consider GSEA on a full ranked list rather than ORA on a short gene list, which uses the ranking information you would otherwise discard [1], [2].
Error 4: OrgDb and Unsupported Organism Errors
Errors mentioning OrgDb, such as an object not being found or a species argument being wrong, come from the annotation layer. The OrgDb objects, like org.Hs.eg.db for human and org.Mmus.eg.db for mouse, are Bioconductor annotation packages and must be loaded with library() before use, not merely named as text.
Common triggers:
- Passing the string
"org.Hs.eg.db"instead of the loaded object. - Using legacy short organism arguments, such as
"human"versus the specific database object, in functions that expect one form. - Working on a non-model organism for which no OrgDb exists.
For non-model species, the standard solution is to build your own term-to-gene table and use enricher() and GSEA() with TERM2GENE. This is exactly how researchers handle species outside the standard annotation set. The ShEnrich platform for penaeid shrimp, for example, constructed GMT-format gene set libraries from BLAST, InterProScan, and eggNOG-mapper annotations and ran GO and KEGG enrichment through clusterProfiler, because generic model-organism tools offered no coverage for those species [6]. The same pattern applies to any organism. Build a two-column data frame of term ID and gene ID, in the same identifier space as your gene list, and pass it in:
ewp <- enricher(gene = my_entrez_ids,
                TERM2GENE = term2gene_df,
                TERM2NAME = term2name_df,
                pAdjustMethod = "BH")
The error enricher_internal: no term provided almost always means this table is empty, has the columns in the wrong order, or the gene column is in a different ID space than your input.
Error 5: KEGG Online and Download Errors
enrichKEGG() queries the KEGG database over the network the first time it needs a species, then caches the result. Failures here look like download errors, timeouts, or messages about being unable to attach or parse KEGG data.
Diagnose in this order. First, verify the organism code with search_kegg_organism(). KEGG uses three or four letter codes such as hsa for human, and a wrong code produces confusing downstream failures. Second, check your network, since institutional proxies and captive portals interrupt the KEGG REST service. Third, note that KEGG restricts some access, and heavy repeated queries can be throttled, so retry after a pause rather than in a tight loop.
When the network is the problem, the fix is patience plus caching. Once a successful run has cached the species data, later calls work offline in the same session. If KEGG access is chronically unreliable in your environment, switch to a locally maintained gene set table through TERM2GENE, as the shrimp platform did with its own KEGG libraries [6]. Many published pipelines deliberately keep enrichment database versions fixed on disk so results stay reproducible [2].
Error 6: GSEA-Specific Errors
GSEA in clusterProfiler tests a full ranked list of genes rather than a short list of significant ones, which makes its error modes different from ORA. The published quantitative proteomics workflow treats ORA and GSEA as complementary steps and feeds each a correctly prepared input [2].
The ranked list format. gseGO(), gseKEGG(), and GSEA() require a named numeric vector, sorted in decreasing order, with gene identifiers as the names:
gene_list <- sort(de_ranked_stat, decreasing = TRUE)
head(gene_list)
gse_res <- gseGO(geneList = gene_list,
                 OrgDb = org.Hs.eg.db,
                 keyType = "ENTREZID")
Errors here include an unsorted list, names that are missing, duplicate names, and non-numeric values. Duplicate names arise when your differential expression table has one row per transcript or per probe rather than one per gene. Collapse to one value per gene, typically the statistic with the largest absolute value, before ranking.
Ties in the preranked statistics. A warning about ties appears when many genes share an identical statistic value, commonly zero, which happens when a ranking metric multiplies a log fold change by a significance measure and abundant genes round to exactly zero. Ties make the null distribution ambiguous. The honest fixes are to use a continuous metric, to jitter tied values minimally, or to accept the warning knowing its direction of bias. This is a documented behavior of the underlying algorithms, and a warning, not an error.
Gene set size complaints. Messages about gene sets being filtered follow the same minGSSize and maxGSSize logic as ORA. When running GSEA per cell type or per contrast, remember that smaller contrasts yield fewer valid sets.
Leading edge confusion. A frequent non-error complaint is that core enrichment genes seem few. Check the core_enrichment column of the result, and remember that gene sets with small sizes have unstable leading edges, a property of the method rather than a bug.
Error 7: compareCluster and Multi-List Errors
compareCluster() runs enrichment across several gene lists at once, for example across cell types or time points, and it is a mainstay of single-cell and multi-condition interpretation [7]. Its errors are composites of the errors above.
- One subgroup maps to nothing. The whole call fails or returns a partial table. Check list lengths first with
lapply(gene_lists, length)and mapping rates per group. - One subgroup is too small for any gene set to pass the size filters. Drop or merge small groups.
- Mixed identifier types across groups. This happens when each group was processed by a different upstream script. Convert everything to Entrez IDs in one place, as in Error 1.
- Plotting failures afterward, usually because the combined object mixes result classes or one group contributed zero terms.
Fix the inputs before the call, not the call itself. Convert every group through the same bitr() step, drop or merge groups below a stated minimum size, and only then run compareCluster().
Error 8: Visualization and Downstream Errors
Most plotting failures are failures of the object being plotted rather than the plotting code.
Plotting an old result object. clusterProfiler result objects are S4 classes whose internal structure can change between major versions. An object saved months ago may refuse to plot under a new version. The reliable fix is to rerun the enrichment in the current session rather than to reach into slots manually.
Gene symbol display failures. Results computed on Entrez IDs display numeric IDs by default. setReadable() converts them back, and errors here mean the keyType argument does not match the ID space actually stored in the result:
res_readable <- setReadable(res, OrgDb = org.Hs.eg.db,
                            keyType = "ENTREZID")
Network plot limitations. cnetplot() and enrichMap()-style views degrade when hundreds of terms are enriched at once. A recent protocol addresses exactly this by walking through clusterProfiler-based ORA and GSEA, computing term similarity between enriched terms, and exporting the network to Cytoscape for interactive exploration, because static R network plots provide limited exploration and customization at that scale [1]. If your network plot is unreadable or crashes on large results, exporting to Cytoscape is the supported path, not fighting the R plot.
Aesthetic overrides that break. Functions in the enrichplot package return ggplot objects, and layering custom ggplot2 code on top can conflict with internal scales. Build the default plot first, confirm it renders, then customize one layer at a time.
Error 9: Memory, Speed, and Reproducibility Problems
Large single-cell datasets strain the package. Passing tens of thousands of genes per group through compareCluster() with a large custom gene set universe can exhaust memory, producing allocation errors. Practical mitigations are to reduce the universe to genes actually expressed in the dataset, to run groups sequentially rather than in parallel, and to match the machine to the job.
Reproducibility deserves its own attention because it prevents whole classes of errors. Enrichment results change when database versions change, since gene set membership is updated continuously. Studies that treat enrichment as a formal pipeline step fix their annotation versions and record them alongside results [2], and platforms built for specific species rebuild their gene set libraries on defined annotation releases [6]. Record, at minimum, the clusterProfiler version, the annotation database and its version, the gene set version, and your background universe definition in every analysis. When an error appears months later, that record is the difference between a five-minute fix and a lost analysis.
Common Mistakes and Limitations
These are the mistakes that appear over and over in real projects.
- Trusting partial mapping. If 30 percent of your genes fail to map, the enrichment is computed on a biased subset. Genes that fail mapping are not random, and biased subsets distort results. Report the mapping rate.
- Using the wrong background universe. Passing all genes in the genome as background when you only measured expressed genes inflates significance for terms enriched among expressed genes generally. The universe should be the set of genes that could have been detected in your assay.
- Treating adjusted and raw p-values interchangeably. clusterProfiler reports multiple testing correction by default using the Benjamini-Hochberg method. Reading raw p-values from the result object and calling them significant is a genuine error, not a style issue.
- Interpreting enriched terms as mechanisms. Enrichment says which annotated gene sets are over-represented. It does not prove those pathways are activated. Recent methodological work emphasizes integrating enrichment with network and directionality information to draw mechanistic conclusions [1], [5].
- Mixing ID spaces within one analysis. Converting half your genes in one script and the other half in another produces results that look fine and mean nothing.
- Ignoring gene set size filters when they quietly change your results. The defaults exist for statistical stability, but you should know what they excluded.
- Reusing a saved result object across package versions. Rerun instead.
- Running KEGG queries in tight loops. This burdens a shared public resource and invites throttling.
One limitation belongs in its own sentence. Enrichment analysis constrains but does not determine biological interpretation, so results should be read against the experimental design and, where possible, validated by independent measurements, as the transcriptomics studies cited here do with qPCR confirmation of enriched functional themes [3].
Prevention Practices
A short prevention checklist eliminates most clusterProfiler errors before they occur.
- Standardize on Entrez IDs at the start of every project, with one documented conversion step.
- Record the organism, the annotation database, and every package version at the top of your script.
- Convert and inspect inputs once, in a dedicated section, with printed mapping rates.
- Run enrichment on a 20-gene subset first, confirm the plumbing works, then scale up.
- Define your background universe explicitly and write down why you chose it.
- Fix annotation and gene set versions per project, following the pipeline practice of reproducible proteomics workflows [2].
- Prefer
TERM2GENEtables you control for non-model organisms and for long-term reproducibility [6]. - Save scripts and session information, not just result objects, so any error can be reproduced and fixed.
Frequently Asked Questions
Why does enrichGO return no significant terms even though my genes look right?
Check three things in order. First, confirm your genes actually mapped by looking at the mapping rate from bitr(). Second, confirm your background universe is not so large that nothing stands out. Third, look at the raw p-values in the result object before the adjusted ones, since a small gene list against a broad background produces valid but unimpressive adjusted values. Small gene lists are often better served by GSEA on a full ranked list [1], [2].
How do I fix the warning that many of my gene IDs fail to map?
The warning means your declared identifier type does not match what the annotation database holds. Test 20 IDs with bitr() using each candidate fromType until the mapping rate is high. The most common confusion is passing Ensembl IDs or symbols where Entrez IDs are expected, and the second most common is using a human database for mouse data.
Why does clusterProfiler say my organism is not supported?
The built-in OrgDb annotation objects cover model organisms only. For other species, build your own term-to-gene table from annotation resources and use enricher() or GSEA() with the TERM2GENE argument. This is the established approach, used for example to bring GO and KEGG enrichment to shrimp species with no standard annotation package [6].
What does the ties warning in GSEA mean and should I worry?
The warning means many genes in your ranked list share identical statistic values, which makes the ranking order among them ambiguous. It is a warning, not an error. Reduce ties by using a continuous ranking metric, or accept the warning with the knowledge that tied genes contribute symmetrically to the statistic.
Should I use Entrez IDs or gene symbols in clusterProfiler?
Use Entrez IDs for the statistical analysis and convert back to symbols for display with setReadable(). Entrez IDs are the native key for the bundled annotation resources, they are unambiguous in a way symbols are not, and every published clusterProfiler workflow in this area converts to them before testing [1],.
Why does enrichKEGG fail with a download error?
enrichKEGG() fetches pathway data from the KEGG service over the network the first time it runs for a species. Verify your organism code with search_kegg_organism(), check your network connection, and retry after a pause. For chronically unreliable networks, maintain a local gene set table and use enricher() instead [6].
What is the difference between ORA and GSEA in clusterProfiler?
ORA takes a list of significant genes and asks which annotated gene sets are over-represented in it. GSEA takes the full ranked list of all genes and asks whether members of a gene set cluster at the top or bottom of the ranking. They are complementary, and many published pipelines run both on the same dataset [1], [2].
How do I update clusterProfiler without breaking my scripts?
Upgrade R and Bioconductor together in a fresh session, reinstall clusterProfiler and its dependencies with BiocManager::install(), then rerun your analysis from raw inputs rather than reloading saved result objects, because result object internals can change between versions. Pin the new versions in your script header so the change is recorded.
Sources
- Enhancing Interpretation of Functional Enrichment Analysis Results with Advanced Network Visualizations.
- Computational and Statistical Framework for Quantitative Proteomics Analysis.
- Transcriptome Analysis of Deltamethrin Resistance Mechanisms in Aedes aegypti Populations from Metro Manila, Philippines.
- Multi-Omics Guided Pathway and Network Analysis of Clinical Metabolomics and Proteomics Data.
- Multimodal cheminformatic and network biology analysis enables deeper mechanistic understanding of PFAS-induced hepatotoxicity.
- ShEnrich: a functional annotation database and enrichment platform for penaeid shrimp.
- Proteomic analysis of pancreatic endocrine cells by mechanistic single-cell isolation identifies membrane pathways.