Chimera for Protein Structure: Step-by-Step Guide
By Dr. Zubair Khalid, DVM, MS, PhD ·

By the end of this guide you will be able to open a protein structure in UCSF ChimeraX, style it into a publication-quality figure, load and interpret an AlphaFold prediction, measure distances and interface areas, and assemble a visualization of a chimeric fusion protein from two parent structures. Everything here runs on a standard desktop computer. You need ChimeraX installed, an internet connection for fetching structures, and optionally a UniProt accession number for the protein you work on.
The word "chimera" carries two meanings in this field, and the search term "chimera for protein structure" sits exactly at their intersection. UCSF Chimera and its successor ChimeraX are the most widely used desktop programs for visualizing and analyzing molecular structures. A chimera protein, meanwhile, is a molecule stitched together from parts of different parent proteins, whether by natural frameshifting, by engineered fusion, or by design. This guide covers the software in depth and shows you how to use it on real chimera proteins, because the two topics keep colliding in practice.
Two Meanings of Chimera in Structural Biology
UCSF Chimera was developed by the Resource for Biocomputing, Visualization, and Informatics at the University of California, San Francisco. Its successor, ChimeraX, is the actively developed version and the one used throughout this guide. ChimeraX opens structures from the Protein Data Bank (PDB), from AlphaFold predictions, from cryo-electron microscopy maps, and from local files, then lets you interrogate them interactively.
A chimera protein is a single polypeptide or molecular assembly that combines sequence or structural elements from more than one origin. Nature produces them. Ribosomal frameshifting induced by environmental stress, DNA damage, or altered tRNA modification can produce erroneous chimera proteins with consequences for cellular phenotype, and computational toolboxes such as CPPAtools now exist to predict and analyze such proteins at scale across four axes: chemical properties, secondary structures, domain architecture, and protein structure prediction [1]. Metamorphic proteins can even visit chimeric states transiently. Nuclear magnetic resonance studies of the chemokine lymphotactin resolved an "invisible" intermediate that carries the secondary and tertiary structure of one fold combined with the quaternary assembly of another [2]. In the laboratory, researchers deliberately build chimeras to combine functions, and the design problem is always the same: where can you join two proteins without breaking either one? A CRISPR-guided PAM scanning strategy recently mapped chimera-permissive insertion sites across an entire yeast G protein-coupled receptor pathway, producing 91 chimeras in one systematic pass and identifying functional fluorescent and luminescent reporter insertions in human adenosine A2A and melatonin MTNR1A receptors [3].
You will meet both senses in this article. The software is the tool. The chimeric molecules are some of the most interesting things you can point it at.
Installing ChimeraX
ChimeraX runs on Windows, macOS, and Linux. The installer comes from the UCSF Resource for Biocomputing, Visualization, and Informatics website at cgl.ucsf.edu/chimerax. The program is free of charge for academic use, and the licensing page on that site states the current terms for other uses, so read it before deploying in a commercial setting.
On Windows and macOS, download the installer and follow the prompts. On Linux, download the appropriate package for your distribution. On Ubuntu, a typical install from the downloaded file looks like this:
sudo apt install ./ucsf-chimerax_1.8ubuntu24_amd64.debThe exact version number in the filename changes with each release, so use the filename you actually downloaded. After installation, launch the program:
- Windows: ChimeraX appears in the Start menu.
- macOS: find it in Applications.
- Linux: run
chimeraxfrom a terminal or find it in your application menu.
When the window opens you will see a graphics viewport, a Log panel at the bottom, and (if enabled) a toolbar. Enable the command line by choosing Favorites from the menu bar and selecting Command Line. Every command in this guide is typed at that command line. Press Enter to run a command, and the Log panel reports what happened, which is your primary debugging surface when something goes wrong.
Chimera for Protein Structure Step by Step: From File to Figure
This walkthrough uses ubiquitin (PDB entry 1UBQ), a small, robust, 76-residue protein that every structural bioinformatics course uses for a reason. Follow it exactly once, then substitute your own protein of interest.
Step 1: Open a structure
Type the following at the command line and press Enter:
open 1ubqChimeraX fetches the coordinate file from the PDB over the internet and opens it. The Log reports something like "1ubq fetched from Protein Data Bank" followed by a model number, chain ID, and residue count. The structure appears as an atomic ball-and-stick model by default, which is overwhelming for anything larger than a peptide. Most protein work starts with a cartoon (ribbon) representation instead:
set bgColor white
lighting soft
cartoon
color bychain
Expected result: a clean ribbon tracing the backbone on a white background. The set bgColor white command matters more than beginners expect, because most journals want white backgrounds and dark-on-white figures survive both print and projection better.
Step 2: Understand what you are looking at
A cartoon representation traces the backbone and draws helices as ribbons, strands as arrows, and loops as tubes. Hover the mouse over any part of the structure and a tooltip reports the residue name, number, and chain. To see the underlying atoms again for a specific region, select it and switch its display:
select /a:1-10
show sel atoms
~select
Here /a:1-10 means chain A, residues 1 through 10. The sel token means "the current selection," and ~select clears it. This select-then-act pattern is the backbone of nearly every ChimeraX operation.
Step 3: Color with intent
Random rainbow coloring looks busy and communicates nothing. Two colorings carry real information. The first is a sequence-position gradient:
rainbow structureThe second, and far more useful one, colors by any numeric attribute per residue or per atom, such as B-factor. The B-factor column of a PDB file records experimental uncertainty per atom, and in AlphaFold models it is repurposed to store the pLDDT confidence score, covered in the next section:
color byattribute bfactor #1 palette 0,#ff7d45:50,#ffdb13:70,#65cbf3:90,#0053d6This paints low-B-factor regions orange, midrange yellow and cyan, and high-confidence regions deep blue, with a color key that you can add to the canvas using color key if you want it in the exported image.
Step 4: Measure things
Structural analysis in ChimeraX starts with three measurements: distances, hydrogen bonds, and surface area.
distance /a:48@ca /a:76@ca
hbonds reveal true
measure sasa /a
The first command draws a distance monitor between the alpha carbons of residues 48 and 76 and prints the value in the Log, in angstroms. The @ca token selects alpha carbon atoms. The second command finds hydrogen bonds within default geometry criteria and shows them as dashed lines, with a table of atom pairs and distances in the Log. The third computes the solvent-accessible surface area of chain A and prints it in square angstroms. For multi-chain models, the interfaces command quantifies the buried surface area where chains contact each other, which is the number you quote when describing a dimer interface:
interfaces #1Step 5: Save a figure and a session
save ubq_overview.png width 1600 supersample 3
save session ubq_project.cxs
The supersample 3 flag renders at three times the target resolution and downsamples, which produces smooth antialiased edges without you touching any camera settings. The .cxs session file preserves every model, selection, color, and camera angle, so you can reopen the exact working state later. Sessions are the single most valuable habit in this program.
Working With AlphaFold Models in ChimeraX
The AlphaFold database, hosted jointly by DeepMind and EMBL-EBI at alphafold.ebi.ac.uk, contains predicted structures for hundreds of millions of proteins. ChimeraX talks to it directly, which turns any AlphaFold tutorial into a two-command exercise.
Fetching a predicted structure
Pick a UniProt accession. Human serum albumin is P02768. Then:
open alphafold:P02768ChimeraX downloads the model, opens it, and applies its default AlphaFold styling. The predicted structure arrives as a single chain with no waters, no ligands, and no cofactors, because the prediction covers the protein chain only. The pLDDT confidence values are stored in the B-factor column.
Interpreting pLDDT the correct way
pLDDT (predicted local distance difference test) is a per-residue confidence score on a 0 to 100 scale, cross-validated against inter-residue distances in held-out experimental structures. The standard convention, which AlphaFold documentation and the database viewer both use, divides confidence into four bands:
| pLDDT range | Interpretation | Color |
|---|---|---|
| above 90 | Very high, backbone usually accurate to experimental resolution | Deep blue |
| 70 to 90 | Confident, side chains may wobble | Light blue |
| 50 to 70 | Low confidence, backbone uncertain | Yellow |
| below 50 | Very low, often unstructured or misordered | Orange |
To reproduce this coloring manually after opening any model:
color byattribute bfactor #1 palette 50,#ff7d45:70,#ffdb13:90,#65cbf3:100,#0053d6Orange regions are not necessarily disordered in reality, but they are regions where the network produced no consistent answer, and treating them as coordinates is the single most common analytical error with AlphaFold output.
Predicted aligned error and domain packing
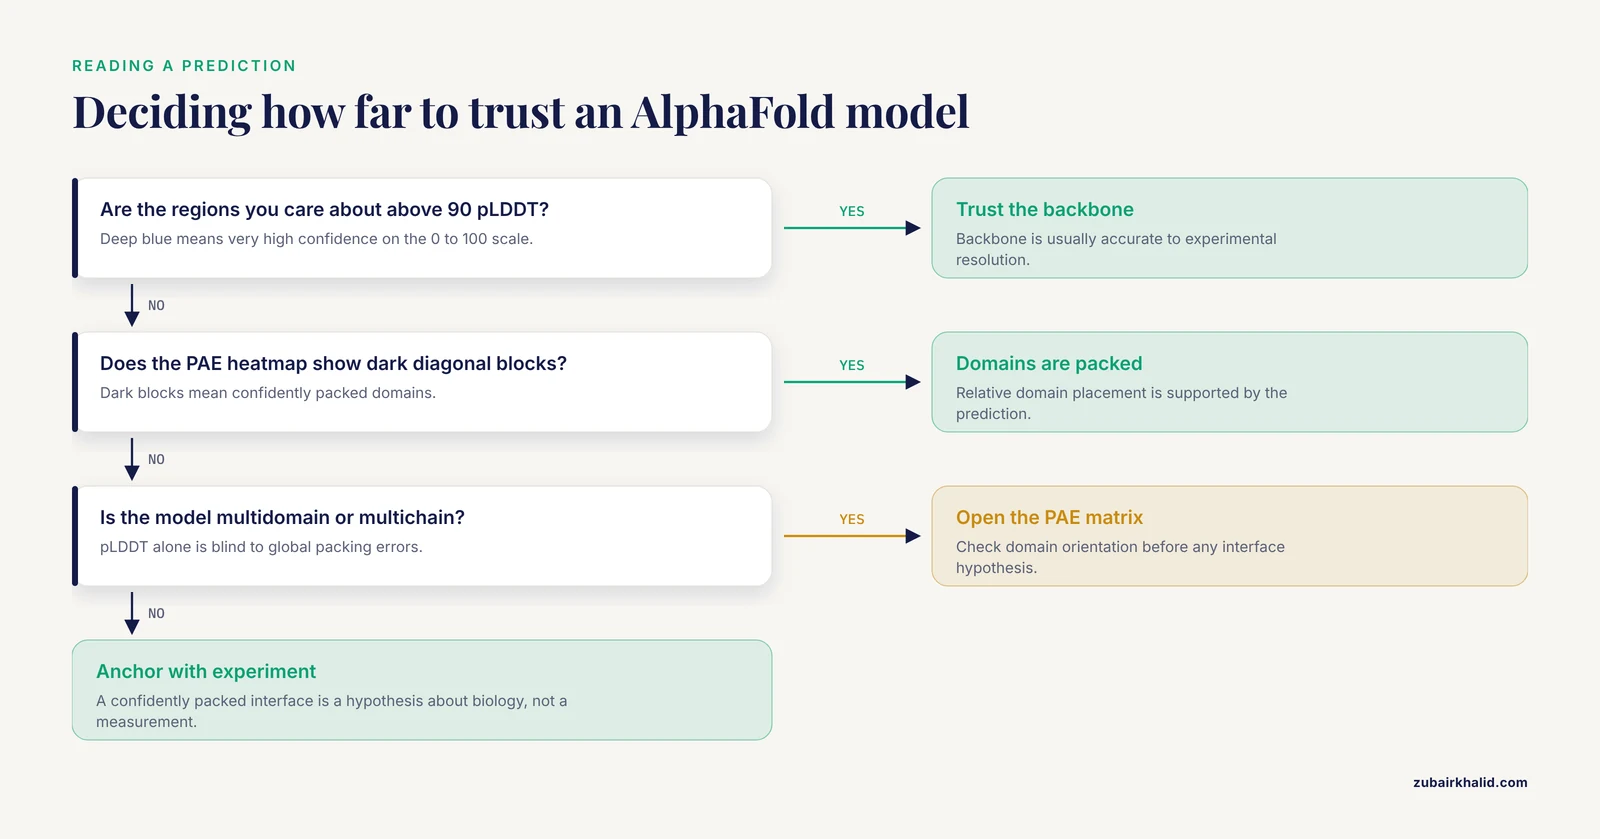
pLDDT tells you about local confidence. It says nothing about whether the relative orientation of two domains is right. That question belongs to PAE (predicted aligned error), a matrix giving the expected positional error at every residue pair. In ChimeraX, open the AlphaFold tool from the Tools menu under Structure Analysis and click Show PAE. A heatmap appears. Dark blocks along the diagonal are confidently packed domains. Faint or bright off-diagonal blocks mean the relative placement of those domains is uncertain, and you should not build detailed hypotheses on their interface without experimental support.
The AlphaFold Server for complexes
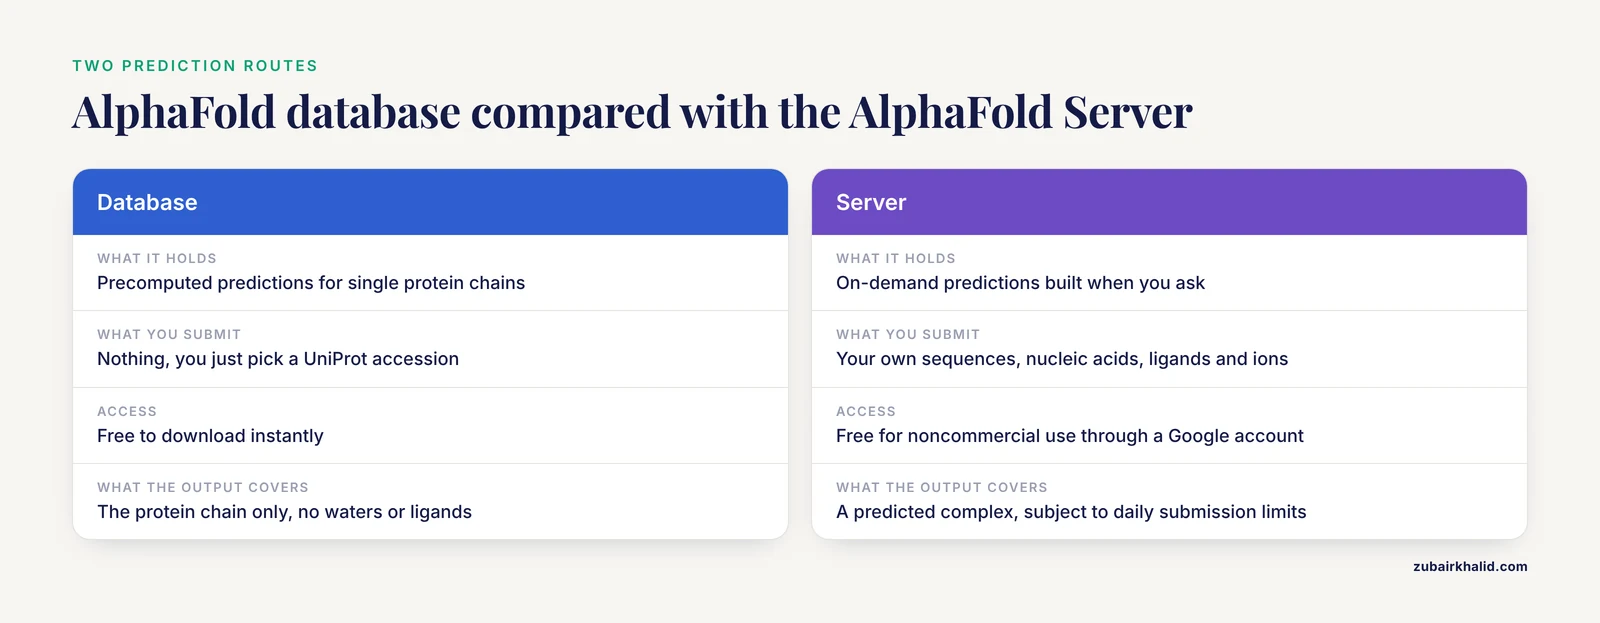
When your question involves a complex rather than a single chain, the AlphaFold Server at alphafoldserver.com lets you submit protein sequences, nucleic acids, ligands, and ions together and receive predicted complex structures. Access is free for noncommercial use through a Google account, and the server applies daily submission limits. The workflow that works well in practice is to predict the complex on the server, download the resulting model, and open it in ChimeraX for the same coloring, measurement, and figure pipeline described above. Treat inter-chain confidence in those outputs with the same skepticism as intra-chain PAE, because a confidently packed interface in the prediction is a hypothesis about biology, not a measurement of it.
Where prediction ends and analysis begins
ChimeraX is a visualization and analysis program, not a structure prediction program. It does not fold proteins. The prediction engines live elsewhere: the AlphaFold database and server for pretrained and on-demand predictions, and academic pipelines for specialized cases. The chimera protein literature makes this division of labor explicit. CPPAtools treats protein structure prediction as one of four analysis modules feeding into chimera protein assessment, not as a feature bolted onto a viewer [1]. A typical published fusion protein design uses multiple prediction servers, for example trROSETTA and I-TASSER, then validates the model with quality assessment tools such as the SAVES server, docks the complex with ClusPro, inspects interactions in PDBsum, and runs molecular dynamics in Desmond before anyone claims the structure is sound [4]. ChimeraX sits comfortably at the front and back of that pipeline: you visualize the inputs, inspect the outputs, and make the figures.
Building a Chimera (Fusion) Protein Structure Step by Step
Suppose you want to visualize a fusion protein, an IL-15 cytokine joined to a tumor-targeting peptide as in the hepatocellular carcinoma candidate reported with computational modeling support [4], or simply your own two-domain construct. Here is the practical ChimeraX workflow.
Step 1: Gather the parts
Open each parent structure. For a concrete demonstration, combine ubiquitin with a second chain:
open 1ubq
open 2jar
If no experimental structure exists for one parent, fetch its AlphaFold model with open alphafold:ACCESSION and note its confidence profile before you commit to any junction geometry.
Step 2: Superpose the parents if they share a fold
If the two parents share a homologous domain, align them to understand the junction:
matchmaker #2 to #1Matchmaker performs sequence-guided superposition and reports the root-mean-square deviation in the Log. A low RMSD across the shared region tells you the chimera junction can be modeled on that alignment.
Step 3: Combine into one model
combine #1 #2 name fusionThis creates a new model containing both chains. Renumber and rename as needed using the changeclass and chain editing tools, or rename chains with rename so downstream tools do not complain about duplicate chain IDs.
Step 4: Close the linker gap
The gap between the last residue of the first parent and the first residue of the second parent needs a peptide bond and usually a designed linker. ChimeraX offers two routes. The Build Structure tool (Tools menu, Structure Editing) can add atoms and bonds manually. For proper loop modeling, the integrated Modeller interface builds the missing linker segment with plausible geometry, and Modeller itself requires a free academic license obtained from the Sali lab website before the feature activates. Either way, the goal is a linker whose length and flexibility match the design intent. Rigid, short linkers constrain domain orientation. Long glycine-serine-rich linkers let the domains move independently.
Step 5: Relax the construct
A fused structure pasted together by hand will contain clashes. ChimeraX includes a restrained minimization command backed by OpenMM:
minimize #3Use it with restraint to the starting coordinates, on modestly sized systems, and treat the output as a cleaned-up starting point rather than a physics result. Published chimera work consistently goes further, running full molecular dynamics and free-energy-aware simulations to validate that the engineered construct holds together [5]. A chimera of the archaeal sodium-calcium exchanger NCX_Mj redesigned to mimic NCKX ion selectivity was interrogated with ion-flux assays and unrestrained all-atom simulations before any conclusion about the chimera's behavior was drawn [5]. Your minimization is step zero of that kind of validation, not a substitute for it.
Step 6: Verify and present
Run the measurement battery again on the fused model:
hbonds reveal true
interfaces #3
measure sasa #3
Then save the session and render:
save session fusion_project.cxs
save fusion_figure.png width 2000 supersample 3
Choosing where to join matters more than how to join
The modeling step in ChimeraX is the easy part. The hard part is that insertion tolerance is a biological property you cannot read off a static model. The PAM scanning study mapped 91 chimeras across a GPCR pathway and found that functional tolerance of inserted payloads, and even the biophysical protection a payload receives from its surrounding structure, varied site by site in ways that only live-cell measurement revealed [3]. Structure-guided design has produced elegant results when combined with empirical screening, as in the BromoCatch self-labelling tag platform, where a structure-based electrophilic ligand library was screened against engineered cysteine mutants and the winning pair was confirmed by an X-ray co-crystal structure at 1.3 angstrom resolution [6]. Use ChimeraX to choose candidate junctions and to communicate the design. Use experiments to choose the design.
Key ChimeraX Command Reference
| Task | Command | Example |
|---|---|---|
| Open a PDB entry | open ID | open 1ubq |
| Fetch an AlphaFold model | open alphafold:ACCESSION | open alphafold:P02768 |
| Open a local file | open path | open ~/structures/model.pdb |
| Cartoon display | cartoon | cartoon |
| Color by chain | color bychain | color bychain |
| Color by numeric attribute | color byattribute | color byattribute bfactor #1 |
| Sequence gradient | rainbow | rainbow structure |
| Select residues | select spec | select /a:1-20 |
| Show hydrogen bonds | hbonds | hbonds reveal true |
| Measure distance | distance | distance /a:48@ca /a:76@ca |
| Surface area | measure sasa | measure sasa /a |
| Interface analysis | interfaces | interfaces #1 |
| Superpose models | matchmaker | matchmaker #2 to #1 |
| Merge models | combine | combine #1 #2 |
| Restrained minimization | minimize | minimize #3 |
| Save an image | save file.png | save fig.png supersample 3 |
| Save the session | save session file.cxs | save session work.cxs |
Chimera for Protein Structure Tips
These are the working habits that separate a five-minute figure from a five-hour one.
Script everything you will repeat. Save a plain text file with a .cxc extension, one command per line:
open 1ubq
set bgColor white
lighting soft
rainbow structure
save overview.png width 1600 supersample 3
hbonds reveal true
save hbonds.png width 1600 supersample 3
Then run the whole sequence with open tour.cxc. When a reviewer asks for the same figure in a different color scheme, you edit one line and rerun. This is reproducibility in its most literal form, and it costs nothing.
Use light mode for figures and dark mode for exploration. set bgColor white before any export. The default dark background makes colors pop on screen and makes printed figures look wrong.
Make movies the boring way. A spinning view is often the clearest supplementary video:
movie record
turn y 2 180
wait 180
movie encode output spin.mp4
The turn command rotates the scene 2 degrees per frame across 180 frames while the recorder captures, and the encode step writes the file. Keep spins slow. Viewers need time to read the structure.
Use transparency instead of cutting. Rather than deleting a subunit to see a binding pocket, make it translucent:
transparency 50 #1/bThe reader keeps the spatial context of where the buried site actually is.
Color sequence conservation onto a structure when comparing homologs. Prepare a per-residue conservation column in a simple attribute file and load it with open file attribute=residue, then color byattribute. This is the fastest route from a multiple sequence alignment to a structural hypothesis, and it follows the same per-residue logic used in variant-impact analyses, where conservation scoring, stability prediction, and 3D modeling are combined to prioritize which substitutions deserve experimental attention [7].
Check the biological assembly before making claims about oligomers. The asymmetric unit in a PDB entry is not always the biological unit. Use the biological assembly option when fetching, or build symmetry copies with the sym command, before you describe an interface.
Pair your figure with the confidence information. For AlphaFold-derived figures, showing pLDDT coloring in the main figure and the PAE matrix as supplementary material is an honest presentation that reviewers increasingly expect.
Remember that the chimera protein on screen may not be the chimera protein in the cell. Recombinant overexpression saturates cellular folding and quality control machinery, which polyubiquitinate and degrade misfolded substrates, and one recent response to that bottleneck was a deubiquitinase-targeting chimera expression system that raised yields of three diverse recombinant proteins in HEK293F suspension culture [8]. A clean model on screen does not guarantee a soluble, folded, stable construct at the bench, and platforms exist precisely because this gap is common.
Common Mistakes and Limitations
Reading pLDDT as an error bar in angstroms. pLDDT is a cross-validated confidence score, not a calibrated distance uncertainty. The four color bands are categories of trust, not measurements. Quote them as such.
Ignoring the PAE matrix. The most consequential AlphaFold failures are domain-orientation and interface-packing failures, and pLDDT is blind to them. A model can be locally beautiful and globally wrong. Check the PAE heatmap for every multidomain or multichain model you analyze.
Energy minimizing an AlphaFold model and calling it improved. Unrestrained minimization lets a model drift away from its predicted geometry, and the drift can hide the confidence information entirely. If you relax a predicted model, restrain it, and say so in your methods.
Presenting a fused construct as a solved structure. A combined, linker-closed, minimized model is a design hypothesis. The fusion protein literature handles this correctly by adding docking, interaction analysis, and molecular dynamics on top of initial modeling, and even then reporting the construct as a candidate requiring expression and testing [4]. Follow that standard.
Assuming insertion tolerance from geometry alone. A site that looks solvent-exposed and far from active residues can still be functionally intolerant, and a crowded-looking site can accept a large payload. The empirical mapping from PAM scanning showed site-specific tolerance and even protease protection of inserted payloads varying unpredictably along the sequence [3]. Screen insertion sites, do not presume them.
Ignoring natural chimeric states when interpreting a single predicted fold. Proteins with more than one stable fold exist, and their transient hybrid intermediates can carry one fold's tertiary structure with another fold's quaternary assembly, as resolved for lymphotactin [2]. A single static model, whether experimental or predicted, underrepresents proteins like these. Say so when your protein has metamorphic behavior.
Confusing the two chimera meanings in writing and searching. Searching "chimera protein structure" mixes results about UCSF software with results about fusion proteins, PROTAC degraders, and frameshift products. When you write, name the tool as UCSF ChimeraX and the molecule as a fusion or chimeric protein. Precision here saves reviewers and readers real confusion.
Losing work by not saving sessions. Every styling choice, selection, and camera move lives in memory until you save a .cxs file. Crash without one and you redraw everything from scratch.
Forgetting that models lack small molecules and solvent. AlphaFold predictions contain neither waters nor cofactors nor membranes. If ligand context matters to your question, fetch the experimental PDB entry too, superpose the model onto it with matchmaker, and compare.
Over-interpreting any model without experimental anchoring. Predictions, dockings, and minimizations generate hypotheses. Validation in the published chimera literature always includes an experimental leg, whether ion-flux assays with simulations [5], co-crystallography [6], or live-cell functional screening [3]. Plan the experimental check when you plan the model. Where a project moves from visualization to design decisions with safety, biological, or regulatory consequences, that judgment belongs to someone with the appropriate domain expertise, not to a rendering.
Frequently Asked Questions
Is Chimera the same as ChimeraX?
No. ChimeraX is the actively developed successor to UCSF Chimera, with a modern graphics engine, a Python 3 foundation, and better integration with AlphaFold data. UCSF Chimera is in maintenance mode. Start new projects in ChimeraX.
How do I open an AlphaFold model in ChimeraX?
Type open alphafold:UNIPROT_ID at the command line, replacing UNIPROT_ID with the accession, for example open alphafold:P02768. ChimeraX downloads the model from the AlphaFold database and loads the pLDDT confidence values into the B-factor column for coloring.
What do the pLDDT colors in an AlphaFold model mean?
Deep blue means very high confidence, light blue means confident, yellow means low confidence, and orange means very low confidence, on the standard scale of above 90, 70 to 90, 50 to 70, and below 50 respectively. Orange regions are places where the prediction is not reliable enough to treat as coordinates.
Can ChimeraX predict a protein structure?
No. ChimeraX visualizes and analyzes structures but does not predict them. Use the AlphaFold database for precomputed single-chain predictions, the AlphaFold Server for complex predictions, or a dedicated prediction pipeline, then bring the results into ChimeraX for inspection and figures.
How do I build a fusion (chimera) protein structure in ChimeraX?
Open both parent structures, superpose them with matchmaker if they share a fold, merge them with combine, close the linker gap using Build Structure or the Modeller integration, and relax the result with minimize. Treat the outcome as a hypothesis and validate it with docking, simulation, or experiment.
Is UCSF Chimera free?
ChimeraX is free of charge for academic and noncommercial use, with licensing terms for other uses published on the UCSF RBVI website. Check that page for current terms before using it in a commercial environment.
What is the difference between the AlphaFold database and the AlphaFold server?
The database is a precomputed library of predicted structures for single protein chains that you can download instantly. The server accepts your own sequences, including proteins, nucleic acids, ligands, and ions together, and predicts the complex on demand for noncommercial use, subject to daily submission limits.
How do I export a publication-quality image from ChimeraX?
Style the scene, set the background to white with set bgColor white, then run save figure.png width 1600 supersample 3. The supersample flag renders at higher resolution and downsamples for smooth edges. For raster-adjacent workflows, high-resolution PNG or TIFF output plus the session file covers most journal requirements.
Sources
- CPPAtools: a computation toolset for chimera protein prediction and analysis.
- Structure of a sparsely populated chimeric intermediate that facilitates fold-switching of a metamorphic protein.
- Systematic mapping of chimera-permissive sites by CRISPR-guided PAM scanning.
- Computational modeling and expression of recombinant interleukin 15-R-Tf-D-LP4 peptide fusion protein: a potent candidate for hepatocellular carcinoma.
- Emulating ion selectivity and transport features of NCKX antiporter through structure-guided mutations in NCX_Mj.
- BromoCatch: a self-labelling tag platform for protein modification and live cell imaging.
- Potentially Deleterious Nonsynonymous Single Nucleotide Polymorphisms (nsSNPs) in the Human MCPH1 Gene: Systematic In Silico Predictions and Implications for Structure and Function.
- Deubiquitinase-Targeting Chimera (DUBTAC)-Enhanced Mammalian Expression System for Efficient Recombinant Protein Expression.