Evaluating the Usability of Bioinformatics Tools: A Guide
By Dr. Zubair Khalid, DVM, MS, PhD ·

A tool can be accurate and still be hard to use, and a tool can be easy to use and still give the wrong answer, so evaluating the usability of bioinformatics tools means judging accuracy, runtime, reproducibility, and the human effort required to reach a correct result, all at once. The rule of thumb that follows from this is simple: adopt the least complicated tool that reproduces a trusted result on data like yours, then confirm that result against an independent method before you build anything on top of it.
This guide explains what usability means for bioinformatics software, which criteria actually decide tool choices, how published comparisons are run, and where the common traps are. Every recommendation here is anchored in published benchmarking studies rather than vendor claims.
What Usability Means for Bioinformatics Software
In human-computer interaction research, usability describes how effectively, efficiently, and satisfactorily a user can employ a tool to accomplish a goal. For bioinformatics software, that definition has to stretch further, because the "user" is often a pipeline, the "goal" is a downstream biological inference, and a failure can silently corrupt an entire study. Bioinformatics tools usability evaluation therefore has to cover both the human side and the analytical side.
The dimensions that matter in practice are:
- Installation and environment. Does the tool install cleanly with a package manager, or does it need hand-compiled dependencies that break on modern operating systems?
- Documentation quality. Are default parameters documented, are worked examples included, and are the tool's assumptions stated in plain language?
- Interface and input format. Does the tool accept standard formats such as FASTQ, BAM, VCF, or FASTA, or does it force proprietary conversions?
- Output interpretability. Can a competent analyst understand what each column means without reading the source code?
- Reproducibility. Does the tool record its version, parameters, and reference data so that a rerun months later produces the same result?
- Runtime and resource cost. How long does the tool take on realistic data, and how much memory and CPU does it demand?
- Support and community. Is there an active issue tracker, a mailing list, or a responsive maintainer when something breaks?
Researchers who study programming languages run dedicated workshops on evaluation and usability, combining task-based testing with user surveys and documentation inspection, and those same methods transfer directly to bioinformatics software [1]. Even formal-methods competitions now judge their participating tools on performance, versatility, and usability together, rather than on raw speed alone [2]. The lesson from both fields is the same: a tool that wins a benchmark but resists correct use by real analysts delivers less value than a slightly slower tool that analysts can run correctly the first time.
Evaluation Criteria That Decide Real Choices
When you compare candidate tools, these are the criteria that separate a defensible choice from a convenient one.
Analytical accuracy
Accuracy is the match between a tool's output and a known truth. Standard measures include sensitivity (the fraction of true features the tool finds), precision (the fraction of calls that are true), the false positive rate, and agreement statistics such as Cohen's kappa, which measures agreement between two methods after correcting for chance. The right measure depends on the task. A variant caller is judged on false positives and false negatives against a truth set. A prediction tool is judged on how well its scores rank known positives above known negatives.
Agreement with an orthogonal method
An orthogonal method is an independent technology or approach that measures the same thing in a different way. Sequencing data can be checked against microarrays, optical genome mapping, or targeted genotyping. In a benchmark of six cancer copy number variation (CNV) callers on the hyper-diploid cancer cell line HCC1395, the authors validated copy gain, copy loss, and loss of heterozygosity (LOH) calls against microarray and Bionano optical mapping results, then combined agreement across callers and technologies into a high-confidence call set [3]. This pattern, where sequencing results are confirmed by a method with different bias, is one of the strongest forms of evidence you can generate in-house.
Runtime and compute cost
Wall-clock time and memory footprint decide whether a tool fits your infrastructure. In a comparison of short-read mappers and variant callers on whole exome sequencing data from four well-characterized Genome in a Bottle samples (NA24149, NA24143, NA24385, and NA25631), the combination of BWA-MEM2 alignment and DRAGEN-GATK variant calling was both faster and more accurate for single nucleotide variants and indels than the standard GATK Best Practices workflow, with runtime assessed across eighteen exome samples at different read counts and coverage levels [4]. In mitochondrial genome assembly, the spread was even wider: at sixteen computational threads and 1000x simulated read depth, MitoFlex finished in 69 seconds while IOGA needed 1278 seconds, an eighteen-fold difference on the same task [5]. Numbers like these are why runtime belongs in every bioinformatics tools comparison, not as an afterthought but as a first-class criterion.
Parameter sensitivity
A tool whose output changes drastically when a parameter moves slightly is a tool that will surprise you. In a toxicogenomics evaluation of four miRNA-seq analysis tools (miRDeep2, miRExpress, miRNAkey, and sRNAbench), researchers tested thirty different parameter settings spanning hairpin alignment windowing, quantification choices, and four normalization options, across three dose levels and four time points of thioacetamide-treated rat liver samples. The study's central point was that parameters do not act in isolation, and their joint effects shape detected differentially expressed miRNAs and novel miRNA identification, and that parameter-driven variation should never overpower the treatment effect in a toxicogenomics design [6]. A usability evaluation that ignores parameter sensitivity will overestimate a tool's reliability.
Database and reference dependence
Many tools are only as good as the database behind them. Two functional prediction tools for 16S rRNA data, PICRUSt and Tax4Fun, produced overlapping but non-identical profiles of Antarctic microbial mats because PICRUSt draws on Greengenes while Tax4Fun draws on SILVA, and each database supported taxonomic assignments the other missed, so the authors built a combined R script to merge the functional predictions into a more complete metabolic profile [7]. Metabolomics enrichment tools face the same problem at the identifier level: a survey of over-representation analysis tools found that identifier coverage differed across metabolite databases such as HMDB, KEGG, PubChem, ChEBI, and METLIN, with PubChem covering the most identifiers but carrying duplicated entries and possible false positives, and that an exploratory non-metric multidimensional scaling of Jaccard distances showed the tools themselves formed diverse clusters [8]. Imputation accuracy tells the same story from the genotype side, where the choice between the Haplotype Reference Consortium panel (27,165 haplotypes) and the 1000 Genomes Project phase 3 panel (2,504 haplotypes), and between phasing algorithms such as SHAPEIT and Eagle2 and imputation algorithms such as IMPUTE2 and MACH-Admix, shapes what can be recovered for rare and ultra-rare variants in an admixed Caribbean Hispanic cohort of 1,000 individuals [9].
Installability, web access, and support
A tool nobody can install has zero accuracy in your lab. Web-based tools trade control for convenience. In tuberculosis resistance screening, five web-based tools (Mykrobe, TB-profiler, PhyReSse, KvarQ, and SAM-TB) were evaluated against conventional drug susceptibility testing on 88 sequenced isolates, and Mykrobe reached 98 percent agreement with phenotypic testing and a Cohen's kappa of 0.941 for global resistance detection, which shows that accessible web tools can perform at a level suitable for practical screening [10]. The usability gain is real, but it comes with a dependency on someone else's server staying up and consistent.
Output interpretability and reporting
A tool that emits a wall of unexplained columns fails usability even if its numbers are right. Evaluation studies in text mining address this directly by designing metrics that make tool outputs comparable, such as a TF*IDF-based Gene Enrichment Metric used to compare three biomedical natural language processing tools against p-value and F-score baselines for pathway enrichment tasks, with the explicit goal of supporting reproducible in-silico comparison [11]. When you evaluate a candidate tool, ask whether you can explain every output field to a collaborator in one sentence. If you cannot, the downstream error rate goes up even when the tool is correct.
Comparison Table: Ways to Evaluate a Bioinformatics Tool
There is more than one way to run a bioinformatics tools usability evaluation, and the options differ in effort, evidence strength, and failure modes. This table is the core of the article, and the sections after it expand each row.
| Approach | What it measures | Published example | Main pitfall |
|---|---|---|---|
| Gold-standard benchmark | Accuracy against a curated truth set | Exome pipelines judged on Genome in a Bottle trio samples for mapping efficiency, variant calls, and false positive rates [4] | Truth sets cover only what they cover, and accuracy elsewhere is unknown |
| Head-to-head tool comparison | Relative accuracy, sensitivity, and reproducibility on identical data | Six cancer CNV callers benchmarked on one hyper-diploid genome, with sensitivity and reproducibility across sequencing centers [3] | Results may not transfer to genomes with different characteristics |
| Independent validation set | Generalization to data the tools never saw | HLA-I binding predictors tested on 21,101 experimentally verified ligands across 19 allotypes [12] | Validation sets have their own biases toward easy ligands |
| Parameter sensitivity sweep | Stability of results across settings | Thirty parameter settings across four miRNA-seq tools and four normalization options [6] | Combinatorial cost, and results still depend on the datasets chosen |
| Orthogonal (cross-technology) validation | Consistency with a different measurement technology | CNV calls checked against microarray and Bionano optical mapping [3] | Orthogonal methods have their own errors, especially at breakpoints |
| Database or reference panel swap | Dependence on external reference data | PICRUSt (Greengenes) versus Tax4Fun (SILVA) [7], HRC versus 1000G imputation panels [9] | Tells you about reference effects, not about the algorithm itself |
| Reference-standard agreement | Performance against a clinical or phenotypic benchmark | Web-based TB resistance tools versus drug susceptibility testing on 88 isolates, Mykrobe at 98 percent agreement and kappa 0.941 [10] | Phenotypic standards miss mechanisms the genotype can see and vice versa |
| Task-based usability test | Can a real analyst complete a real task correctly | The programming-language usability workshop tradition of task-based evaluation [1] | Hard to standardize across labs and skill levels |
| Community competition or benchmark | Performance, versatility, and usability scored uniformly | QComp 2019, which evaluated tools on stochastic model analysis using a shared benchmark set [2] | Competitions reward the categories they score, and usability is hard to score |
| Systematic review with flexible comparison | Feature coverage and suitability across many tools | A critical review of 32 bioinformatics knowledge transmission management systems to guide selection | Reviews age quickly in a fast-moving field |
Evaluation options and their pros and cons
Each option earns its place in a bioinformatics tools usability evaluation, and each has a cost.
Gold-standard benchmarks give the cleanest accuracy numbers because truth is defined in advance. The con is that truth sets are expensive to produce and limited in scope. If your sample is unlike the truth set, for example a hyper-diploid tumor instead of a diploid reference, a caller validated on diploid material may call excessive copy gain or loss, which is exactly what happened with some CNV tools on the HCC1395 genome when genome ploidy was mis-assessed [3].
Head-to-head comparisons are the workhorse of the field. Run every candidate on the same inputs, with the same read counts, and report accuracy, sensitivity, false positive rates, and time together, as the exome pipeline study did [4]. The con is that a comparison on one dataset class is a data point, not a verdict. The mitochondrial assembly comparison found a 69-second fastest tool and a 1278-second slowest tool on the same simulated 1000x data, but those rankings can shift with genome characteristics and thread counts [5].
Independent validation sets test generalization. The HLA-I evaluation compiled an independent set of 21,101 verified ligands spanning 19 allotypes and showed that MixMHCpred 2.0.1 led for most allotypes, with NetMHCpan 4.0 the strongest machine-learning-based option and NetMHCcons 1.1 the strongest consensus option [12]. The con is that validation data over-represent well-studied alleles and easy peptides, so a tool's reported edge can shrink on rare allotypes.
Parameter sweeps reveal brittleness. The miRNA-seq study showed that quantification and normalization choices jointly shape results, which means a tool comparison run at a single default setting can mislead [6]. The con is cost, since the number of settings multiplies fast.
Orthogonal validation is the strongest in-house evidence for applied work, as the CNV study demonstrated by using microarray and Bionano confirmation [3]. The con is that it requires access to a second technology and budget for it.
Database and panel swaps expose hidden dependencies. The metagenomic functional profiling study showed that two well-regarded tools each found taxa and functions the other missed, purely because of their database backends [7], and the imputation study showed that reference panel choice governs what happens at the rare and ultra-rare end of the frequency spectrum [9]. The con is that this evaluation tells you about the reference layer, not the algorithm.
Web-tool agreement studies are uniquely useful for labs without local compute. The tuberculosis study compared five web tools against drug susceptibility testing and identified which tools agreed best globally and for first-line drugs individually [10]. The con is version drift, since a web service can change under you between your evaluation and your production runs.
Lessons from Published Tool Comparisons
Across these studies, several patterns repeat, and they should shape how you design your own evaluation.
Model assumptions can outweigh raw data quality
The most instructive result in the cancer CNV benchmark was not which tool won. Copy gain, loss, and LOH calls were largely consistent across sequencing centers, callers, and technologies, but variation in calls was driven mostly by the determination of genome ploidy, and on a hyper-diploid genome some tools called excessive copy gain or loss because they assessed ploidy inaccurately [3]. The usable lesson: before trusting a tool, understand the biological and statistical model it embeds. A caller tuned for near-diploid genomes is not a neutral choice for an aneuploid tumor.
The database behind a tool shapes its results as much as the algorithm
The PICRUSt and Tax4Fun comparison found taxa such as Pseudoxanthomonas, Planctomycetaceae, and Nitrosomonadaceae identified only by Tax4Fun through SILVA, and Pirellulaceae, Gemmatimonadetes, and others identified only by PICRUSt through Greengenes, with each tool also reporting functional IDs the other lacked [7]. The metabolomics enrichment survey found the same identifier-level dependence, with PubChem, METLIN, and ChEBI covering the most metabolite identifiers while carrying duplication risks [8]. When you evaluate a tool, evaluate its reference data too: version, coverage, and identifier mapping all belong in your notes.
Faster and more accurate can coexist, but only if you measure both
A persistent myth says you trade speed for accuracy. The exome pipeline study found BWA-MEM2 with DRAGEN-GATK both faster and more accurate than the standard workflow on SNVs and indels [4], and the mitochondrial assembly comparison found the fastest assembler also produced complete genomes within the tested settings [5]. Neither result generalizes blindly, but both show that runtime belongs in the evaluation matrix alongside accuracy, measured on realistic read counts and coverage, as the exome study did with eighteen samples at varying depths [4].
Consensus across tools raises confidence when truth is uncertain
When no single tool can be trusted alone, agreement across independent tools and technologies becomes the practical truth standard. The CNV study built its high-confidence call set for HCC1395 from consensus across six callers plus confirmation from three orthogonal methods [3]. The splicing evaluation in monogenic diabetes followed the same logic, using SpliceAI and SPiP to prioritize 36 spliceogenic variants in GCK, HNF1A, and HNF4A, comparing against Pangolin and AbSplice-DNA with tissue-specific annotations, and confirming splicing defects for 33 of the 36 variants in minigene assays, which allowed 23 of 31 variants of uncertain significance (74 percent) to be reclassified as likely pathogenic [13]. The combination of computational prediction with a wet-lab assay is the strongest usability signal a diagnostic tool can earn. Similarly, merging functional predictions from PICRUSt and Tax4Fun in a custom script produced a more inclusive metabolic profile than either tool alone [7].
Web-based tools can meet practical standards
The tuberculosis study is the cleanest demonstration. Among Mykrobe, TB-profiler, PhyReSse, KvarQ, and SAM-TB, Mykrobe achieved 98 percent agreement with drug susceptibility testing and a Cohen's kappa of 0.941 for global resistance detection across 88 isolates, while SAM-TB, PhyReSse, and Mykrobe correlated better for first-line drugs individually, and half of the mutations flagged by all tools were canonical changes in rpoB, katG, embB, pncA, gyrA, and rrs [10]. For a lab deciding whether a web tool is usable for screening, agreement statistics against the accepted reference standard are the number to look for.
Machine learning tools change what a comparison measures
Machine learning classifiers bring training-set dependence into every evaluation. The HLA-I benchmark tested prediction performance on an independent ligand set, which is the correct design for learned models, and found the deep-learning-based MixMHCpred 2.0.1 ahead for most allotypes [12]. In metagenomics, a comparison of assembly-based tools including PhyloFlash, MEGAHIT, MetaSPAdes, Kraken2, Mothur, UniCycler, and PathRacer against deep learning classifiers DNABERT and DeLUCS found that ensembling assembly tools with machine learning tools improved organism identification relative to either alone, with the size of the gain depending on genome repetitiveness, size, and GC content [14]. The lesson for usability evaluation is that learned tools need held-out data, and that ensembling can be a legitimate option rather than an admission of indecision.
Usability itself can be the object of study
Selection among platforms for teaching bioinformatics is its own evaluation problem. A critical review of 32 bioinformatics knowledge transmission management systems asked directly what makes a good one and proposed a flexible comparison framework drawing on standards such as LOM and SCORM for the next generation of such systems. The transferable idea is that even soft criteria, such as how well a platform supports learners and instructors, can be evaluated systematically with defined criteria rather than impressions.
Worked Scenarios
Abstract criteria become concrete in decisions. Here are four scenarios drawn from the published comparisons, with the reasoning a senior analyst would apply.
Scenario 1: Selecting an alignment and variant calling stack for a clinical exome service
You run whole exome sequencing and need to decide between the established GATK Best Practices pipeline and a BWA-MEM2 plus DRAGEN-GATK stack. The published comparison gives you the evaluation template: test on gold-standard samples with known genotypes (the study used four Genome in a Bottle exomes), measure mapping efficiency, variant calling performance, false positive call rate, and runtime, and extend runtime testing across a realistic panel of eighteen samples at varying read counts [4]. Because the published result showed the newer stack was faster and more accurate on SNVs and indels, your in-house replication should confirm both properties on your capture kit and your sequencer before you switch. The usability criteria then tip the balance: DRAGEN-style accelerated pipelines reduce the turnaround time that is often the bottleneck in precision medicine workflows [4].
Scenario 2: Prioritizing splice variants in a monogenic diabetes diagnostic context
You are a molecular diagnostics group with a list of variants of uncertain significance in GCK, HNF1A, and HNF4A. The published workflow shows a usable pattern: run two in silico splicing predictors first (SpliceAI and SPiP), cross-check with tools that add tissue-specific annotations (Pangolin and AbSplice-DNA), prioritize the concordant high-confidence calls, and confirm with minigene assays. In the published application, 33 of 36 computationally prioritized variants showed confirmed splicing defects, spanning exon skipping, exonic deletions, intron retention, and complex patterns, and the evidence supported reclassifying 23 of 31 variants of uncertain significance as likely pathogenic [13]. The usability evaluation here is about workflow fit: the tool layer has to produce a short, defensible priority list that a lab can validate economically.
Scenario 3: Adding contamination screening to a tumor sequencing pipeline
Cross-sample contamination degrades somatic variant detection even at low levels, so you need a screening step. Rather than picking a tool by reputation, follow the published systematic evaluation, which examined nine computational methods, then compared five representative tools on in silico and simulated NGS data with qualitative and quantitative analyses. Conpair performed best for identifying contamination and estimating its level in solid tumor sequencing, and the study's authors built ConSPr on top of it to predict the contamination source [15]. The usability decision reduces to three checks: does the tool detect contamination at your panel's depth, does it estimate the level rather than just flag it, and can it be inserted as a quality-control step without restructuring your pipeline.
Scenario 4: Resistance screening in a lab without local compute
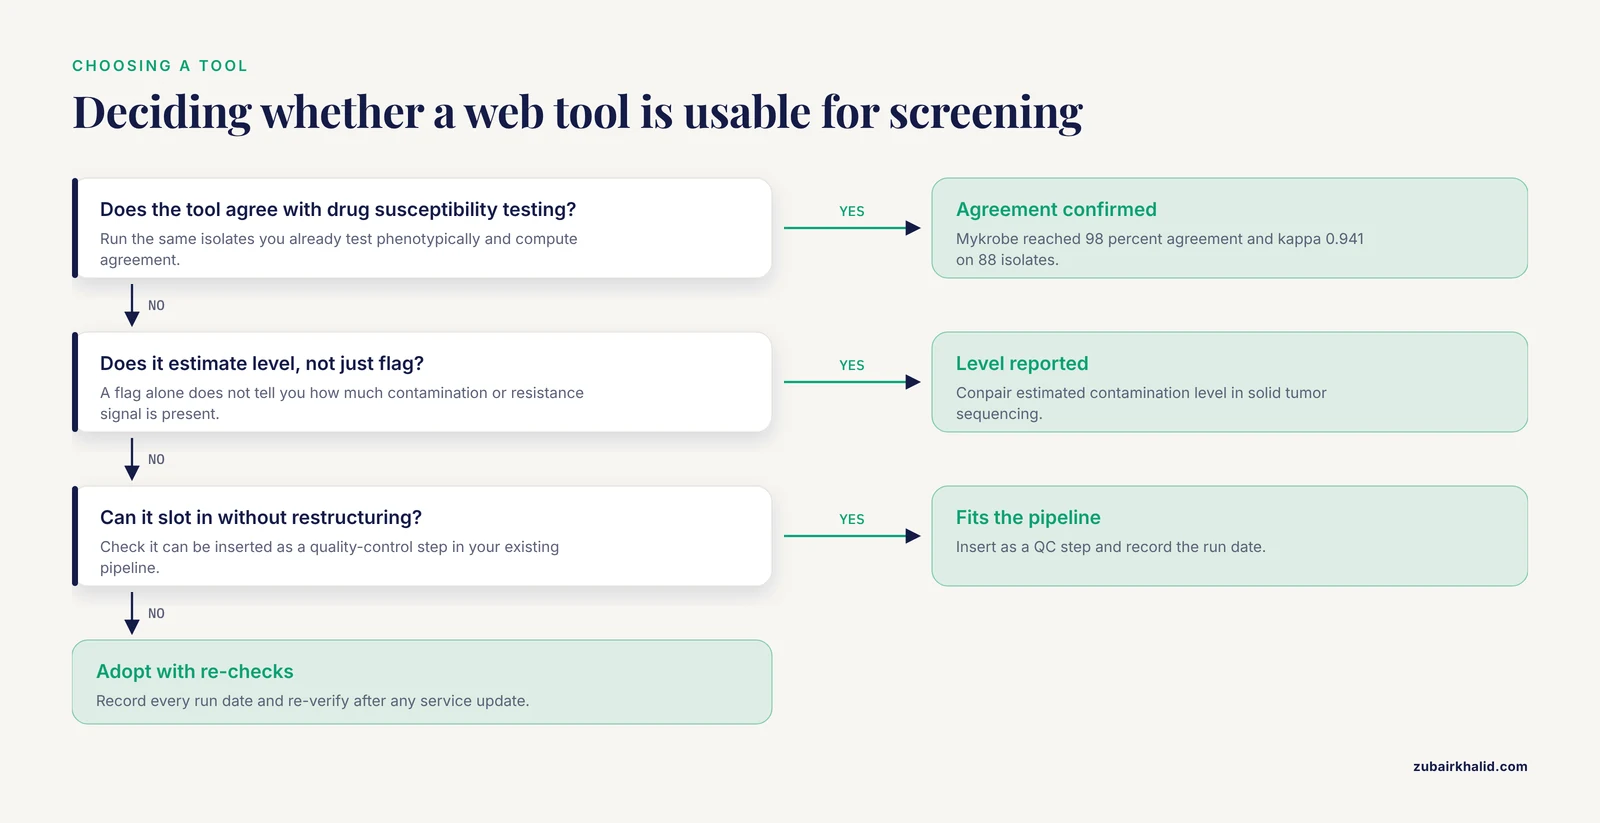
Your laboratory can sequence isolates but has limited computational infrastructure, and you need drug resistance predictions for Mycobacterium tuberculosis. Web-based tools are the natural candidates, and the published evaluation shows how to vet them: sequence the same isolates you already test phenotypically, run each web tool, and compute agreement statistics against drug susceptibility testing. In that study of 88 isolates, Mykrobe's global agreement of 98 percent with a kappa of 0.941 made it the strongest single choice for global resistance detection, while SAM-TB and PhyReSse performed comparably for first-line drugs [10]. The residual usability risk is server stability and silent version changes, so record the date of every run and re-verify after any service update.
Common Mistakes and Limitations
These are the errors that most often invalidate a bioinformatics tools comparison, in published work and in lab practice.
- Generalizing from a single benchmark dataset. A tool that wins on one genome, one read length, or one cancer type has won one contest. The CNV study showed that results consistent for most call classes still broke down on a hyper-diploid genome when ploidy was mis-assessed [3]. Always ask what data characteristics the evaluation covered and which it did not.
- Testing at default parameters only. The miRNA-seq evaluation demonstrated that parameter settings act jointly, not independently, and that parameter-driven variation must not overpower the biological effect being studied [6]. A single-settings comparison can rank tools in an order that dissolves under a parameter sweep.
- Trusting internal quality scores as correctness. Internal metrics such as IMPUTE2's info score describe statistical confidence, not agreement with truth. The imputation study deliberately combined internal indexes with masked-variant testing, agreement with whole-exome sequencing via Cohen's kappa, and confirmation genotyping of a specific ultra-rare mutation [9]. Use at least one external check.
- Ignoring the reference data layer. Tools that depend on databases inherit their gaps. The PICRUSt and Tax4Fun comparison showed taxa and functions visible to one tool and invisible to the other purely through their SILVA and Greengenes backends [7], and the metabolomics survey showed identifier coverage differing across nine databases with duplication risk in the largest ones [8]. Pin database versions in your methods.
- Evaluating usability after adoption. Labs frequently choose a tool because a paper cites it, then discover installation, documentation, and output problems after the pipeline depends on it. Task-based usability evaluation before adoption, borrowing the methods used in programming language research [1], prevents most of that cost.
- Forgetting that web tools drift. A web-based evaluation is a snapshot. The tuberculosis tool comparison evaluated five services at a defined point against 88 phenotypically characterized isolates [10], and any of those services could change afterwards. Record run dates and re-validate periodically.
- Confusing versatility with quality. A competition framework such as QComp scores performance, versatility, and usability separately because a tool that handles many model classes may do none of them best. Do not let breadth substitute for depth in the task you actually have.
- Assuming ensembling is indecision. Combining tools is sometimes the correct answer, whether the goal is a high-confidence CNV call set [3], a merged functional profile [7], or better metagenomic identification by pairing assembly tools with deep learning classifiers [14].
- Letting benchmarks age silently. Tools, databases, and hardware change. A comparison is valid for the versions tested, which is why every evaluation should report exact versions, and why a dated result should trigger a re-evaluation rather than a quote from memory.
One general limitation applies to the whole field: individual projects differ in sample characteristics, compute environment, and clinical context, so a published benchmark informs your evaluation design but does not replace running the tools on your own data.
Frequently Asked Questions
What does usability mean for a bioinformatics tool?
It means the combination of analytical correctness and human efficiency: how reliably the tool produces accurate results and how much effort, expertise, and troubleshooting a competent analyst needs to get there. The dimensions include installation, documentation, input and output formats, reproducibility, runtime, and support.
How do I evaluate a bioinformatics tool before adopting it?
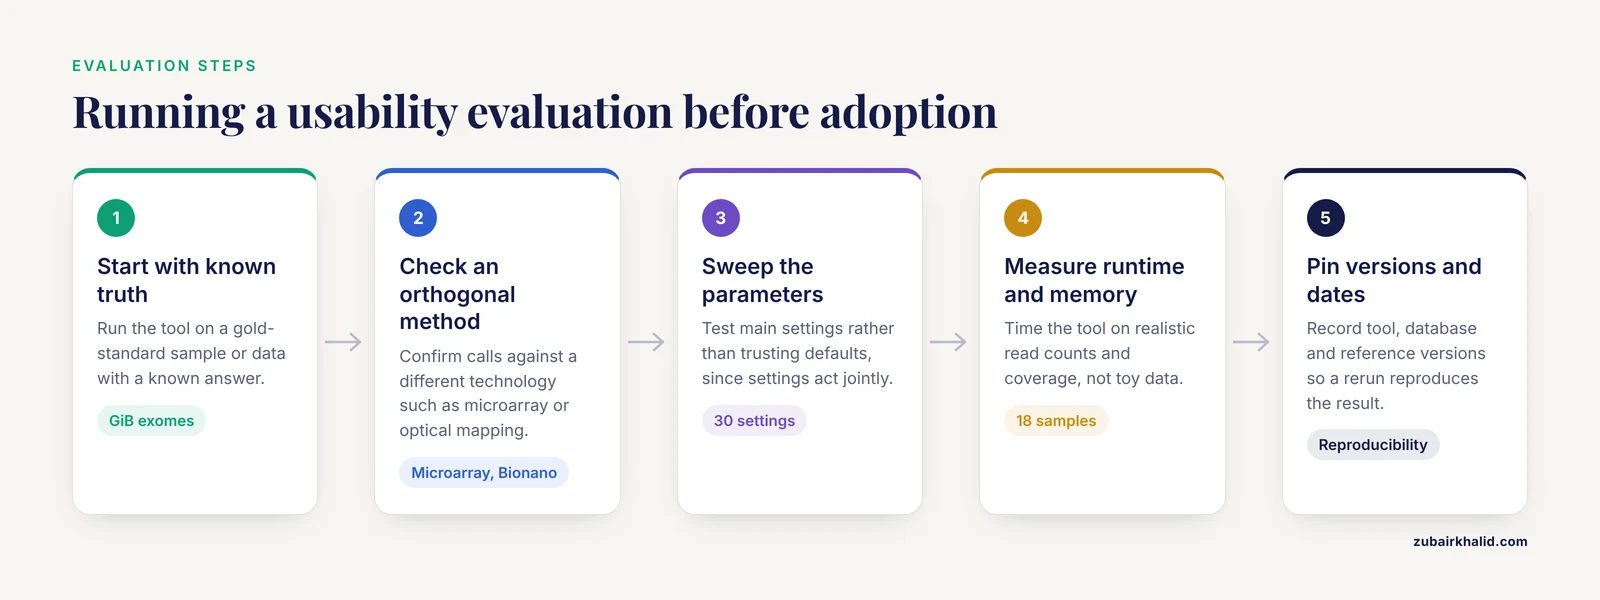
Run it on data with a known answer, either a gold-standard sample or data you can check by an orthogonal method, then measure accuracy, runtime, and reproducibility, and sweep the main parameters rather than trusting defaults. Studies that followed this template, such as the exome pipeline comparison on Genome in a Bottle samples [4] and the miRNA-seq parameter sweep [6], produced conclusions that held up.
Which published studies are good models for bioinformatics tools usability evaluation?
The cancer CNV benchmark that combined six callers with microarray and Bionano validation [3], the HLA-I prediction review with an independent set of 21,101 ligands across 19 allotypes [12], and the contamination detection survey comparing nine methods and five representative tools [15] are all strong templates, each for a different evaluation style.
Are web-based bioinformatics tools less reliable than command-line tools?
Not necessarily. In the tuberculosis resistance study, the web-based Mykrobe tool reached 98 percent agreement with phenotypic drug susceptibility testing and a Cohen's kappa of 0.941, comparable to what careful local pipelines achieve on the same task [10]. The real trade-off is control and version stability, not raw reliability.
What is the single most common mistake in comparing bioinformatics tools?
Testing on one dataset under default parameters and reporting the ranking as a general verdict. The CNV study showed that a genome with unusual ploidy reversed expectations for some callers [3], and the miRNA-seq study showed that parameter settings interact and change the ranking [6].
How many tools should I include in a comparison?
Enough to cover the design space, which is usually three to six. The CNV study used six callers [3], the contamination study moved from nine surveyed methods down to five compared in depth [15], and the toxicity prediction study compared seven in silico tools, finding VEGA the most accurate under a ten-fold error criterion on their validation chemicals [16]. Beyond that range, the marginal tool rarely changes the decision, and the evaluation cost grows faster than the insight.
Sources
- Proceedings of the 5th Workshop on Evaluation and Usability of Programming Languages and Tools
- The 2019 Comparison of Tools for the Analysis of Quantitative Formal Models - (QComp 2019 Competition Report)
- Evaluation of somatic copy number variation detection by NGS technologies and bioinformatics tools on a hyper-diploid cancer genome
- Evaluation of an optimized germline exomes pipeline using BWA-MEM2 and Dragen-GATK tools
- A systematic comparison of human mitochondrial genome assembly tools
- Evaluation of Bioinformatics Approaches for Next-Generation Sequencing Analysis of microRNAs with a Toxicogenomics Study Design
- Comparison of two bioinformatics tools used to characterize the microbial diversity and predictive functional attributes of microbial mats from Lake Obersee, Antarctica
- Evaluation and comparison of bioinformatic tools for the enrichment analysis of metabolomics data
- Rare Variants Imputation in Admixed Populations: Comparison Across Reference Panels and Bioinformatics Tools
- A precision overview of genomic resistance screening in isolates of Mycobacterium tuberculosis using web-based bioinformatics tools
- Evaluation of the Performance of BioNLP Tools for Discovering Causal Genes in Terms with Pathway Enrichment
- A comprehensive review and performance evaluation of bioinformatics tools for HLA class I peptide-binding prediction
- Evaluation in Monogenic Diabetes of the Impact of GCK, HNF1A, and HNF4A Variants on Splicing through the Combined Use of In Silico Tools and Minigene Assays
- Comparison between ribosomal assembly and machine learning tools for microbial identification of organisms with different characteristics
- A comprehensive performance evaluation, comparison, and integration of computational methods for detecting and estimating cross-contamination of human samples in cancer next-generation sequencing analysis
- Comparison of seven in silico tools for evaluating of daphnia and fish acute toxicity: case study on Chinese Priority Controlled Chemicals and new chemicals