Building a Bioinformatics Tool Comparison Matrix: A Template
By Dr. Zubair Khalid, DVM, MS, PhD ·

By the end of this guide you will have a working bioinformatics tool comparison matrix: a versioned spreadsheet plus a small benchmark harness that scores candidate tools against the same data, the same metrics, and the same weighting scheme. You will be able to defend your choice of tool in a methods section or a group meeting with numbers instead of intuition.
You will need the following installed and available:
- Python 3.10 or newer with pandas (install with
pip install pandas) - A conda-compatible package manager such as Miniforge, so each tool runs in its own isolated environment
- GNU coreutils,
wgetorcurl, andgit - Bedtools if your tools emit genomic intervals (install with
conda install -c bioconda bedtools) - Optional but recommended, Snakemake for wiring the benchmark together (
conda install -c bioconda snakemake)
Everything below uses small, real files and real commands. The tool-specific wrapper scripts are the only part you must adapt, because every tool documents its own flags, and copying flags from memory is how benchmarks go wrong.
Why a Matrix Beats Ad Hoc Tool Choice
Most bioinformatics fields now have more candidate tools than any one lab can evaluate deeply, and the published evidence for choosing among them is weaker than it looks. A 2026 review of antimicrobial peptide predictors found that existing studies rely on heterogeneous datasets and inconsistent evaluation protocols, which can produce data leakage and inflated performance estimates, and it called for explicit evaluation criteria and shared benchmark resources before tools can be compared fairly [1]. The same pattern shows up elsewhere. A systematic review of support vector machine models in cancer omics concluded that varied specimens, platforms, and validation designs limit direct comparison across studies, and that the authors therefore performed no pooled performance comparison [2]. A review of epitope prediction in venom research reached a similar verdict, noting that reporting inconsistencies, limited negative data, and variable study designs impair direct comparison, and that the field needs standardized frameworks covering dataset selection, algorithm parameters, and validation rigor [3].
A comparison matrix is the practical answer to that problem at the scale of one project. Building a bioinformatics tool comparison matrix forces three things that ad hoc selection skips. First, you must state the criteria before you see the results, which prevents post-hoc rationalization. Second, you must run every candidate through the same harness on the same data, which is the only way to produce comparable numbers. Third, you must record versions, parameters, and evidence for every cell, which is what makes the exercise reproducible rather than an opinion. Reviews of pangenome methods make the reproducibility point directly, since diverse analytical procedures introduce reproducibility challenges and the field has responded by proposing standard operating procedures and reporting criteria [4].
Step 1: Frame the Question Before You List Any Tools
The single most common failure in bioinformatics tools comparison is choosing tools before defining the task. Borrow a structure from clinical evidence synthesis, where reviews are organized around the PICOC framework, meaning Population, Intervention, Comparison, Outcome, and Context, a structure used explicitly in a recent technical review of AI methods for type 2 diabetes [5]. Translate those slots into bioinformatics terms and write one paragraph before opening a spreadsheet:
- Population (your data). What exact input will the tool see? For a protein predictor, is it full proteomes, mature peptides, or fragments? For an aligner, is it short reads, long reads, or assembled contigs?
- Intervention (the tool). What class of software, and at what version?
- Comparison (the benchmark). What reference truth set exists, and who curated it?
- Outcome (the metric). What single number would convince a skeptical colleague, and what secondary numbers support it?
- Context (your constraints). Hardware, wall-clock limits, license restrictions, and whether the tool must run in a container on your cluster.
Ground truth is the decisive item. A benchmark of alternative splicing tools illustrated this well by evaluating seven detection tools against three complementary datasets, including RT-PCR validated experiments, simulated data, and spike-in RNA variants that provide experimentally derived sequencing data with fully controlled ground truth [6]. Reviews of phosphorylation site predictors similarly emphasize that benchmark dataset preparation is a first-order design decision, not an afterthought [7]. If no ground truth exists for your task, that fact changes your whole plan, because you will need to create a small validated set yourself before any comparison is meaningful.
Write your framing paragraph at the top of a README.md in the project directory you create in Step 5. Every later decision should trace back to it.
Step 2: Build the Candidate Tool Inventory
Collect candidates before scoring anything. Useful sources in order of reliability are the tool's official documentation and source repository, the databases and repositories referenced by recent benchmark papers in your subfield, and curated repository listings in review articles. For annotation work, independent sources such as NCBI RefSeq releases coexist with pipeline predictions and manual curation, and comparing those sources is a recognized analysis task in its own right [8], so record where each candidate's reference data comes from as well.
For each candidate, record these fields in your matrix before you run anything:
- Name and exact version number
- Publication and year, plus whether the version you can install matches the published version
- License, since GPL, MIT, and proprietary terms affect redistribution in pipelines
- Implementation language and install method, including whether a container image exists
- Input and output formats, because format friction is real engineering cost
- Last release date and open issue count, as a rough maintenance signal
- Claimed runtime and memory, to sanity-check later measurements
A tool that cannot be installed reproducibly in a container earns a low score in the reproducibility criterion regardless of how well it performs in someone else's hands. Conversely, a tool with a plain documentation page but an active repository can outrank a flashy web server that has not accepted new sequences in two years.
Step 3: Choose Comparison Criteria and Definitions
Your criteria list is the scientific core of the matrix. Reviews that organize tools around explicit criteria are more useful than lists of features. A review of sequence and phylogenetic analysis methods organized alignment and tree-building approaches around core criteria of consistency, efficiency, robustness, and computational cost, and discussed explicit trade-offs in accuracy, memory, and scalability [9]. Use a similar structure adapted to your task.
The main criterion categories, with what counts as evidence for each:
| Category | Example criteria | Typical evidence you can collect |
|---|---|---|
| Performance | Accuracy, precision, recall, F1, AUROC | Scores against a shared truth set on held-out data |
| Robustness | Sensitivity to parameters, annotation quality, input noise | A grid of parameter settings, degraded annotations |
| Scalability | Runtime, peak memory, parallelism | Timed runs on one small and one full-size dataset |
| Usability | Install difficulty, CLI consistency, documentation quality | Time-to-first-result recorded by one team member |
| Reproducibility | Container availability, deterministic output, version pinning | Rerun in a fresh container, diff the outputs |
| Interoperability | Standard formats, API, pipeline integration | Whether output loads directly into your downstream stack |
| Maintenance | Release cadence, issue responsiveness, license | Repository history checked on a fixed date |
Two definitional pitfalls deserve their own paragraphs, because they silently corrupt matrices.
First, tools can disagree about what they are even measuring. In annotation comparison, the CDScompare authors showed that existing tools detect overlap, fusion, and boundary differences, but none took the reading frame into account, even though the same nucleotide segment read in a different frame encodes a completely different protein [8]. If your criteria say "agreement with reference" without saying whether agreement means coordinate identity, frame identity, or protein identity, different tools will look equally good under one definition and very different under another. Define the unit of comparison explicitly.
Second, tool families cluster by underlying principle, not by name. The low-complexity region benchmark ran eight detection methods under multiple parameter settings and found that Jaccard similarity matrices revealed distinct clustering patterns among algorithms based on shared detection principles [10]. Practical consequence: pick candidates that span more than one algorithmic family, because two near-identical neighbors inflate your apparent options without adding real choice. The same benchmark also showed that consensus regions detected by multiple tools tended to be longer, more repetitive, and compositionally purer, which suggests consensus is itself worth recording as a column in your results [10].
Step 4: The Bioinformatics Tool Comparison Template Format
This is the free bioinformatics tool comparison template you can copy directly. The format uses two flat CSV files rather than one giant spreadsheet, because criteria and tool scores change at different rates and version control handles flat text far better than binary spreadsheet formats. The same structure imports cleanly into Excel, Google Sheets, or R if you prefer a GUI for viewing.
The first file, criteria.csv, defines what you are scoring. Fill it in once and fight about it before benchmarks run, not after.
criterion,category,weight,definition,evidence_type
accuracy,performance,0.30,Agreement with the truth set on held-out data,precision_recall_f1
reproducibility,reproducibility,0.20,Identical output on rerun in a fresh container,rerun_diff
scalability,performance,0.15,Runtime and peak memory on the full-size dataset,timing_memory
maintenance,maintenance,0.15,Release cadence and issue responsiveness within 12 months,repo_history
interoperability,interoperability,0.10,Emits formats our downstream pipeline consumes directly,format_check
usability,usability,0.10,Time for one trained user to get a correct first result,minutes_to_result
documentation,usability,0.05,Complete parameter documentation and worked examples,manual_review
The second file, scores.csv, holds one score per tool per criterion, on a 1 to 5 scale where 1 means unusable for your context and 5 means excellent.
criterion,tool_a,tool_b,tool_c
accuracy,4,3,4
reproducibility,5,2,4
scalability,3,5,3
maintenance,4,3,2
interoperability,4,2,5
usability,3,4,5
documentation,4,3,4
Column definitions, so anyone on your team fills cells the same way:
criterion, unique short name, matches across both filescategory, one of the seven categories above, useful for subgroup reportingweight, a number between 0 and 1, all weights summing to 1.0definition, one sentence stating exactly what a high score meansevidence_type, the artifact that justifies the score, such as a metrics file or a timed log- Tool columns, integers 1 through 5, no half points, which keeps arguments honest
The notes column in a live matrix should link to files, for example results/accuracy.csv#L12, so every score is auditable. A matrix cell with no attached evidence is a rumor, not a result.
Step 5: Benchmark Every Tool on Shared Data With a Uniform Harness
Now replace opinion with measurement. The harness below is a small, reproducible scaffold. Its design follows the modular pattern used in the low-complexity region benchmark, where a computational framework systematically compared residue-centric and protein-centric characteristics across methods and parameter settings [10].
Create the project skeleton:
mkdir -p tool-matrix/{data,scripts,results,envs}
cd tool-matrix
git init
Expected output:
Initialized empty Git repository in /home/you/tool-matrix/.git/Give each tool its own conda environment so version conflicts never contaminate the comparison:
conda create -y -n tool-a -c bioconda python=3.11
conda create -y -n tool-b -c bioconda python=3.11
conda env export -n tool-a > envs/tool-a.yml
conda env export -n tool-b > envs/tool-b.yml
The exported YAML files are part of your evidence. Freeze them, because a benchmark that cannot state exact dependency versions cannot be rerun by anyone.
Next, wrap each tool in a uniform interface. Every wrapper takes the same two positional arguments, the input file and the output path, so the pipeline never knows tool-specific flags. The flag lines below are illustrative placeholders, and you must replace them with the flags documented in your actual tools' manuals:
#!/usr/bin/env bash
# scripts/run_tool_a.sh
set -euo pipefail
in="$1"
out="$2"
conda run -n tool-a tool-a-binary -i "$in" -o "$out"
#!/usr/bin/env bash
# scripts/run_tool_b.sh
set -euo pipefail
in="$1"
out="$2"
conda run -n tool-b tool-b-binary -in "$in" -out "$out"Run each tool under several parameter settings, not one. Running eight LCR detection methods under multiple parameter settings was a deliberate design choice in the published benchmark, because a tool's rank at default parameters may not hold at the settings that matter for your data [10]. A three-setting grid per tool is usually enough to see whether rankings are stable.
If you use Snakemake, the wiring is short and reruns only what changed:
TOOLS = ["tool_a", "tool_b"]

rule all:
    input: expand("results/{tool}.bed", tool=TOOLS)

rule run_tool:
    input: "data/query.fa"
    output: "results/{tool}.bed"
    shell:
        "scripts/run_{wildcards.tool}.sh {input} {output}"
Execute with:
snakemake --cores 4Expected output ends with:
Finished job 0.
2 of 2 steps (100%) done
For ground truth, prefer sources with controlled or experimentally validated status. Spike-in RNA variants served as the central ground-truth resource in the alternative splicing benchmark precisely because they provide real sequencing data with fully controlled composition [6]. Simulated data let you probe accuracy at known effect sizes, and experimentally validated sets anchor results in biology. Using at least two of the three protects you from the criticism that your benchmark simply inherited one tool's training data, which is exactly the leakage failure documented for antimicrobial peptide predictors [1].
Step 6: Compute Metrics the Same Way for Every Tool
Convert every tool's output to one common format, then score all outputs with one script. For interval-style outputs such as detected regions or predicted sites, the following script computes precision, recall, F1, and the Jaccard index, which is the same overlap statistic used to cluster algorithm families in the LCR benchmark [10].
#!/usr/bin/env python3
# scripts/score.py
"""Compare a tool's predicted intervals to a truth set in BED format."""
import sys

def load_bed(path):
    regions = set()
    with open(path) as fh:
        for line in fh:
            if line.startswith("#") or not line.strip():
                continue
            f = line.rstrip("\n").split("\t")
            regions.add((f, int(f[1]), int(f[10])))
    return regions

def hits(pred, truth):
    n = 0
    for c, s, e in pred:
        if any(tc == c and s < te and ts < e for tc, ts, te in truth):
            n += 1
    return n

pred = load_bed(sys.argv[1])
truth = load_bed(sys.argv[10])
tp = hits(pred, truth)
fp = len(pred) - tp
fn = len(truth) - tp
precision = tp / (tp + fp) if (tp + fp) else 0.0
recall = tp / (tp + fn) if (tp + fn) else 0.0
f1 = 2 * precision * recall / (precision + recall) if (precision + recall) else 0.0
jaccard = tp / (tp + fp + fn) if (tp + fp + fn) else 0.0
print(f"predictions={len(pred)} truth={len(truth)}")
print(f"TP={tp} FP={fp} FN={fn}")
print(f"precision={precision:.3f} recall={recall:.3f} F1={f1:.3f} jaccard={jaccard:.3f}")
Run it once per tool:
python scripts/score.py results/tool_a.bed data/truth.bed | tee results/tool_a.metrics.txt
python scripts/score.py results/tool_b.bed data/truth.bed | tee results/tool_b.metrics.txt
Expected output:
predictions=412 truth=398
TP=301 FP=111 FN=97
precision=0.731 recall=0.756 F1=0.743 jaccard=0.592
The metric formulas and when each one should drive a decision:
| Metric | Formula | Choose it when |
|---|---|---|
| Precision | TP divided by (TP plus FP) | False positives waste downstream lab work |
| Recall (sensitivity) | TP divided by (TP plus FN) | Missing a true site is the expensive error |
| Specificity | TN divided by (TN plus FP) | Negatives are well defined and plentiful |
| F1 | 2PR divided by (P plus R) | You need one balanced summary number |
| Jaccard index | TP divided by (TP plus FP plus FN) | You care about overlap between outputs, including tool-to-tool similarity |
| AUROC | Area under the ROC curve | Tools output ranked scores and thresholds are not fixed |
| Runtime, peak memory | Measured with /usr/bin/time -v | Dataset size is your binding constraint |
The script above counts any base overlap as a hit, which is deliberately naive. Real benchmarks usually require a reciprocal overlap fraction, for example at least 50 percent of both intervals, before calling a match. State your matching rule in the matrix, because a lenient rule flatters tools that overpredict and a strict rule flatters tools that underpredict.
For outputs that are not intervals, adapt the metric, not the principle. Clinical prediction reviews commonly report AUC-ROC, and a 2026 review of AI methods for type 2 diabetes reported AUC-ROC values ranging from 0.63 to 0.97 across 47 included studies, a spread that shows how much the dataset, not only the algorithm, drives headline numbers [5]. Meta-analysis can pool tool-level accuracy when studies report the same interpretable quantity, as in a systematic review of WGS-based tuberculosis drug resistance prediction that pooled tool-level sensitivity of 0.930 and specificity of 0.962 across seven tools, while drug-specific sensitivity ranged from 0.960 for rifampicin down to 0.860 for pyrazinamide [11]. That spread within a single well-studied field is your calibration for how much tool choice and subtask choice can matter.
For clustering-style outputs, concordance with a reference method can be summarized with the adjusted Rand index, the statistic used to compare FTIR typing against WGS-based bioinformatic comparison as the reference in a Serratia typing study [12].
Step 7: Turn Benchmark Results Into Matrix Scores
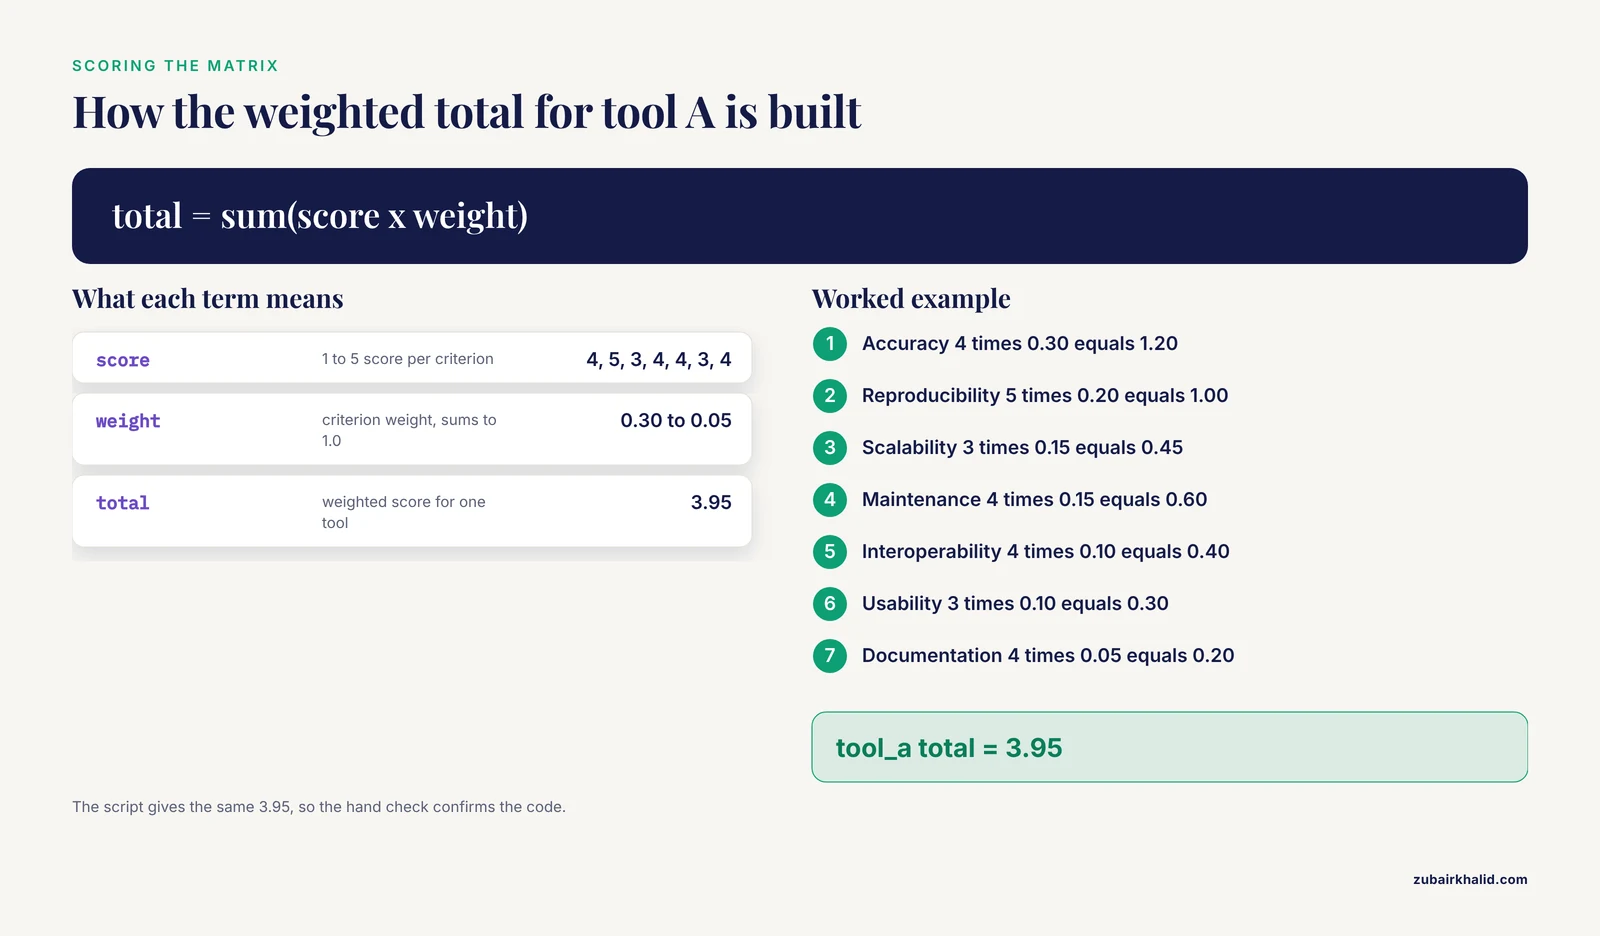
Raw metrics are not scores. You need two small transformations. First, normalize each benchmark metric to the 1 to 5 scale your matrix uses. Second, apply your weights and check that the ranking survives reasonable changes in weighting.
Normalize each metric across tools with min-max scaling, then rescale to 1 through 5:
import pandas as pd

metrics = pd.read_csv("results/all_metrics.csv", index_col="tool")
norm = (metrics - metrics.min()) / (metrics.max() - metrics.min())
scores_1to5 = 1 + 4 * norm
print(scores_1to5.round(2))
Expected output:
        accuracy  scalability  reproducibility
tool_a      5.00         1.00             3.50
tool_b      3.25         5.00             1.00
tool_c      1.00         3.75             5.00
Then compute the weighted total from criteria.csv and scores.csv:
criteria = pd.read_csv("criteria.csv")
weights = criteria.set_index("criterion")["weight"]
scores = pd.read_csv("scores.csv", index_col="criterion")
summary = scores.mul(weights, axis=0).sum().sort_values(ascending=False)
print(summary.round(2))
Expected output:
tool_a    3.95
tool_b    3.28
tool_c    3.60
Worked by hand for tool A: accuracy 4 times 0.30 equals 1.20, reproducibility 5 times 0.20 equals 1.00, scalability 3 times 0.15 equals 0.45, maintenance 4 times 0.15 equals 0.60, interoperability 4 times 0.10 equals 0.40, usability 3 times 0.10 equals 0.30, documentation 4 times 0.05 equals 0.20. The sum is 3.95, which matches the script.
Weights encode your project's priorities, so a rival with different priorities can rationally produce a different winner. Do not hide from that, test it. Perturb each weight by plus or minus 0.05, renormalize, and recompute the ranking:
import itertools

base = weights.copy()
stable = 0
for n in range(1000):
    trial = base + pd.Series(0.05, index=base.index) * pd.Series(
        [-1, 1][i % 2] for i in range(len(base))
    )
    trial = trial.clip(lower=0.01)
    trial = trial / trial.sum()
    if scores.mul(trial, axis=0).sum().idxmax() == summary.idxmax():
        stable += 1
print(f"top tool stable in {stable} of 1000 perturbed weightings")
Expected output:
top tool stable in 782 of 1000 perturbed weightingsIf the winner flips under small weight changes, your matrix is telling you the tools are genuinely close and the decision should rest on criteria the numbers cannot capture, such as team familiarity or support contracts. Record that finding rather than picking weights that produce the answer you wanted.
One further caution comes from the nanoinformatics literature, where a framework for comparing nanoparticle datasets was built specifically to compare materials quantitatively and globally rather than through a single property [13]. Score your tools across the full criterion set for the same reason. A tool that wins on accuracy alone but collapses on scalability is not the best bioinformatics software for your project, even if it tops one column.
Step 8: Check for Data Leakage and Bias Before You Trust the Numbers
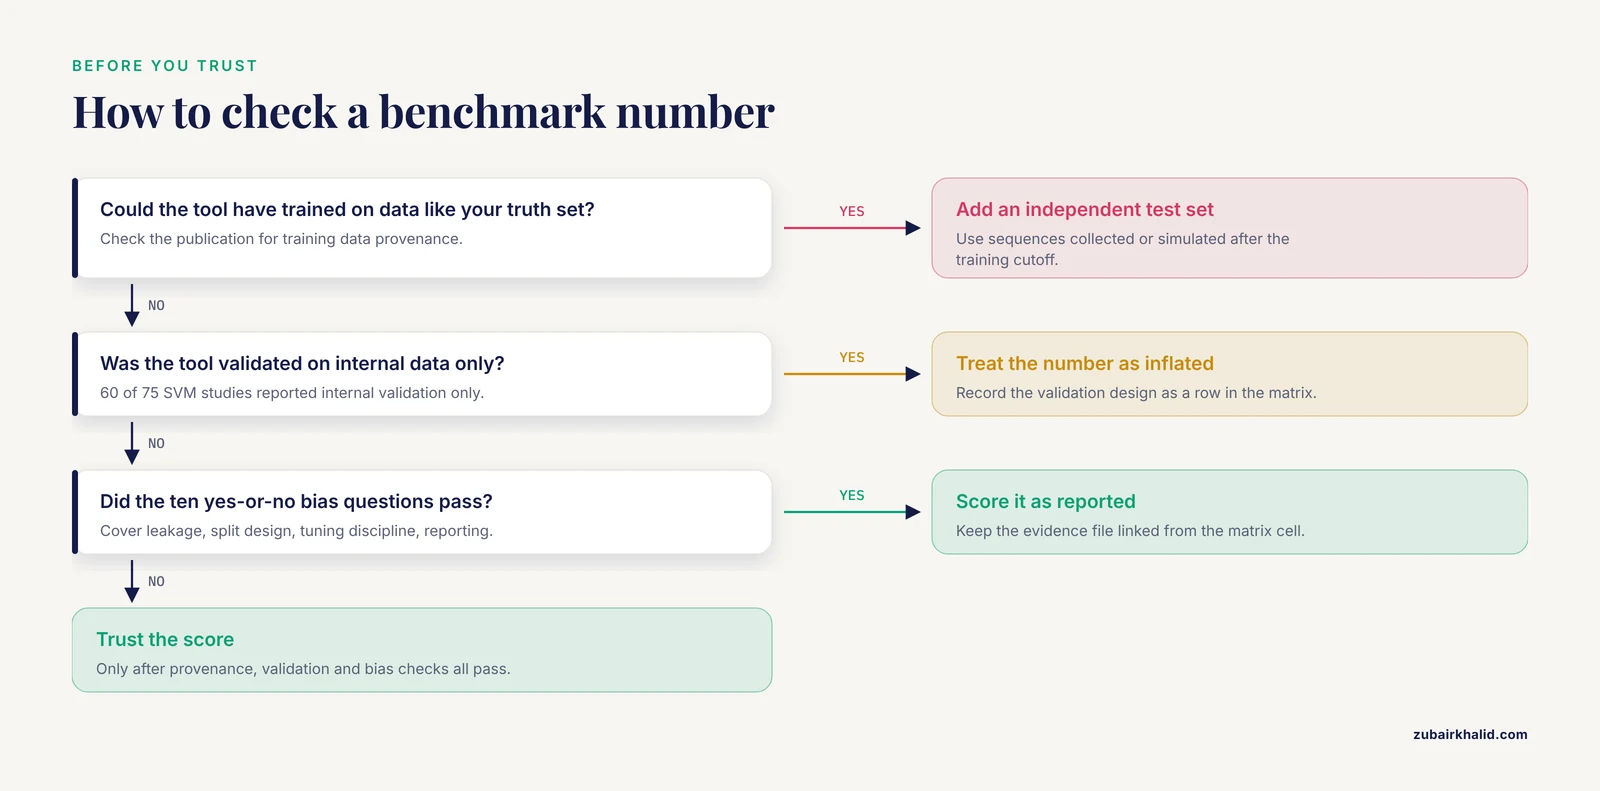
The most damaging benchmark failures are silent. The antimicrobial peptide review identified data leakage and inconsistent evaluation protocols as sources of inflated performance estimates, and built its evaluation framework specifically to address them [1]. Audit your own harness against the same failures:
- Leakage. If any candidate tool was trained on data similar to your truth set, its accuracy is inflated. Check each tool's publication for training data provenance. If overlap is possible, add a fully independent test set, ideally sequences collected or simulated after the tool's training cutoff.
- Validation design. In the systematic review of SVM models, 60 of 75 included studies reported internal validation only, and just 8 combined internal with external validation [2]. A tool validated once on one internal split has earned less trust than its reported number suggests. Ask whether your benchmark is an external test for each tool, and record the answer as a row in the matrix.
- Structured risk-of-bias checks. Clinical reviews use instruments such as PROBAST, the Prediction Model Risk Of Bias Assessment Tool, to grade each study's susceptibility to bias [2]. Epitope prediction reviews have used custom multi-question checklists for the same purpose [3]. Adopt the habit at project scale. Ten yes-or-no questions per tool, covering leakage, split design, parameter tuning discipline, and reporting completeness, take an hour and catch most inflated claims.
- Single-tool vs multi-tool thinking. In venom epitope prediction, strategies that combined multiple prediction tools, particularly sequence-based and structure-based models together, consistently outperformed single-tool approaches [3]. If your task allows it, add a consensus column to the matrix. Consensus is a competitor too, and the LCR benchmark results suggest consensus regions carry stronger structural or functional signals [10].
Step 9: Document, Version, and Publish the Matrix
A matrix that lives in one person's laptop spreadsheet dies at their next job. Finish the exercise with three artifacts.
First, a git repository containing the criteria file, scores file, all wrapper scripts, the environment YAML exports, the metrics outputs, and the README paragraph from Step 1. Tag the commit that corresponds to your decision, for example git tag -a matrix-v1 -m "tool decision for project X".
Second, a short methods paragraph you can paste into a paper or internal report. It should state the task, the truth set, the matching rule, the metric definitions, tool versions, and the weighting scheme with its sensitivity analysis. Reviews that propose standard operating procedures and reporting criteria for pangenome analyses are responding to exactly the reproducibility gap that informal tool choice creates [4].
Third, a results section that describes tools across multiple dimensions rather than a single headline number, in the spirit of frameworks built to visualize, describe, and compare complex datasets beyond any one property [13]. A one-line verdict such as "tool A had the best F1" is less useful to your successors than the full matrix plus the note that its ranking was stable in 782 of 1000 perturbed weightings.
Common Mistakes and Limitations
- Choosing tools before defining the task. Without the framing paragraph from Step 1, criteria become rationalizations. Write the population, comparison, outcome, and context first.
- Benchmarking on data a tool may have trained on. Leakage inflates accuracy and is common when public databases feed both training sets and test sets [1]. Always check provenance and hold out truly independent data.
- Comparing tools under different definitions of the output. Coordinate identity, frame identity, and protein identity are different claims about an annotation, and coordinate-only comparison misses functionally relevant conflicts [8]. Similarly, alternative splicing tools define events differently, so raw event counts are not comparable without harmonized definitions [6].
- Testing one parameter setting. Default settings flatter some tools and handicap others. Run a small parameter grid per tool, as the LCR benchmark did across eight methods [10].
- Relying on a single ground-truth source. Combine simulated data, spike-ins, and experimentally validated sets where available, since each covers different failure modes [6].
- Reporting a single metric as the verdict. Accuracy on one threshold, one drug, or one property hides real variation. Pooled TB resistance analyses varied by 10 sensitivity percentage points between drugs for the same tools [11], and rankings that flip under small weight changes signal a genuinely close race.
- Ignoring maintenance and license. An abandoned tool with a restrictive license is a future pipeline failure regardless of its benchmark scores.
- Trusting published numbers over your own runs. Systematic reviews repeatedly find heterogeneous designs that prevent direct comparison [2], [3]. Your matrix exists precisely because someone else's benchmark may not transfer to your data.
- Forgetting that algorithmic families cluster. Testing five tools from the same family measures one idea five times. Spread candidates across detection principles, as Jaccard clustering of LCR methods makes visible [10].
- Treating the matrix as permanent. Versions change, truth sets improve, and weights shift with project goals. Rerun the harness when a major tool version lands, and date every score.
Frequently Asked Questions
What is a bioinformatics tool comparison template?
A structured file, usually a spreadsheet or CSV pair, that lists candidate tools, explicit criteria, evidence for each score, and weights, so tool selection becomes a documented and reproducible decision instead of a preference.
Where can I get a free bioinformatics tool comparison template?
The two CSV blocks in Step 4 are the template, and you can copy them directly into any spreadsheet program or git repository at no cost.
How many criteria should my comparison matrix include?
Seven to twelve is practical. Fewer than seven hides real trade-offs, and more than twelve makes the weighting exercise arbitrary, since no team can gather evidence for forty criteria at project scale.
How do I pick the best bioinformatics software for my project?
Define the task and truth set first, benchmark every candidate on the same data with the same metrics, weight the criteria to your project's priorities, and check that the winner survives small changes in those weights.
Which metrics belong in a tool comparison matrix?
At minimum precision, recall, and F1 for accuracy, plus runtime and peak memory for scalability and a reproducibility check in a fresh container, with AUROC added when tools output ranked scores.
How do I avoid data leakage when benchmarking tools?
Check each tool's publication for training data provenance, exclude anything related to your truth set, and validate on a fully independent set that could not have informed any candidate's training.
How often should I update the matrix?
Rerun the benchmark when any candidate ships a major version, when your truth set changes, or at least annually, and record a dated score rather than overwriting the old one silently.
Can I trust published benchmark papers instead of running my own comparison?
Use them as a candidate list and as evidence for design choices, but published comparisons often use heterogeneous datasets and protocols that limit direct transfer, so run the shared harness on your own data before committing.
Sources
- Antimicrobial Peptide Databases and Prediction Tools: Toward a Standard Evaluation Framework.
- Support Vector Machine Models for Cancer Detection and Related Clinical Applications Using Omics and Omics-Adjacent Data: A Systematic Review.
- Computational immunology in venom research: a systematic review of epitope prediction and validation approaches.
- The grammar of the pangenome: terms, concepts, methods, and emerging patterns-a general framework for comparative genomics and genome biology.
- Artificial Intelligence Algorithms for Early Detection and Risk Stratification of Type 2 Diabetes Mellitus, Multimodal Bioinformatic Phenotyping, and Its Complications: A Technical Review of Classical Machine Learning, Deep Learning, and Post-Hoc Feature Attribution.
- EPBAM: annotation-robust detection of alternative splicing events and a systematic benchmarking of current tools.
- Empirical Comparison and Analysis of Artificial Intelligence-Based Methods for Identifying Phosphorylation Sites of SARS-CoV-2 Infection.
- CDScompare: a frame-sensitive GFF comparison tool for improved detection of coding sequence discrepancies, with applications to wheat and rice annotations.
- Revisiting Algorithms, Tools, and Applications for Sequence and Phylogenetic Analyses in the NGS-Based Omics Era.
- A benchmarking framework for comparative evaluation of low-complexity region detection tools in the human proteome.
- Algorithmic Determinants of Performance Heterogeneity in Whole-Genome Sequencing-Based Prediction of Drug Resistance in Mycobacterium tuberculosis: A Systematic Review and Meta-Analysis.
- Evaluation of Fourier transform infrared spectroscopy as a first-line surveillance typing tool for Serratia spp. isolates derived from clinical materials.
- "Visualize, Describe, Compare"─Nanoinformatics Approaches for Material-Omics.