How to Test a Bioinformatics Data Management Platform
By Dr. Zubair Khalid, DVM, MS, PhD ·

By the end of this guide you will be able to build a complete bioinformatics platform evaluation plan, run a controlled head-to-head test of a candidate data management platform against your own reference data, compute accuracy and reproducibility numbers from the outputs, and score the results in a format you can defend to a director, a grant reviewer, or an accreditation assessor.
You will need on hand before you start:
- A set of samples with known answers (a "truth set", meaning samples whose correct result has already been established by an accepted method). Examples include reference cell lines with published variant calls or clinical samples with culture-confirmed results.
- A small computing environment where you can run the candidate platform. A single workstation with at least 16 GB of RAM is enough for most pilot tests.
- Access to the candidate platform itself, whether it is installed locally, run in the cloud, or offered as a vendor-hosted service.
- A spreadsheet or a plain-text template for recording scores.
Nothing in this guide requires a dedicated cluster. Everything is designed so a two-person lab can execute it in a few weeks of part-time work.
Why a Structured Evaluation Plan Beats Ad Hoc Demoing
Most platform failures in bioinformatics are not analytical failures. They are selection failures. A team watches a sales demo, sees a beautiful report, signs a contract, and discovers six months later that the platform silently drops hard samples, cannot export raw outputs, or collapses when three users submit jobs at once.
A written bioinformatics platform evaluation plan prevents this by forcing three commitments before any money changes hands:
- You define the questions the platform must answer on your data, not on the vendor's showcase data.
- You define, in advance, the numeric threshold at which the platform passes or fails each question.
- You run every candidate through the same battery of tests, so the bioinformatics tools comparison is fair rather than anecdotal.
Published evaluations follow exactly this logic. When researchers evaluated the CosmosID platform for detecting bacteria in prosthetic joint fluid samples, they split 408 samples into a derivation set and a validation set of 204 samples each. They used the derivation set to establish detection cutoffs and then tested those fixed cutoffs on the untouched validation set [1]. That two-stage design, tune on one set and confirm on another, is the single most important structural feature to copy in your own plan. If you tune and test on the same samples, your accuracy numbers will be flatteringly wrong.
A second lesson from the literature is that the platform must be tested against a strong comparator, not against nothing. In a large evaluation of an automated MRSA genome analysis system, 781 genomes from 777 consecutive patients were processed by the automated system and by a bespoke researcher-led manual pipeline, and outputs were compared for species identification, mec gene detection, sequence type assignment, and pairwise relatedness defined as 25 or fewer single nucleotide polymorphisms (SNPs, differences in a single DNA letter between two genomes) apart [2]. The automated system achieved full concordance with the manual approach [2]. Without the manual pipeline as a benchmark, "the platform works" would have been an unfalsifiable claim.
The Twelve Evaluation Dimensions That Matter
A scoping review of workflow management system evaluations for bioinformatics users identified twelve recurring themes across 21 published evaluation papers and documentation for 55 available systems: Basic Computing, Functions, Security, Scalability, Cost/Efficiency, Sustainability, Usability, Learnability, Reproducibility, FAIRness, Flexibility, and Support [3]. FAIRness stands for Findability, Accessibility, Interoperability, and Reusability, a standard for how well data and software can be located, retrieved, combined, and reused.
| Theme | The question you must answer |
|---|---|
| Basic Computing | What hardware, operating system, and network does the platform require? |
| Functions | Does it perform the analyses your lab actually runs, end to end? |
| Security | Can it isolate users and data from each other and produce an audit trail? |
| Scalability | What happens when sample volume doubles or ten jobs run at once? |
| Cost/Efficiency | What does each sample cost in compute time, licenses, and staff hours? |
| Sustainability | Is the vendor or community likely to maintain it for years? |
| Usability | Can your intended users complete a real task without help? |
| Learnability | How long until a new staff member is productive? |
| Reproducibility | Do identical inputs produce identical outputs on repeat runs? |
| FAIRness | Can outputs be exported in open formats and reused elsewhere? |
| Flexibility | Can you add custom tools, parameters, or workflows? |
| Support | How fast and how competent is help when something breaks? |
The same review found a consistent pattern in how these themes get weighted. Evaluations that focused on noncomputational users favored graphical user interfaces (GUIs, point-and-click interfaces rather than typed commands) and platforms that provide built-in guidance, while evaluations written from the developer perspective favored text-based, code-first tools [3]. Know which population you are buying for before you score anything. A platform beloved by developers can be unusable for a technologist who has never opened a terminal.
A Bioinformatics Platform Evaluation Plan Template
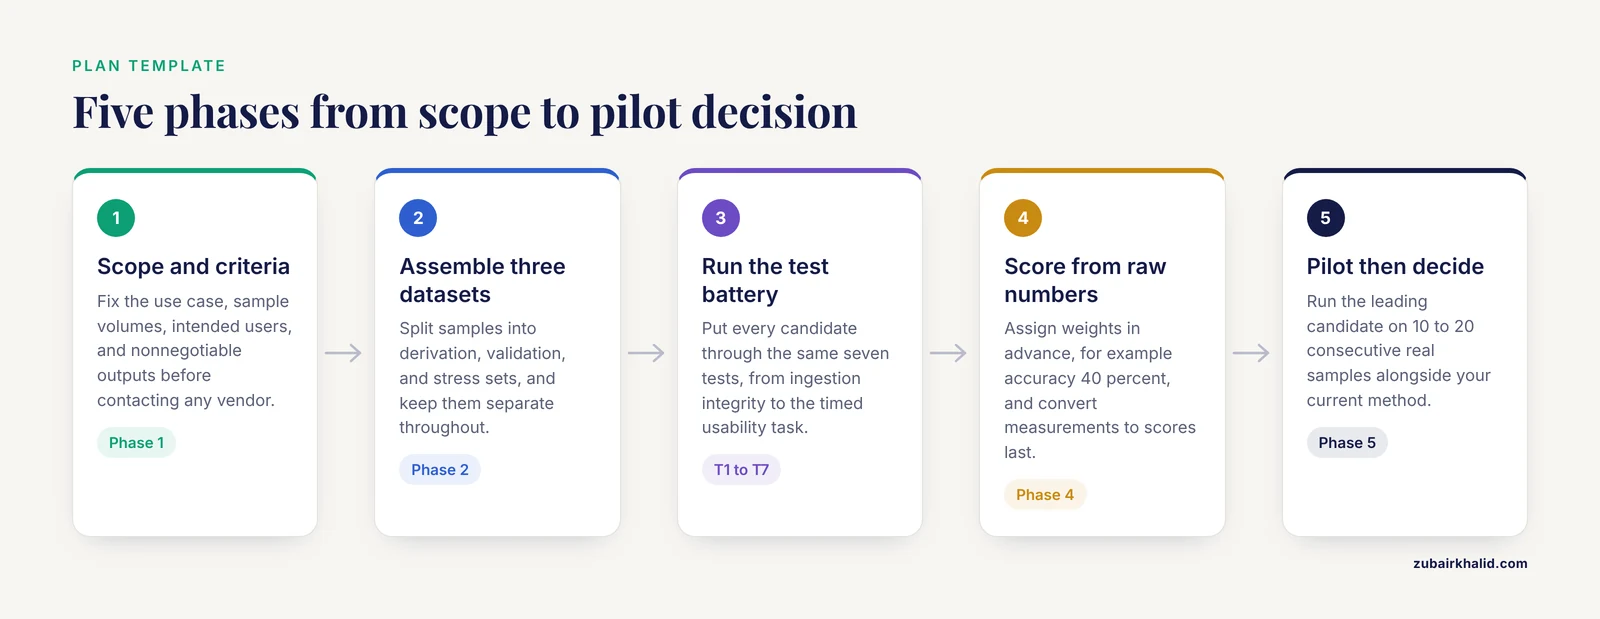
Here is a plan format you can copy directly into a document. It has five phases. Fill in the bracketed values for your lab.
Phase 1: Scope and Success Criteria
| Item | Entry (fill in) |
|---|---|
| Primary use case | Example: automated variant prioritization for clinical exome sequencing |
| Sample types and volumes | Example: 20 to 40 human exomes per month |
| Intended users | Example: two molecular technologists, one geneticist, no informaticist |
| Nonnegotiable outputs | Example: annotated VCF (Variant Call Format, the standard text format for listing genetic variants) plus a summary report |
| Compliance constraints | Example: institutional data security review required before upload |
Phase 2: Test Dataset Assembly
Assemble three datasets. Keep them separate and never mix them.
- Derivation set. Roughly half your samples. You may inspect results from this set while learning the platform and adjusting settings.
- Validation set. The other half. Lock it away until your settings are final, then run it once.
- Stress set. Deliberately difficult material, such as a genomically complex reference sample. Published benchmarking work used the hyper-diploid cancer cell line HCC1395, whose extra chromosome copies make copy number calling hard, precisely because easy genomes make every tool look good [4].
The derivation and validation split mirrors the design used in the CosmosID evaluation of 408 sonicate fluid samples, where cutoffs fixed on the derivation set were then tested on the validation set [1].
Phase 3: The Test Battery
Run every candidate platform through the same seven tests, described in detail in the walkthrough below.
| Test | What it measures |
|---|---|
| T1 Data ingestion and integrity | Does the platform accept your files intact? |
| T2 Analytical accuracy | Agreement with your truth set |
| T3 Reproducibility | Same input, same output, twice |
| T4 Throughput and runtime | Time and compute cost per sample |
| T5 Failure behavior | What happens with a corrupted or empty file |
| T6 Security and isolation | Who can see and change what |
| T7 Usability task | A timed realistic task by a real intended user |
Phase 4: Scoring
Assign each test a weight in advance, for example accuracy 40 percent, reproducibility 15 percent, throughput 15 percent, security 10 percent, usability 10 percent, support 10 percent. Record raw measurements first and convert to scores only at the end. This keeps the bioinformatics tools comparison honest, because you decide the formula before you see the numbers.
Phase 5: Pilot and Decision
Run the leading candidate on 10 to 20 consecutive real samples alongside your current method, in parallel, before any cutover. The five-year Galaxy experience in a French hospital laboratory, during which 6,970 patients were analyzed, is instructive here. The laboratory validated Galaxy incrementally and had its targeted exome sequencing method externally evaluated annually by the European Molecular Genetics Quality Network (EMQN), achieving mean sensitivity of 99 percent for single nucleotide variants and 93 percent for small insertions and deletions over the study period [5]. External quality assessment against a known benchmark, repeated on a schedule, is what turns a good demo into a defensible clinical or research operation.
Step-by-Step Testing Walkthrough With Real Commands
This walkthrough assumes a Unix-like environment (Linux or macOS). All commands operate on local files, so they work identically whether the candidate platform is cloud-hosted or installed on your own machine.
Step 1: Record the Environment
Every result you generate is meaningless unless it can be tied to a software version and configuration. Create an environment record first.
uname -a > environment.txt
python3 -V >> environment.txt
platform-cli version >> environment.txt
cat config.yaml >> environment.txt
Expected output in environment.txt:
Linux workstation 5.15.0-generic x86_64
Python 3.10.12
platform-cli 4.2.1
config: genome_build=GRCh38, panel=heme_v2
If the platform offers no way to print its own version and configuration, that is a finding in itself. Log it under Sustainability and Reproducibility.
Step 2: Verify Data Ingestion Integrity (Test T1)
Compressed sequencing files can corrupt during transfer. Before uploading anything, confirm integrity locally.
gzip -t batch1_R1.fastq.gz && echo "gzip integrity OK"
md5sum batch1_R1.fastq.gz batch1_R2.fastq.gz
Expected output:
gzip integrity OK
9e107d9d372bb6826bd81d3542a419d6  batch1_R1.fastq.gz
2d10b2a3a4c7e5f181a91c0b7e6a44d3  batch1_R2.fastq.gz
Count the reads so you can verify nothing was dropped on upload. Each sequencing read occupies four lines in a FASTQ file, so reads equal the line count of the second line of every four-line block.
zcat batch1_R1.fastq.gz | awk 'NR%4==2' | wc -lExpected output:
4,231,882Upload the file, then check whether the platform reports the same read count. A mismatch means the platform is trimming, filtering, or truncating without telling you, which you must know before interpreting any downstream result.
Step 3: Run the Analysis and Measure Runtime (Tests T2 and T4)
Run the platform on the derivation set while timing the job. The time utility captures wall-clock duration and peak memory.
time platform-cli run batch1/Expected output:
real    47m12.3s
user    31m44.9s
sys     3m02.1s
Record the wall-clock time per sample. For a realistic anchor, the hospital Galaxy installation reported that a batch of 23 samples from a targeted DNA sequencing run, from raw data to an annotated variant call file, generally took less than 2 hours for panels between 1 and 500 kilobases [5]. Your panel may be larger or smaller, but a candidate that takes days per batch when a published clinical installation processes 23 samples in under 2 hours on comparable scope needs an explanation.
Step 4: Score Accuracy Against the Truth Set (Test T2)
Export the platform's calls and compare them with your truth set. This Python script computes sensitivity (the fraction of true positives the platform finds) and precision (the fraction of platform calls that are actually true). Here we score a variant prioritization task in the style of a published evaluation in which 24 phenotype-explaining variants from 20 patients were uploaded to seven platforms and ranked against reference classifications built on American College of Medical Genetics and Genomics (ACMG) criteria [6].
Save this as score_accuracy.py:
import csv

truth = {}
with open("truthset.csv") as f:
    for row in csv.DictReader(f):
        truth[row["variant"]] = row["class"]

called = set()
tp = fp = 0
with open("platform_calls.csv") as f:
    for row in csv.DictReader(f):
        called.add(row["variant"])
        if truth.get(row["variant"]) == "pathogenic":
            tp += 1
        else:
            fp += 1

fn = sum(1 for v, c in truth.items()
         if c == "pathogenic" and v not in called)
sensitivity = tp / (tp + fn) if (tp + fn) > 0 else 0.0
precision = tp / (tp + fp) if (tp + fp) > 0 else 0.0
print("TP=%d FP=%d FN=%d" % (tp, fp, fn))
print("Sensitivity=%.3f Precision=%.3f" % (sensitivity, precision))
Expected output:
TP=21 FP=2 FN=1
Sensitivity=0.955 Precision=0.913
For a ranking-style platform, also record the rank at which each true variant appeared. In the published seven-platform comparison, the top-performing platform placed 19 of 24 variants at rank 1, four in the top 5, and one in the top 15, while two platforms failed to prioritize several variants and some platforms failed to detect a variant at all [6]. A platform that finds a variant but buries it at rank 40 has failed a clinical workflow even if its raw sensitivity is perfect. Record both detection and rank.
Step 5: Test Reproducibility (Test T3)
Run the identical input through the platform a second time and compare outputs byte for byte.
md5sum run1.vcf run2.vcf
diff run1.vcf run2.vcf && echo "byte-identical"
Expected output:
e5fa44f2b31c0fb5f15a8a40cf3a4b12  run1.vcf
e5fa44f2b31c0fb5f15a8a40cf3a4b12  run2.vcf
byte-identical
Differences between runs reveal nondeterminism, usually from parallel execution ordering or from databases that were updated between runs. Reproducibility is one of the twelve evaluation themes that recur across workflow system assessments [3], and it is a core design goal of platforms built specifically for reproducible research pipelines, which standardize the data layer, tool versions, and evaluation protocols so that results can be regenerated and fairly compared. A platform that cannot regenerate its own result is a platform you cannot defend in a manuscript or an audit.
Step 6: Test Failure Behavior (Test T5)
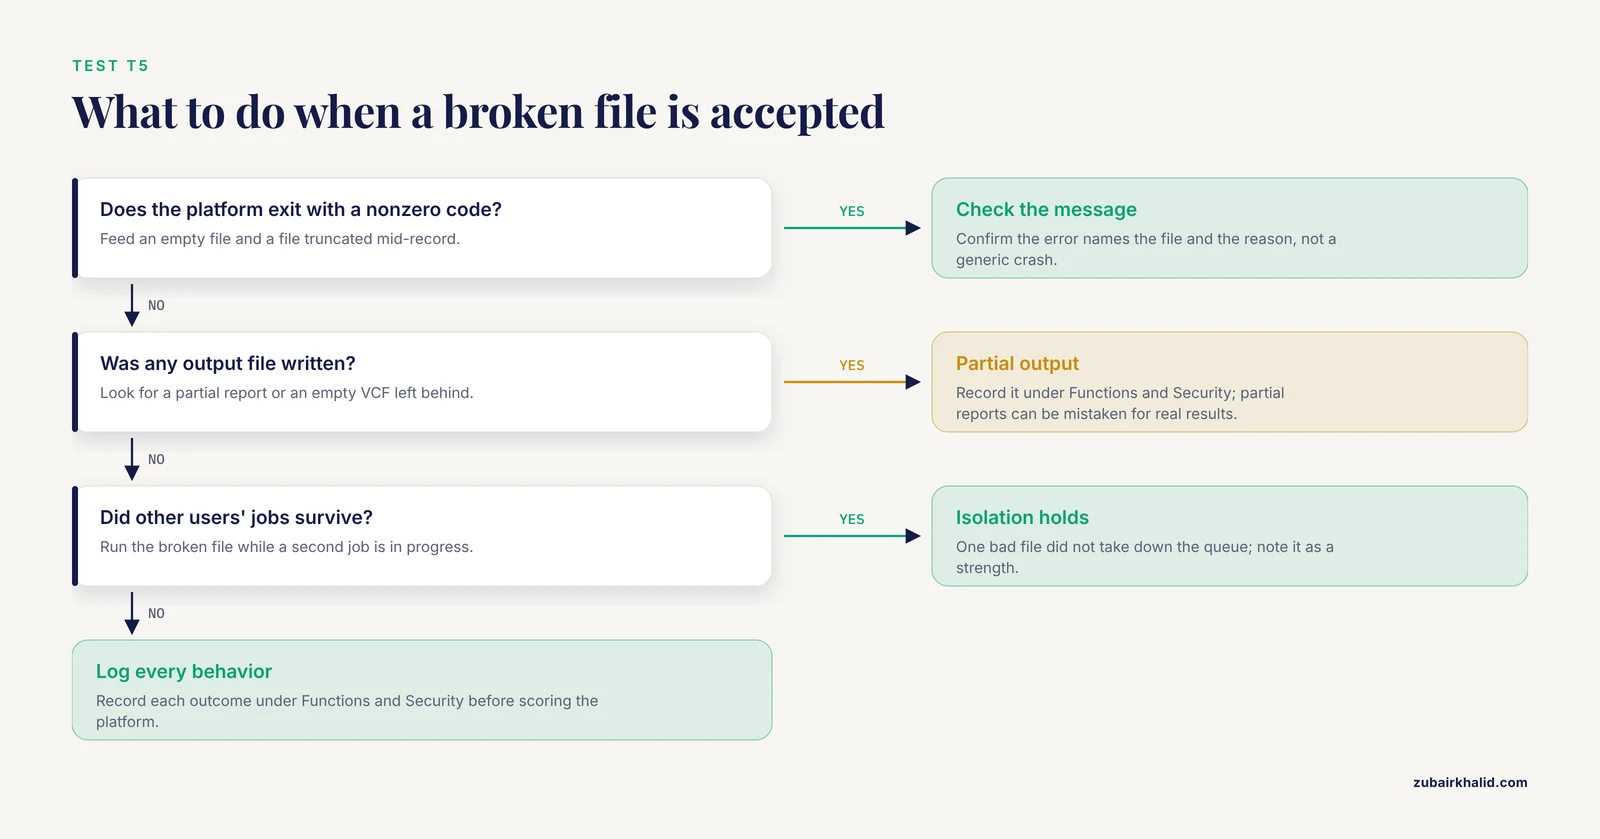
Deliberately feed the platform broken inputs and record what happens.
# an empty file
touch corrupted.fastq.gz
platform-cli run corrupted.fastq.gz
Desirable behavior is a clear error message, a nonzero exit code, and no output file. Undesirable behavior includes a silent success, a partial report, or a crash that takes down other users' jobs. Repeat with a file truncated mid-record.
head -c 1000000 batch1_R1.fastq.gz > truncated.fastq.gz
platform-cli run truncated.fastq.gz
echo "exit code: $?"
Record each behavior in your scoring sheet under Functions and Security.
Step 7: Run the Validation Set Once
Now unlock the validation set. Fix all settings, run once, and score. Do not go back and adjust parameters after seeing validation results, because that converts your validation set into a second derivation set and invalidates the accuracy estimate. This is the design discipline demonstrated in the sonicate fluid metagenomics study, where cutoffs established on the derivation set were carried unchanged into validation [1].
Step 8: Concurrency and Load (Test T4 Extended)
Submit several jobs at once and watch what happens to runtime and to other users.
for s in sample_A sample_B sample_C sample_D
do
  platform-cli run $s &
done
wait
If runtime per job inflates badly under four concurrent jobs, record it. Grid-style deployments have been evaluated specifically for how they behave as shared infrastructure under multiuser load [7], and a platform that degrades gracefully with a clear queue is more usable than one that thrashes silently.
Performance, Scalability, and Security Testing
Scalability in Practice
Scale behavior matters at the level of your worst busy week, not your average day. The practical test is the concurrency loop above, repeated at a volume matching your peak. Watch three things: whether runtime per sample inflates, whether any job fails outright, and whether the platform gives you visibility into the queue. Observability, meaning the ability to see what is running, what failed, and why, was one of the explicit architectural requirements in a cloud-native bioinformatics platform built for enterprise deployment, alongside tenant isolation and auditable tool execution [8].
Security Questions With Concrete Answers Required
For any platform that holds human or proprietary data, convert security from a vendor checkbox into a demonstration. A cloud architecture paper designed for multi-tenant LLM agents lists the problems that a serious platform must solve together: multi-tenant data isolation, auditable tool execution, and controlled access to shared data resources [8]. Ask each vendor, and test where you can:
- If user A uploads data, can user B, on the same instance, see or list it? Test this yourself with two accounts if the platform is self-hosted.
- Can every data access and tool execution be traced to a user, a timestamp, and a dataset?
- Is data encrypted in transit and at rest, and who holds the keys?
- Can data be permanently deleted, with documentation, when a project ends?
Data security surfaced as a real challenge, alongside training needs, in a mixed-methods study of the Galaxy platform across fifteen clinical users, even as those users reported high satisfaction with the interface and improved workflow efficiency [9]. Security friction and usability friction tend to trade off against each other. Your scoring sheet should carry both, so a platform cannot hide a security gap behind a polished interface or the reverse.
Usability, Learnability, and the Human Factor
A timed usability task is the cheapest high-yield test in the whole plan. Pick one realistic task, for example "upload this paired-end sample, run the standard pipeline, and export the annotated report", and hand it to a staff member who has never used the platform. Time it. Count the number of external help queries they need.
The evidence base here is consistent. The scoping review of workflow management evaluations found that usability, learnability, and the availability of guidance were the themes that separated platforms adopted by life scientists from platforms used only by developers [3]. A cross-platform graphical tool for CRISPR indel analysis was built specifically because command-line indel analysis required bioinformatics training that many wet-lab researchers lacked, and its own evaluation emphasized simple installation and click-and-run operation alongside shorter runtimes than comparable tools [10]. If your users are technologists rather than informaticists, GUI quality and guidance are not conveniences. They are adoption-critical features, and a platform that fails the timed task will fail in production no matter what its benchmark numbers say.
A Worked Example: Two Candidate Platforms, One Scored Comparison
Here is a filled-in example using the plan format above, for a small molecular diagnostics laboratory choosing between Platform A (vendor-hosted) and Platform B (self-hosted open source). The numbers are illustrative of the method. In your real evaluation, every number must come from your own runs.
| Criterion (weight) | Platform A | Platform B |
|---|---|---|
| Sensitivity, validation set (40%) | 0.955 | 0.917 |
| Precision, validation set (folded into accuracy) | 0.913 | 0.940 |
| Byte-identical repeat runs (15%) | No, report changed between runs | Yes |
| Runtime per 23-sample batch (15%) | 1.4 h | 5.2 h |
| Timed usability task, new user (10%) | 22 min, no help | 71 min, 3 help queries |
| Export to open VCF and audit log (10%) | Partial, proprietary summary format | Full |
| Security demonstration (10%) | Vendor documentation only | Tested, isolation confirmed |
Accuracy on the validation set dominates, so Platform A wins the accuracy-heavy weighting. But the repeat-run discrepancy on Platform A is a serious reproducibility finding that demands an explanation from the vendor before signature. Note also that the runtime comparison requires context from published experience: a clinical laboratory sustained sub-2-hour batches on an open-source platform for years [5], so a vendor claiming that 5 hours per batch is unavoidable should be asked what their bottleneck actually is.
If your evaluation covers a niche application, look for domain-specific published head-to-heads before designing your own. For copy number variation (CNV, gains or losses of chromosome segments) calling, a benchmark of six recent tools on the HCC1395 genome, cross-checked against microarray and optical mapping methods, found generally consistent results for copy gain, loss, and loss of heterozygosity but showed that some tools made excessive calls when genome ploidy (the total number of chromosome copies) was misestimated [4]. Borrowing a published benchmark's sample and comparator design is faster and more defensible than inventing one.
Interpreting Results Against Published Performance
Once your numbers exist, contextualize them against published evaluations of the platform or of its class, using the same metrics.
- Platforms reporting sensitivity near 99 percent for single nucleotide variants and 93 percent for small insertions and deletions in a clinical laboratory setting, as documented over five years of Galaxy use with external quality assessment [5], represent a realistic target for mature targeted sequencing workflows.
- Full concordance between an automated system and a manual expert pipeline across 781 MRSA genomes [2] shows what "the automated platform is ready" looks like in genomic epidemiology. Anything short of concordance with your expert comparator should be quantified, not waved away.
- In the metagenomic setting, the CosmosID evaluation measured not just organism detection but also resistance gene detection for predicting staphylococcal susceptibility, and the derivation-validation structure let the authors report performance on unseen samples [1]. If the platform must support a downstream clinical decision, test that decision, not just the raw detection.
- End-to-end clinical platforms can also be validated against routine culture. The MYcrobiota profiling platform confirmed bacterial DNA in 37 of 37 culture-positive clinical samples among 47 samples tested, with detection in a minority of culture-negative samples [11]. Culture as a comparator is imperfect, since culture can miss nonviable or fastidious organisms, but it is an accepted and interpretable reference point.
A platform whose published numbers cannot be approached on your own data is telling you something about your sample type, your input quality, or the marketing. All three are findings worth having before the contract is signed.
Common Mistakes and Limitations
Tuning and testing on the same samples. This is the most common and most damaging error. Any accuracy number computed on the data used to choose settings is optimistic. Always split derivation from validation, as in the 408-sample metagenomics evaluation [1].
Benchmarking on easy data only. A clean, well-behaved reference sample flatters every tool. Include a genomically difficult sample, the way CNV benchmarking included the hyper-diploid HCC1395 line and showed that some callers misjudge ploidy and overcall changes [4].
Testing the algorithm and ignoring the operations. Runtime under load, queue behavior, failure modes, and export fidelity determine whether the platform survives contact with a real week of work. The concurrency test in Step 8 and the failure tests in Step 6 exist because platforms routinely pass accuracy checks and fail operational ones.
Trusting the vendor's report format as your ground truth. Proprietary summary reports can hide calls, filter variants, or reorder results. Always obtain the raw output (VCF, feature table, or equivalent) and score from that. The variant prioritization study that found platforms failing to prioritize or even detect known variants [6] only succeeded because the evaluators scored against ACMG-based reference classifications rather than against each platform's own summary.
Letting one enthusiastic user be the usability assessment. A single power user will make any tool look learnable. Use a genuinely new user for the timed task, and, where possible, gather structured feedback from several roles the way the Galaxy clinical study combined survey data and interviews across fifteen participants in diverse roles [9].
Ignoring export and FAIRness until later. Data locked in a proprietary database becomes a liability at contract renewal. Test export of both raw outputs and metadata on day one.
Treating a single evaluation as permanent. Platforms update, reference databases change, and your sample mix drifts. Schedule revalidation on a fixed cycle and after any major platform version change, in the spirit of the annual external quality assessment maintained in the five-year clinical Galaxy deployment [5].
One general limitation applies to all of the above. The plan tells you how a platform performs on your samples, your volumes, and your users. Translating any result into a diagnostic or operational decision requires domain-specific professional oversight.
Frequently Asked Questions
What is a bioinformatics platform evaluation plan?
It is a written document that defines your use case, test datasets, pass or fail thresholds, test procedures, and scoring weights before you test a candidate platform. It turns a subjective vendor demo into a controlled, repeatable experiment whose results you can defend to reviewers, leadership, or auditors.
How long should a platform evaluation take?
For a small laboratory, plan on two to six weeks of part-time effort for the test battery plus a one- to two-week parallel pilot. Published evaluations of a single platform have run for years with annual revalidation, so treat the initial plan as the first round of an ongoing program rather than a one-time event.
How many samples do I need for a meaningful evaluation?
Use enough that your accuracy estimate has a usable confidence interval, which for most variant or detection tasks means dozens of samples rather than a handful. Practical anchors from the literature include 24 characterized variants across 20 patients for a prioritization comparison, 47 clinical samples for a microbiota platform versus culture, and 408 samples split into derivation and validation halves for a metagenomic platform.
How do I measure analytical accuracy?
Run the platform on your validation set, export raw calls, and compute sensitivity and precision against your truth set using a fixed script. For ranking platforms, also record the rank of each true positive. Never compute accuracy on samples you used to adjust settings.
What is the difference between benchmarking and validation?
Benchmarking compares multiple tools against each other on the same data, often using a public reference sample. Validation demonstrates that a single chosen platform meets your predefined performance criteria on your own data. Most labs need both, benchmarking first to narrow the field, validation afterward to confirm the finalist.
Should I choose an open-source platform like Galaxy or a commercial one?
Choose based on your scored results, not on licensing philosophy. Galaxy's five-year clinical deployment shows open-source platforms can sustain high-throughput diagnostic work, while commercial platforms sometimes win on usability and support for nonexpert users. Run the same test battery on both and let the weights you set in Phase 4 decide.
What security questions should I ask a vendor?
Ask for demonstrated tenant isolation, complete audit trails of data access and tool execution, encryption in transit and at rest with documented key custody, and verified deletion at project end. Where the platform is self-hosted, test these yourself with two accounts rather than accepting documentation alone.
How do I compare several platforms fairly?
Fix the test battery, the datasets, and the scoring weights in writing before running anything, then run every candidate through identical tests on identical data and score from raw outputs only. Published multi-platform comparisons, such as the seven-platform variant prioritization study, show that identical inputs and fixed reference classifications are what make the comparison interpretable.
Sources
- Evaluation of the CosmosID Bioinformatics Platform for Prosthetic Joint-Associated Sonicate Fluid Shotgun Metagenomic Data Analysis
- Large-Scale Evaluation of a Rapid Fully Automated Analysis Platform to Detect and Refute Outbreaks Based on MRSA Genome Comparisons
- A scoping review of approaches to evaluating workflow management systems for bioinformatics users
- Evaluation of somatic copy number variation detection by NGS technologies and bioinformatics tools on a hyper-diploid cancer genome
- Galaxy Is a Suitable Bioinformatics Platform for the Molecular Diagnosis of Human Genetic Disorders Using High-Throughput Sequencing Data Analysis. Five Years of Experience in a Clinical Laboratory.
- Evaluating seven bioinformatics platforms for tertiary analysis of genomic data from whole exome sequencing in a pilot group of patients
- The deployment and evaluation of a bioinformatics grid platform - The HUST_Bio_Grid
- Cloud Computing Architectures for Multi-Tenant LLM Agents in Enterprise Environments: The Cineca Agentic Platform for Secure Bioinformatics Knowledge Graph Querying
- Evaluation of Galaxy as a User-friendly Bioinformatics Tool for Enhancing Clinical Diagnostics in Genetics Laboratories
- CRISPR-GRANT: a cross-platform graphical analysis tool for high-throughput CRISPR-based genome editing evaluation
- Development and evaluation of a culture-free microbiota profiling platform (MYcrobiota) for clinical diagnostics