How to Choose the Right R Package for Phylogenetic Analysis
By Dr. Zubair Khalid, DVM, MS, PhD ·

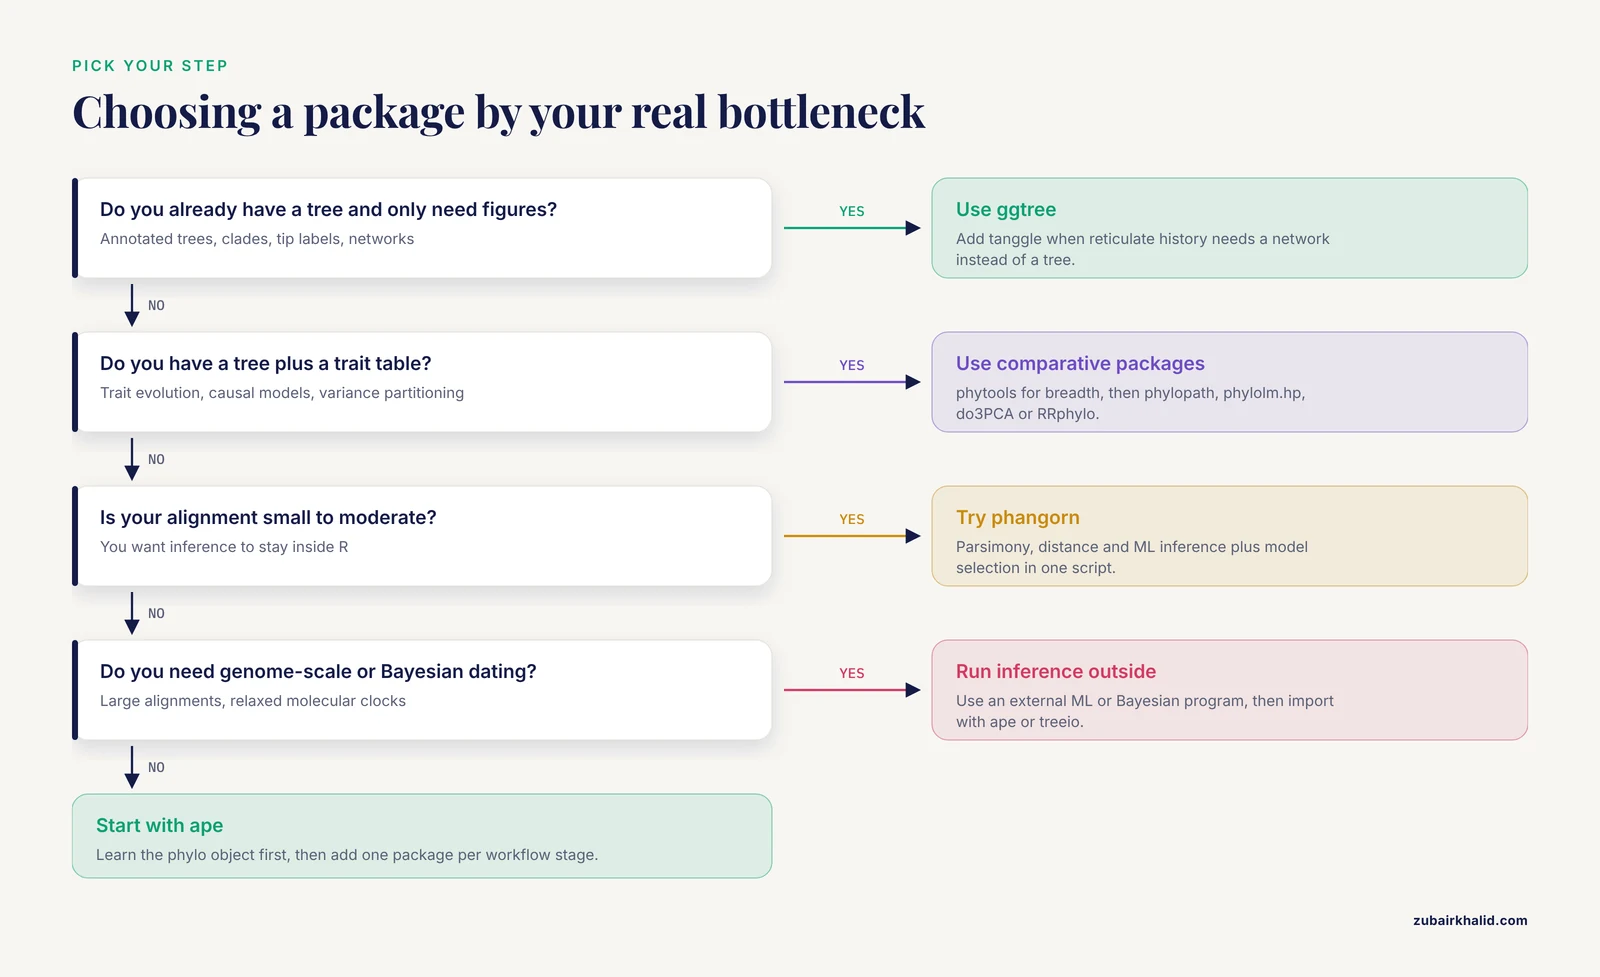
No single R package does everything in a phylogenetic analysis, so the right choice depends on which step of the workflow you are standing in. The rule of thumb is simple. Pick one package for tree input, output, and manipulation, one package for inference or comparative statistics, and one package for graphics. Then confirm each is actively maintained on CRAN or Bioconductor before you build a pipeline around it.
This guide compares the strongest R packages for phylogenetic work, explains what each one is actually good at, and walks through worked scenarios so you can match a package to your own data. If you searched for the best R package for phylogenetic analysis hoping for one answer, the honest answer is that the winner changes with the question. A chloroplast genome study, a 16S amplicon survey, and a comparative analysis of body size across mammals need different tools.
What Phylogenetic Analysis in R Actually Covers
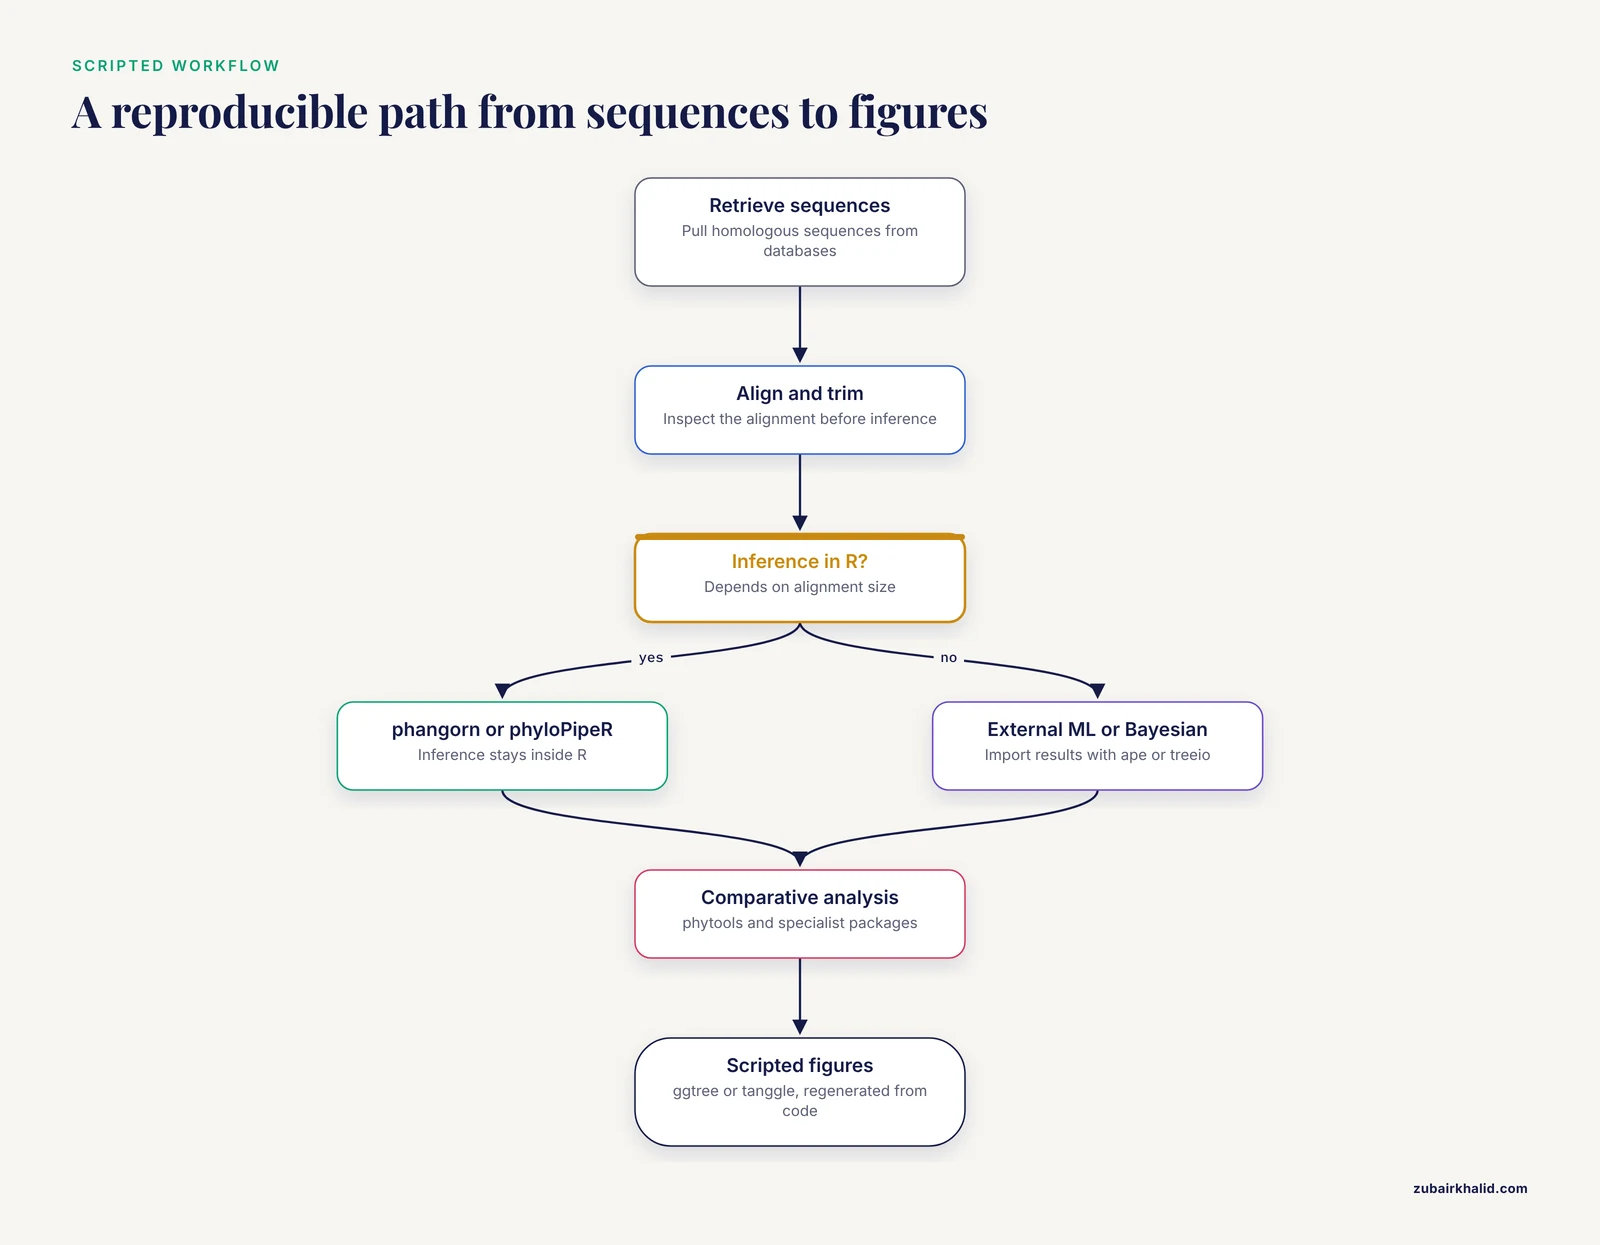
Before comparing packages, separate the tasks that get lumped under "phylogenetic analysis." A phylogenetic tree is a branching diagram describing ancestor-descendant relationships among taxa, and the analysis pipeline usually includes these stages.
- Sequence retrieval and preparation. Pulling homologous sequences from databases, checking orthology, and cleaning raw data.
- Multiple sequence alignment. Lining up homologous positions across taxa. A multiple sequence alignment (MSA) is the matrix of aligned sequences that every tree inference method consumes.
- Alignment trimming and masking. Removing poorly aligned or saturated columns.
- Tree inference. Building the tree from the alignment using distance methods such as neighbor-joining, maximum parsimony, maximum likelihood (ML), or Bayesian inference.
- Support and comparison. Bootstrap or posterior support values, comparing alternative topologies quantitatively.
- Downstream analysis. Trait evolution models, comparative methods, diversification rates, phylogenetic generalized linear models, phylodynamics.
- Visualization. Publication-quality figures, including trees, networks, and annotated plots.
R is genuinely strong at steps 5 through 7 and increasingly capable at steps 2 through 4. R for bioinformatics has become the default environment for the statistical side of evolutionary biology, which is why the R package ecosystem for phylogenetics has grown so large. The practical consequence for package choice is that you should decide first whether your bottleneck is inference, statistics, or graphics, because different packages dominate each.
The Comparison Table: Best R Package for Phylogenetic Analysis Options
This table is the core of the article. Read the row that matches your bottleneck, then read that package's section below.
| Package | Main job | Key strengths | Main limits | Choose it when |
|---|---|---|---|---|
| ape | Tree I/O, manipulation, distance methods | The foundation most phylogenetic R packages build on, reads and writes Newick and NEXUS, neighbor-joining, basic bootstrap | ML inference is not competitive with dedicated external programs for large alignments | You need to read, write, prune, reroot, or compare trees inside R |
| phangorn | ML and parsimony inference in R | Model selection, likelihood and parsimony searches, ancestral state reconstruction | Slower than external ML programs on large datasets | Your alignment is small to moderate and you want the whole analysis in R |
| phytools | Comparative methods and trait evolution | Very broad function set for continuous and discrete traits on trees, many plotting tools | Breadth over depth, some methods are research-grade | You have a tree and want to model trait evolution on it |
| ggtree | Tree graphics with ggplot2 | Publication-quality annotated figures, layers, integrates with treeio for many tree formats | Graphics only, no inference | You need figures for a paper or thesis |
| tanggle | Phylogenetic network visualization [1] | Extends ggtree to reticulate relationships, accepts DNA sequences to extended Newick, inherits ggplot2 flexibility | Visualization only | Horizontal gene transfer, hybridization, or introgression means a bifurcating tree is the wrong figure |
| phyloPipeR | End-to-end reconstruction and comparison [2] | Ortholog retrieval through tree inference and quantitative comparison in one framework, supports concatenation and coalescent strategies for multi-gene data | Newer package with less community history | You want one reproducible pipeline instead of gluing five tools |
| phylopath | Phylogenetic path analysis [3] | Compares competing causal models with phylogenetic control, supports binary variables, GPL-3, on CRAN | Narrow scope, path analysis only | You have observational comparative data and several causal hypotheses |
| phylolm.hp | Variance partitioning in phylogenetic GLMs [4] | Partitions likelihood-based R2 contributions among phylogeny and predictors, handles continuous and binary traits | Requires a fitted phylogenetic GLM first | You need to show which predictor mattered relative to shared ancestry |
| RRphylo | Phylogenetic ridge regression [5] | Trait evolution rates and ancestral states with high-dimensional trait data | Newer method, read the methods papers before use | You have many traits relative to your number of species |
| do3PCA | Probabilistic phylogenetic PCA [6] | Model-based axis selection with AIC among Brownian motion, OU, Early Burst, and Pagel's lambda, accounts for dimensionality-reduction noise | PCA scope only | You need dimension reduction that explicitly respects the phylogeny |
| markophylo | Markov chain models on trees [7] | Fits discrete trait and rate models on phylogenies | Niche focus | Your hypothesis is explicitly a stochastic process on a tree |
| treestructure | Detecting population structure in trees [8] | Coalescent-based statistical test on time-scaled trees, available on CRAN | Requires a time-scaled tree as input | You suspect unobserved structure in a pathogen or population tree and have no geographic metadata |
Matching the Package to the Workflow Stage
Tree Input, Output, and Manipulation: ape
The ape package (Analysis of Phylogenetics and Evolution) is the load-bearing package of R phylogenetics. Most other packages in this list either depend on ape or use its tree object class, the phylo object. If you learn only one package's data structures, learn this one.
ape handles reading and writing tree files in Newick and NEXUS formats, computing distance matrices, neighbor-joining trees, simple bootstrap analysis, and an enormous range of tree manipulation operations such as pruning taxa, rerooting, dropping tips, and computing branch lengths. A typical opening move in any phylogenetic R session looks like this.
library(ape)
tree <- read.tree("my_tree.nwk")
plot(tree, cex = 0.6)
n_tips <- length(tree$tip.label)
The honest limitation is inference performance. ape's maximum likelihood implementation is fine for teaching, exploration, and moderate datasets, but for a serious ML search on hundreds of taxa you will generally run a dedicated external program and bring the resulting tree back into R with ape. That division of labor is normal and mature, and it works well.
Inference Inside R: phangorn
phangorn extends ape with maximum parsimony, maximum likelihood, and distance-based tree inference, plus model selection and ancestral state reconstruction. For a moderate alignment, a compact phangorn session can go from aligned sequences to a scored ML tree without leaving R.
library(phangorn)
dat <- read.phyDat("alignment.fasta", format = "fasta")
mt <- modelTest(dat, model = c("jc", "gtr", "gtr+g"))
best <- mt$model[which.min(mt$AIC)]
fit <- pml_ml(optimize_pml(pml(tree = nj(dist.dna(as.DNAbin(dat))), dat)))
The pros are a single environment, scriptable model comparison, and clean integration with ape objects. The cons are speed and scale. Large genome-scale alignments, and Bayesian inference with relaxed molecular clocks, are still better handled by dedicated external programs whose output you import into R. Published studies illustrate the split. A study of Zingiberaceae barcoding aligned matK sequences with Clustal X, computed transition and transversion rates with MEGA, and inferred trees with the classic PHYLIP package [9]. A mitogenome study of the grasshopper Rhammatocerus brasiliensis used Bayesian inference with a relaxed molecular clock for divergence dating [10]. In both cases R would handle the tree files and downstream statistics beautifully, but the inference itself came from specialized tools.
The scalability ceiling of classical tools is also real. Parallelizing PHYLIP with MPI reduced analyses that took days on a desktop workstation to calculations feasible over a lunch break on a parallel machine, with the maximum likelihood method scaling best of the three methods tested [11]. The lesson for package choice is that if bootstrap replication counts or dataset size strain your hardware, move inference to a parallelized external tool and use R for everything around it.
Comparative Methods: phytools and the Specialists
If your tree already exists and your question is about traits on that tree, the best R package for phylogenetic analysis is not a tree builder at all. It is a comparative methods package.
phytools is the general-purpose workhorse. It covers ancestral state reconstruction, rates of trait evolution, diversification analyses, simulation, and a huge array of plotting methods. Start here for most trait evolution questions.
For sharper, more specific questions, several specialist packages have appeared, and their papers state their scope precisely.
- phylopath implements phylogenetic path analysis, a confirmatory method for evaluating and comparing causal models using observational data. Comparative biologists often cannot run experiments on macroevolutionary hypotheses, so this approach fills a real gap, and the package adds support for binary variables on top of the published method [3].
- phylolm.hp tackles a chronic problem in phylogenetic generalized linear models, which is partitioning explained variance among correlated predictors. It computes individual likelihood-based R2 contributions of phylogeny and each predictor, including shared variance, and demonstrates the approach on continuous traits such as maximum tree height in Californian species and on binary traits such as species invasiveness in North American forests [4].
- RRphylo applies phylogenetic ridge regression to estimate rates of trait change and ancestral states, designed to behave well with high-dimensional trait datasets [5].
- do3PCA brings probabilistic principal component analysis to phylogenetic comparative studies, estimating PCA parameters under explicit models of trait evolution including Brownian motion, Ornstein-Uhlenbeck, Early Burst, and Pagel's lambda, with AIC-based model selection and a probabilistic rule for how many axes to retain [6].
- markophylo fits Markov chain models of discrete character and rate evolution on phylogenetic trees [7].
The practical choice logic is straightforward. phytools for breadth, a specialist when your exact question matches one. If a reviewer asks how much of your trait variation is phylogenetic signal versus an ecological predictor, phylolm.hp answers that directly [4]. If your PCA axes need to be independent of phylogeny and you want uncertainty handled explicitly, do3PCA is the targeted tool [6].
Visualization: ggtree and tanggle
ggtree, a Bioconductor package, is the standard for tree graphics in R. It extends ggplot2 grammar to trees, so you annotate clades, overlay tip data, and layer displays the same way you would any other ggplot figure. Combined with treeio, which imports tree files and associated data from a wide range of inference programs, ggtree is where most publication figures get made.
The one weakness of any tree-drawing tool is conceptual. Trees are strictly bifurcating structures and cannot represent reticulate events such as hybridization, introgression, or horizontal gene transfer. For those cases, tanggle extends ggtree to phylogenetic networks, accepting input from DNA sequences through extended Newick format, and it supports mapped morphological and geographic characteristics on the network [1]. Because tanggle builds on ggplot2, you keep full control of colors and layout, and because everything is scripted, figures regenerate automatically when data or methods change, which improves traceability and version control across a project [1].
A minimal annotated tree figure looks like this.
library(ggtree)
library(treeio)
tree <- read.newick("my_tree.nwk")
ggtree(tree, layout = "fan") +
  geom_tiplab(size = 2.5) +
  geom_hilight(node = 42, fill = "steelblue", alpha = 0.2)
For alignment quality checks on structural RNAs, note that some questions benefit from structure-aware visualization outside R. The ARB software package, used extensively for rRNA phylogeny and probe design, added RNA3D to overlay phylogenetic and sequence information onto three-dimensional rRNA structures in an OpenGL environment [12]. R cannot replace that, but R can consume the alignments ARB produces.
End-to-End Pipelines: phyloPipeR and the Glued-Tools Alternative
The most recent shift in this space is toward packages that run the whole pipeline. phyloPipeR provides an integrated, automated framework for end-to-end phylogenetic reconstruction and tree comparison within a unified R environment, covering complete workflows from ortholog retrieval through tree inference and quantitative comparison, while also allowing modular execution of individual steps [2]. For multi-gene analyses it implements multiple inference methods and supports both concatenation and coalescent strategies [2].
Why does this matter for package choice? Because the fragmented approach, retrieving sequences with one tool, aligning with another, trimming with a third, inferring with a fourth, increases technical complexity and limits reproducibility, particularly at scale [2]. If your priority is a reproducible pipeline rather than maximum control over each step, an end-to-end package changes the calculus. The pros are reproducibility, fewer glue scripts, and lower technical barriers. The cons are less flexibility at each step and a shorter track record than the mature modular ecosystem.
The pipeline idea is not unique to R. The CloVR-16S pipeline chained Mothur for OTU clustering, the RDP naive Bayesian classifier for taxonomic assignment, QIIME for phylogenetic distance analyses including UniFrac, and Metastats plus custom R scripts for statistical and graphical evaluation [13]. That SOP shows the complementary-structure pattern that R-only pipelines like phyloPipeR now try to collapse into one framework [2].
Comparing the Options on the Criteria That Decide Real Choices
The table above compares what packages do. Real decisions also turn on five criteria that the table compresses.
Data Type and Size
Distance and parsimony methods scale comfortably to hundreds of taxa inside R. ML inside R, through phangorn, stays comfortable through moderate alignments and becomes the bottleneck on large ones [11]. Bayesian dating almost always runs outside R. If your data are genomes, plan on external inference plus R for everything downstream. If your data are a trait table plus an existing tree, pure R packages are all you need.
Inference Inside R Versus Outside
Ask whether you need the inference itself in R. If a collaborator or journal workflow requires a single self-contained R script, phangorn or phyloPipeR earn their place [2]. If you need the best available ML search, run IQ-TREE, RAxML, or similar externally and import results with ape and treeio. Hybrid workflows are the norm, not a compromise. The mcr colistin resistance study, for example, retrieved 116 complete mcr gene sequences from NCBI, built a neighbor-joining tree, and analyzed metadata using diverse packages in R software alongside external tools such as VOSviewer and Biblioshiny [14]. Nobody in that workflow insisted the whole analysis live in one environment.
CRAN Versus Bioconductor
Most phylogenetics packages install from CRAN with install.packages(). A core set, including ggtree and treeio, lives on Bioconductor, the bioinformatics-specific repository with its own release cycle and stricter documentation requirements. Install Bioconductor packages through the BiocManager package. If you are following a bioconductor tutorial for tree visualization, expect this two-repository split and plan your Docker image or renv lockfile accordingly, because mixing repositories is the most common source of version headaches in R for bioinformatics generally.
Documentation, Vignettes, and Maintenance
Newer packages solve modern problems but carry shorter track records. phyloPipeR, tanggle, do3PCA, and treestructure all appeared recently in the literature [2] [1] [6] [8], while ape and phangorn have years of accumulated bug reports, forum answers, and textbook coverage. Before committing, check the package's CRAN page for recent release dates, the number and quality of vignettes, and whether issues on the source repository get answered. A package whose most recent vignette matches your exact task is worth more than three packages that almost fit.
Reproducibility
Script-based analysis is R's structural advantage. Everything in this article can be expressed as code, which means figures and results regenerate when data change and your pipeline can be version controlled. The tanggle authors make this argument explicitly for network figures, noting that script-based publication-quality figures embedded in analysis pipelines improve transparency and simplify sharing and reuse [1]. End-to-end frameworks push the same goal further by reducing the number of hand-run steps between raw sequences and final trees [2]. Whichever packages you choose, record package versions and seed values in your scripts from day one.
Worked Scenarios
Scenario 1: Chloroplast Genome Phylogeny of a Plant Genus
Suppose you have assembled the chloroplast genome of a species with no prior complete genome, as in the case of Rosa platyacantha, whose first complete chloroplast genome spans 157,133 bp, encodes 132 genes, and has 37.21% GC content [15]. The workflow is comparative genomics plus phylogeny against related species. Use R to manipulate the gene matrices and compute nucleotide diversity summaries, run the genome-scale alignment through an external aligner and ML program, then return to R with ape and ggtree to build the species tree figure with annotations for hot spot regions. An end-to-end package such as phyloPipeR is a strong alternative here because multi-gene concatenation is exactly the case it targets [2].
Scenario 2: Mitochondrial Genome Phylogeny With Divergence Dating
The Rhammatocerus brasiliensis study sequenced a 15,571 bp mitogenome with 37 genes and placed the species within Acrididae using Bayesian inference with a relaxed molecular clock [10]. For this design, run the Bayesian dating in a dedicated external program, then bring the dated tree into R. phytools handles trait evolution questions on the dated tree, and if your nodes carry age uncertainty you can propagate that into comparative analyses. R is the wrong place to run the relaxed clock itself.
Scenario 3: 16S Amplicon Community Analysis
If your phylogenetic question is about microbial community composition, your pipeline looks different. The CloVR-16S SOP used Mothur for OTU clustering from pairwise distance matrices, the RDP naive Bayesian classifier for taxonomy, QIIME for UniFrac phylogenetic beta diversity, and R for statistical and graphical evaluation [13]. In a modern R-centric version of that workflow, R handles diversity statistics, ordination, and figures, while the sequence processing and reference-based classification stay in dedicated tools. The phylogenetic tree here is a means to compute community distances, not the final product, so a heavy tree-inference package is unnecessary.
Scenario 4: Comparative Trait Analysis Across Species
You have a species tree and a trait table, for example body size and extinction vulnerability across mammals, which is close to the example phylopath uses to illustrate phylogenetic path analysis [3]. Here the best R package for phylogenetic analysis is a comparative package, not a tree builder. Fit your candidate causal models with phylopath [3], partition predictor importance with phylolm.hp when reviewers want to know whether phylogeny or ecology explains more variance [4], reduce many correlated traits with do3PCA when dimensionality is the problem, with the model selection handled under explicit evolution models [6], and reach for RRphylo when trait numbers are high relative to species count [5]. plot with phytools or ggplot2. Four packages, each doing one job well.
Scenario 5: Pathogen and Tumor Phylogenetics
Time-scaled trees of rapidly evolving populations, whether viral lineages or tumor cell populations, need structure and phylodynamic tools. treestructure detects unobserved population structure in a time-scaled phylogenetic tree using a coalescent-based statistical test, which is useful when geographic metadata are absent or structure is not visually obvious [8]. On the cancer side, a study of hormone receptor positive metastatic breast cancer performed phylogenetic reconstruction on 495 samples from 13 patients using MEDICC2, with the copynumber R package used for co-segmented copy number profiles, deriving trunk length and trunk ratio metrics from the trees [16]. The pattern repeats. Specialized inference external to R, R packages for preprocessing and tree-derived metrics, and statistics in R.
Common Mistakes and Limitations
These are the errors that cost reviewers and beginners the most time.
- Choosing the package before defining the question. "I want to do phylogenetics in R" is not a task. Write down whether your bottleneck is alignment, inference, comparative statistics, or figures, then choose.
- Running genome-scale ML inference inside R and blaming R. phangorn is capable but not built to beat parallelized external ML programs. For large datasets, external inference with R downstream is the correct architecture, and it is what most published pipelines actually do [11].
- Ignoring the CRAN and Bioconductor split. Installing ggtree with
install.packages()fails. Use BiocManager for Bioconductor packages and record which repository each dependency came from. - Using a bifurcating tree for reticulate history. If hybridization, introgression, or horizontal gene transfer is part of your system, a tree is the wrong diagram. Use network methods and visualize with tanggle [1].
- Treating support values as truth values. Bootstrap and posterior supports summarize resampling behavior, not biological certainty. High support at shallow nodes with low support at deep nodes is a common and informative pattern, not an anomaly to fix.
- Skipping alignment inspection. Automated alignment followed by automated trimming followed by tree inference produces confident nonsense on a regular schedule. Inspect the alignment, especially for structural RNAs where secondary and tertiary structure inform homology, as the ARB and RNA3D work illustrates [12].
- Mixing unversioned packages in a pipeline. Two analyses run six months apart with different package versions can differ in results. Pin versions with renv or a container, and record them in your methods section.
- Reading package papers as endorsements of universal use. Each specialist package targets one problem class. phylopath compares causal models [3], it does not build trees. treestructure tests for structure in dated trees [8], it does not infer them. Scope discipline is what makes these tools powerful.
One boundary note. This article is about research software, not clinical or diagnostic decisions, and individual cases involving animals or patients always need a qualified veterinarian or physician.
Frequently Asked Questions
What is the best R package for phylogenetic analysis overall?
There is no single best package, but there is a best default starting kit. ape for tree handling, phangorn for inference inside R, phytools for comparative methods, and ggtree for figures. Add specialists such as phyloPipeR for end-to-end pipelines [2], phylopath for causal comparative modeling [3], or treestructure for structure detection in dated trees [8] when your question calls for them.
Can R build phylogenetic trees from scratch, or do I need external software?
R can build real trees from alignments. phangorn performs parsimony, distance, and maximum likelihood inference, and phyloPipeR runs complete pipelines from ortholog retrieval through tree comparison [2]. For large alignments and Bayesian or clock-based inference, dedicated external programs remain the standard, and the usual workflow imports their output into R with ape or treeio.
Should I use CRAN or Bioconductor packages for phylogenetics?
Use whichever repository hosts the package you need, and know which is which. Most phylogenetics packages are on CRAN, while visualization and I/O packages such as ggtree and treeio are on Bioconductor and install through BiocManager. Document both repositories in your setup script so the environment is reproducible.
Which R package should I use to draw publication quality trees?
Use ggtree. It extends ggplot2 to trees, supports extensive annotation layers, and pairs with treeio for importing tree files from most inference programs. For reticulate evolution that a bifurcating tree cannot show, tanggle extends ggtree to phylogenetic networks while keeping the same ggplot2 workflow [1].
How do I test whether my traits depend on phylogeny?
Fit a phylogenetic generalized linear model and partition the variance. The phylolm.hp package computes likelihood-based R2 contributions for phylogeny and each predictor, handling both continuous and binary traits, and it addresses the multicollinearity problem that breaks traditional partial R2 approaches [4]. For model comparison among evolution models before that step, do3PCA handles dimension reduction under Brownian motion, OU, Early Burst, and Pagel's lambda with AIC selection [6].
How do I keep a phylogenetic analysis in R reproducible?
Script every step, pin package versions, and prefer packages designed for pipeline use. End-to-end frameworks such as phyloPipeR exist specifically because fragmented multi-tool workflows increase technical complexity and limit reproducibility at scale [2], and scripted figure generation through ggtree-based packages keeps graphics tied to the data that produced them [1]. Record seeds, versions, and file checksums in the repository alongside the code.
Sources
- tanggle: An R package for the visualization of phylogenetic networks.
- phyloPipeR: An R Package for End-to-End Phylogenetic Reconstruction and Tree Comparison.
- phylopath: Easy phylogenetic path analysis in R
- Evaluating the relative importance of phylogeny and predictors in phylogenetic generalized linear models using the phylolm.hp R package.
- RRphylo-package 3 RRphylo-package Phylogenetic Ridge Regression
- Probabilistic principal component analysis for phylogenetic comparative studies.
- markophylo: Markov chain analysis on phylogenetic trees
- treestructure: an R package to detect population structure in phylogenetic trees.
- Phylogenetic analysis of chloroplast matK gene from Zingiberaceae for plant DNA barcoding
- Characterization of the mitogenome of Rhammatocerus brasiliensis and phylogenetic analysis of the family Acrididae (Orthoptera: Gomphocerinae).
- MPI-PHYLIP: Parallelizing Computationally Intensive Phylogenetic Analysis Routines for the Analysis of Large Protein Families
- Evaluation of sequence alignments and oligonucleotide probes with respect to three-dimensional structure of ribosomal RNA using ARB software package
- CloVR-16S: Phylogenetic microbial community composition analysis based on 16S ribosomal RNA amplicon sequencing - standard operating procedure, version 1.0
- Global Bibliometric and Phylogenetic Analysis of mcr-Mediated Colistin Resistance.
- Characteristics, comparative genomics, and phylogenetic analysis of the chloroplast genome of Rosaplatyacantha.
- Abstract 1618: Highly populated phylogenetic reconstruction in patients with hormone receptor positive - HER2 non-amplified metastatic breast cancer