AlphaFold PAE Plots for Beginners
By Dr. Zubair Khalid, DVM, MS, PhD ·

The Predicted Aligned Error, or PAE, is the number that tells you whether AlphaFold trusts the relative positions of the parts of your protein. The pLDDT score tells you whether each residue is well modeled on its own. PAE tells you whether you can believe where one domain sits relative to another, or where one chain sits relative to its binding partner. If you work with AlphaFold predictions and you only look at the structure file, you are missing half the quality information the model produces.
By the end of this guide you will be able to:
- Explain what a PAE value means in angstroms and how the plot axes work
- Find or generate a PAE plot from the AlphaFold Protein Structure Database, the AlphaFold server, or a local or ColabFold run
- Parse the raw PAE numbers from a JSON or mmCIF output file with a short Python script
- Recognize the block patterns that indicate separate domains, flexible linkers, or confident interfaces
- Avoid the interpretation errors that catch almost every beginner
Here is what you need on hand before you start:
- Any AlphaFold prediction that includes PAE output. That can be a structure from the AlphaFold Protein Structure Database hosted by EMBL-EBI, a prediction from the AlphaFold server, a ColabFold notebook run, or a local AlphaFold 2 or AlphaFold 3 installation.
- Python 3 with
numpyandmatplotlibinstalled (pip install numpy matplotlib). Nothing else is required for the walkthrough in this article. - A protein of interest with a UniProt accession, for example P12345, if you want to follow along with a database structure.
No prior experience with structure files is assumed. Every command is given, and every expected output is described.
What the PAE Value Actually Means
PAE stands for Predicted Aligned Error. AlphaFold produces, for every ordered pair of residues in the predicted structure, an estimate of the positional error in angstroms (Å, where 1 Å equals 0.1 nanometers) of one residue when the predicted structure is aligned on the other residue. A PAE value of 2 Å between residues 40 and 190 means that if you superimpose the predicted structure on the true structure by aligning residue 190, the model expects residue 40 to land within about 2 Å of its true position.
Three consequences of this definition matter for reading the plot:
- PAE is a pairwise, alignment-dependent quantity. It is not a single global score, and it is not an RMSD. It answers a specific question: given this alignment, how far off is that residue expected to be?
- Low PAE means the relative geometry is trusted, not that the absolute geometry is perfect. A rigid body can be misplaced in space and still have near-zero PAE across all of its residues, because all of its residues move together under any alignment.
- The matrix is nearly but not perfectly symmetric. PAE(i, j) and PAE(j, i) are usually similar, and for most practical purposes you can treat the plot as symmetric, but the values are not mathematically identical because the error estimate is conditioned on which residue you align on.
The plot itself is a square heatmap. Both axes run over residues in sequence order, residue 1 to residue N. The value in cell (i, j) is the PAE between residue i and residue j. In the standard rendering, dark color means low expected error and light color means high expected error. The diagonal is always dark, because a residue is trivially well predicted relative to itself.
A residue of 250 amino acids produces a 250 by 250 matrix, which is 62,500 values. You never read them cell by cell. You read the shape: contiguous dark blocks along the diagonal are rigid, confidently modeled regions, and the color of the off-diagonal blocks between them tells you whether the relative arrangement of those regions is trusted.
PAE Versus pLDDT, pTM, and ipTM
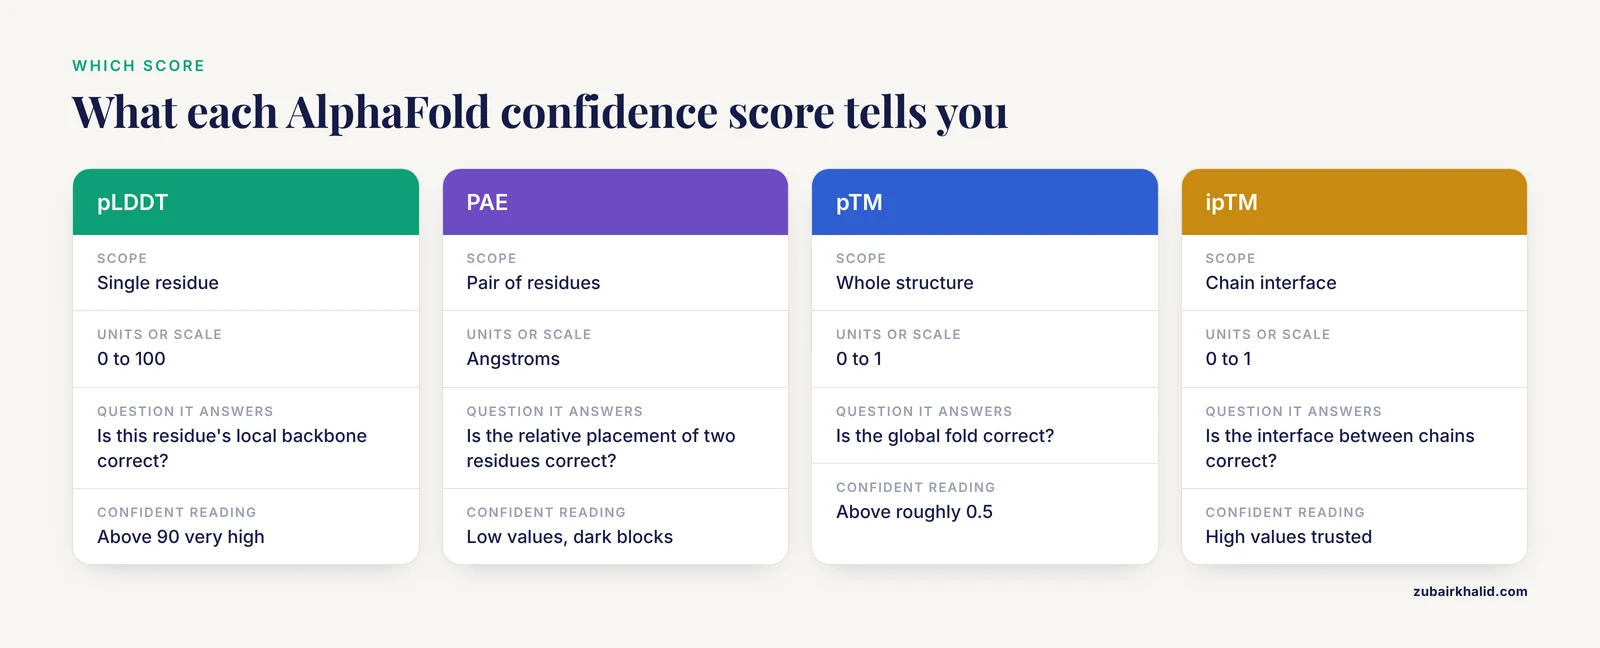
AlphaFold outputs several confidence measures, and beginners mix them up constantly. Here is what each one measures:
- pLDDT (predicted local distance difference test, reported on a 0 to 100 scale) is a per-residue score. It asks whether the local backbone around that residue is accurately placed relative to its immediate neighbors. It says nothing about whether the residue is correctly placed relative to distant parts of the protein.
- PAE is a pairwise score in angstroms. It asks how far apart two residues are expected to be mispositioned relative to each other.
- pTM (predicted template modeling score, 0 to 1) estimates how well the overall fold would score in a TM-align comparison to the true structure. A pTM above about 0.5 is generally read as a correct global fold.
- ipTM (interface pTM, 0 to 1) is the same idea restricted to the interface between chains in a complex. It is the headline number for judging multimer predictions.
- Ranking score in AlphaFold 3 output combines interface and chain-level confidence into a single value used to rank the five model candidates.
The division of labor is simple. pLDDT judges local structure. PAE judges global arrangement. pTM and ipTM compress global arrangement into one number for ranking. A model can have beautiful pLDDT everywhere and still be wrong at the domain level, which is exactly the failure mode that only PAE reveals.
| Measure | Scope | Units or scale | Question it answers | Typical confident reading |
|---|---|---|---|---|
| pLDDT | Single residue | 0 to 100 | Is this residue's local backbone correct? | Above 90 very high, 70 to 90 confident, 50 to 70 low, below 50 unreliable |
| PAE | Pair of residues | Angstroms | Is the relative placement of these two residues correct? | Low values (dark blocks) indicate trusted relative geometry |
| pTM | Whole structure | 0 to 1 | Is the global fold correct? | Above roughly 0.5 generally indicates a correct fold |
| ipTM | Chain interface | 0 to 1 | Is the interface between chains correct? | High values indicate a trusted interface, low values indicate a speculative one |
| Ranking score | Whole model | 0 to 1 | Which of the five models should I use? | Use to pick rank 1, then inspect PAE |
The pLDDT color bands listed above are the ones used in the AlphaFold Protein Structure Database, where dark blue marks residues above 90, light blue marks 70 to 90, yellow marks 50 to 70, and orange marks residues below 50.
Where to Get a PAE Plot
You have four practical routes, and the right one depends on where your prediction came from.
AlphaFold Protein Structure Database
For any protein with a UniProt entry, the database at alphafold.ebi.ac.uk provides precomputed structures for nearly the whole proteomes of many organisms. Open the entry page for your accession and you will see two plots next to the 3D viewer: a per-residue confidence plot based on pLDDT, and the PAE plot. The PAE matrix for database structures is also stored inside the downloadable mmCIF file (mmCIF, or macromolecular Crystallographic Information File, is the standard text format for structural data), so you can extract the raw numbers and replot them yourself. This is the fastest route and requires no computation, but the database contains single-chain predictions of known proteins, not custom constructs or complexes.
AlphaFold Server
The AlphaFold server at alphafoldserver.com runs AlphaFold 3 on user-supplied sequences, including protein-protein complexes, nucleic acids, and modified residues. After a job finishes, the results bundle includes an interactive PAE viewer on the results page, plus downloadable files containing the raw PAE matrix as JSON (JSON, JavaScript Object Notation, is a plain-text key-value format) that you can replot with the script below. This is the easiest route for complexes. The server limits you to a fixed number of jobs per day and to inputs within its stated length limits, so very large complexes need a local installation.
ColabFold
ColabFold wraps AlphaFold 2 and AlphaFold 2 Multimer in Google Colab notebooks and community servers, and it writes a full set of output files to your Google Drive or local disk, including a pre-rendered PAE plot image and the raw scores. This is the standard route when you want custom sequences, custom MSA settings, or multimer prediction with AlphaFold 2 Multimer.
Local AlphaFold
Running the full AlphaFold pipeline on your own hardware gives you the same output files as ColabFold, plus access to the intermediate model outputs. This is the route for large proteins, many candidates, or sensitive data, but it requires sequence databases that take days to download and a GPU with substantial memory.
An AlphaFold PAE Plot Tutorial, Step by Step
This walkthrough uses the most common beginner scenario: a ColabFold or local AlphaFold 2 run that produced a JSON scores file, and a Python environment where you want a clean, labeled, chain-annotated PAE plot. If you instead used the AlphaFold server, the same script works once you point it at that job's scores file.
Step 1. Locate the PAE data in your output files
After a ColabFold run on a protein called myprotein, your output directory contains files with names like these:
myprotein/
  rankings.txt
  unrelaxed_rank_001.pdb
  relaxed_rank_001.pdb
  result_unrelaxed_rank_001.pkl
  result_model_1_scores.json
  result_model_1_multimer_scores.json   (multimer runs only)
  result_model_1_predicted_aligned_error.txt
The result_model_1_scores.json file holds the PAE matrix and several summary scores. Open a Python session in the output directory and inspect the available keys:
import json

with open("result_model_1_scores.json") as f:
    data = json.load(f)

print(sorted(data.keys()))
Expected output looks like this (exact keys vary slightly between AlphaFold versions, which is why you inspect rather than assume):
['atom_plddts', 'chain_ids', 'chain_index', 'max_pae', 'pae', 'plddt', 'ptm', 'ranking_model_type', 'recycle_number', 'recycles', 'residue_index']The two keys you need are pae (the full matrix) and plddt (for context). If the file contains a ptm key, that is your pTM value. If it contains iptm (multimer runs typically place it in the multimer scores file), that is your interface score.
Step 2. Load the matrix and check its shape
import json
import numpy as np

with open("result_model_1_scores.json") as f:
    data = json.load(f)

pae = np.array(data["pae"])
plddt = np.array(data["plddt"])

print("PAE matrix shape:", pae.shape)
print("Mean PAE: %.2f angstroms" % pae.mean())
print("Max PAE:  %.2f angstroms" % pae.max())
print("Mean pLDDT: %.1f" % plddt.mean())
For a 250-residue single-chain prediction, expected output looks like this:
PAE matrix shape: (250, 250)
Mean PAE: 4.81 angstroms
Max PAE:  28.90 angstroms
Mean pLDDT: 88.3
If the matrix is not square, or its dimension does not equal your sequence length, you have opened the wrong file or a truncated download. Fix that before interpreting anything.
Step 3. Plot the heatmap with chain boundaries
import matplotlib.pyplot as plt

fig, ax = plt.subplots(figsize=(6, 5))

im = ax.imshow(
    pae,
    cmap="Greens_r",
    vmin=0,
    vmax=30,
    interpolation="nearest",
)

ax.set_xlabel("Aligned residue")
ax.set_ylabel("Scored residue")
ax.set_title("Predicted Aligned Error")
cbar = fig.colorbar(im, ax=ax)
cbar.set_label("Expected position error (angstroms)")

plt.tight_layout()
plt.savefig("pae_plot.png", dpi=200)
Expected output: a square heatmap in which the top-left corner is dark (very low error between the first residues and themselves), diagonal blocks are dark, and any large off-diagonal blocks are pale green or nearly white. The color scale is capped at 30 Å because PAE values above roughly 30 Å carry essentially no usable information, and including the full range would wash out the differences between good and bad regions.
Step 4. Add chain and domain boundaries
For a two-chain complex, the PAE matrix of AlphaFold 2 Multimer and AlphaFold 3 output covers residues of all chains in sequence order, one after another. Marking the boundaries turns the plot from a color field into an interpretable figure. The chain membership per residue position is stored in the scores data:
chain_ids = data["token_chain_ids"] if "token_chain_ids" in data else data["chain_ids"]

boundaries = []
for i in range(len(chain_ids)):
    if i == 0 or chain_ids[i] != chain_ids[i - 1]:
        boundaries.append(i)

print("Chain boundaries at residue indices:", boundaries)
For a complex of chain A (residues 1 to 150) and chain B (residues 151 to 320), expected output:
Chain boundaries at residue indices: [0, 150]Then draw the boundary lines on the plot:
for b in boundaries[1:]:
    ax.axhline(b, color="black", linewidth=0.8, linestyle=":")
    ax.axvline(b, color="black", linewidth=0.8, linestyle=":")

ax.text(75, 75, "A", ha="center", va="center", fontsize=14)
ax.text(235, 235, "B", ha="center", va="center", fontsize=14)

plt.savefig("pae_plot_chains.png", dpi=200)
The upper-left quadrant of the resulting figure is chain A against itself, the lower-right quadrant is chain B against itself, and the two off-diagonal quadrants are the cross-chain PAE, which is the region that tells you whether the interface is trusted. The same approach works for single-chain multi-domain proteins if you supply your own domain boundary list instead of chain identifiers.
Step 5. Extract a few numbers and sanity-check them
Three quick checks confirm the data parsed correctly:
n = pae.shape[0]

# The diagonal should be zero or near zero
diag = np.mean(np.diag(pae))
print("Mean diagonal PAE: %.3f (should be near 0)" % diag)

# The matrix should be symmetric within rounding
asym = np.abs(pae - pae.T).mean()
print("Mean asymmetry: %.3f (small but nonzero)" % asym)

# A confident residue should show a dark row
res = 50
print("Residue %d mean PAE: %.2f, pLDDT %.1f" % (res, pae[res].mean(), plddt[res]))
Expected output for a healthy model:
Mean diagonal PAE: 0.020 (should be near 0)
Mean asymmetry: 0.412 (small but nonzero)
Residue 50 mean PAE: 3.10, pLDDT 93.4
If the diagonal is not near zero, or the matrix dimensions are wrong, the file is malformed and every downstream interpretation would be meaningless.
Step 6. Read a concrete example
Suppose the matrix for your 250-residue two-domain protein shows:
- Rows and columns 1 to 130 versus each other: values 1 to 3 Å (dark block)
- Rows and columns 131 to 250 versus each other: values 2 to 4 Å (dark block)
- Rows 1 to 130 versus columns 131 to 250: values 15 to 25 Å (pale block)
Your reading: each domain is modeled with high confidence in its own internal geometry, but AlphaFold has no confident information about how the two domains are arranged relative to each other. The correct next step is not to distrust the domains. It is to treat the domain structures as reliable and the inter-domain arrangement as one plausible hypothesis among several, or to look for experimental or evolutionary evidence that constrains the hinge.
Now suppose the off-diagonal block between the domains shows values of 2 to 4 Å. The relative orientation of the two domains is predicted with high confidence, and you can measure distances, interfaces, or hinge angles across the whole construct with reasonable trust.
Step 7. Replot a database structure from its mmCIF file
If your starting point is the AlphaFold Protein Structure Database rather than your own run, the PAE matrix is embedded in the downloadable mmCIF file under the quality-metric category, tagged as a PAE-type metric. Parse it with the gemmi library (pip install gemmi):
import gemmi
import numpy as np

structure = gemmi.cif.read("AF-P12345-F1-model_v4.cif")
doc = structure.sole_block()

values = doc.find_values("_ma_qa_metric.value")
types  = doc.find_values("_ma_qa_metric.type")

rows = int(doc.find_value("_ma_qa_metric.assembly_id"))  # placeholder check below
A simpler and more reliable beginner path is to read the metric table by its full category and split on the metric type:
import gemmi
import numpy as np

doc = gemmi.cif.read("AF-P12345-F1-model_v4.cif").sole_block()

table = doc.find(
    "_ma_qa_metric.",
    ["id", "modeled_group_id", "metric_id", "value"],
)

paes = [float(row[3]) for row in table if row[2] == "2"]  # type 2 = PAE
n = int(len(paes) ** 0.5)
pae = np.array(paes).reshape(n, n)
print("Recovered PAE matrix:", pae.shape)
Expected output:
Recovered PAE matrix: (486, 486)From here, plot exactly as in Step 3. The details of mmCIF category names can change between database model versions, so if the category lookup returns nothing, open the CIF file in a text editor and confirm the category name before assuming your code is wrong.
How to Read PAE Patterns: A Field Guide
Once you can generate the plot, pattern recognition does the interpretive work. These are the recurring shapes.
A single dark block along the diagonal
One compact, rigid, well-modeled domain. If the whole protein is one domain, this is the healthiest possible plot. Expect pLDDT to be high across the sequence as well.
Two or more dark diagonal blocks with pale off-diagonal blocks
Separate domains with an uncertain relative orientation. This is the classic multi-domain pattern and, importantly, it is not a failure of the model. It usually means the domains genuinely have conformational freedom, that the sequence alignment did not contain enough paired information to fix the hinge angle, or that the linker is flexible. Treat each domain as trustworthy and the inter-domain geometry as unresolved.
Dark blocks everywhere, including off-diagonal
A single rigid fold, or a multimer whose interface is confidently predicted. Cross-chain quadrants that are as dark as the within-chain diagonal blocks indicate a well-determined complex arrangement.
A pale stripe or band
A flexible linker or a long low-pLDDT loop. The residues in the band have uncertain positions relative to both neighboring regions. Cross-reference with the pLDDT track: a pale band whose residues also have pLDDT below 50 is very likely a genuinely disordered or unstructured region, and high PAE there is expected behavior, not an error.
A half-dark, half-pale row for one specific residue
One residue is confidently placed relative to its own region but its relationship to the other region is uncertain. This often marks a residue at the edge of a domain, in a hinge, or at a binding interface whose exact register is ambiguous.
A consistently pale cross-chain quadrant in a complex
The interface between the two chains is not supported. This can happen when the chains are predicted to interact but the co-evolutionary signal is weak, when the interface is transient or condition-dependent in reality, or when one chain's fold itself is questionable. Cross-chain PAE is the region to examine before you believe any predicted complex.
Everything pale
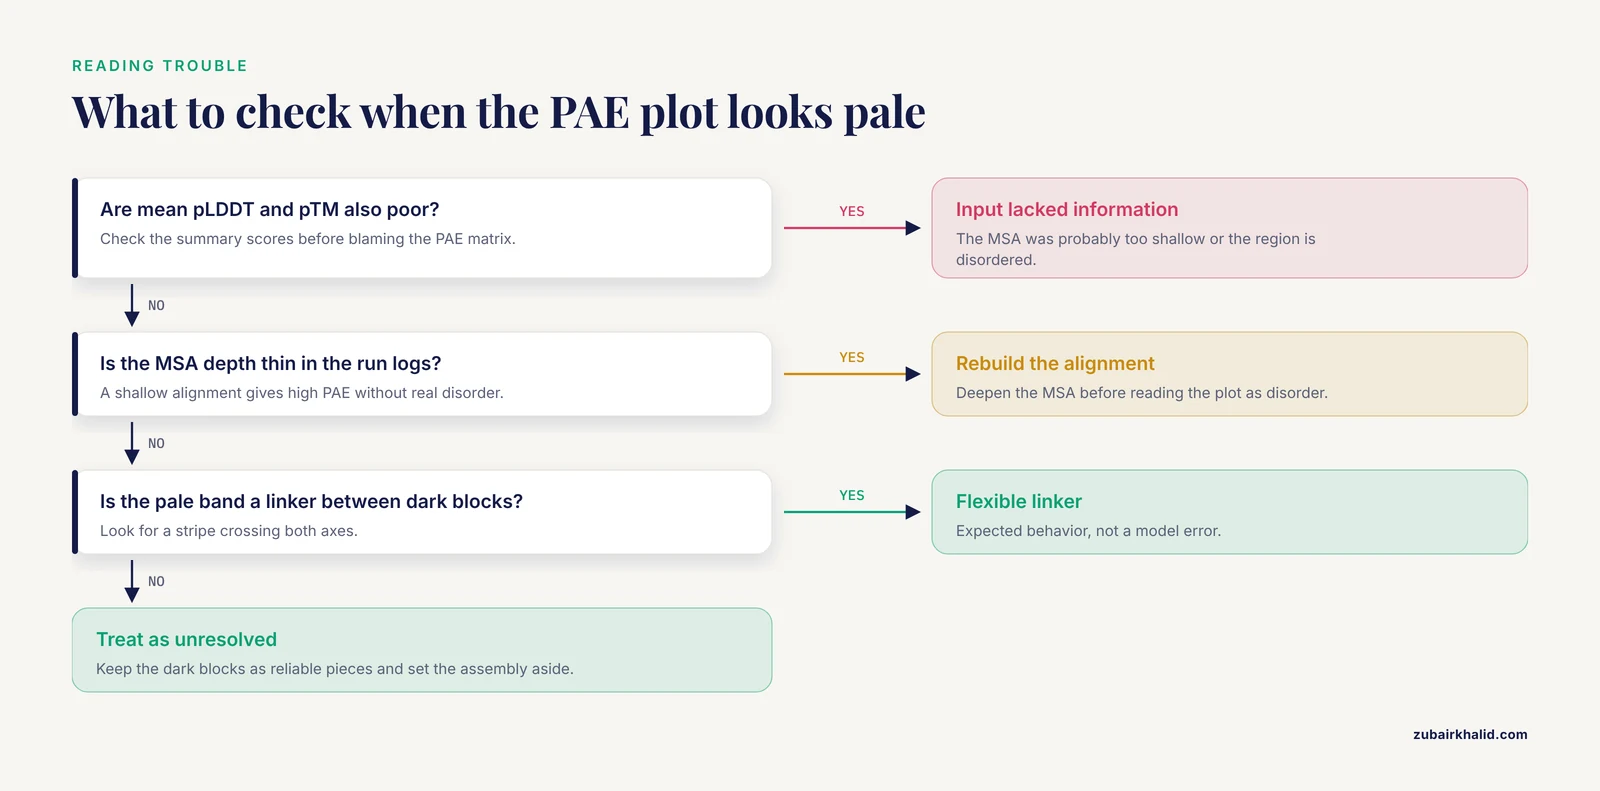
A uniformly unreliable prediction. Check the mean pLDDT and pTM first. If those are also poor, the input probably lacked sufficient homologous information, the MSA (multiple sequence alignment, the database of evolutionary relatives the model uses) was too shallow, or the region is intrinsically disordered. Rebuilding the input rarely rescues a plot that is pale everywhere.
Interpreting PAE for Complexes and Interfaces
For protein complexes, PAE is the single most informative output, and its interpretation has specific rules.
Within-chain quadrants tell you whether each chain folds correctly on its own. Cross-chain quadrants tell you whether the assembly is correct. Both matter. A model can show two beautifully folded chains (dark within-chain blocks) joined by a pale cross-chain region, which means the interface is a guess.
For interface analysis, the practical reading is:
- Cross-chain PAE values that stay low (dark) across a broad swath of contacting residues indicate a confidently predicted interface. Contact distances, buried surface areas, and interface residues identified from such a model are worth taking to the lab.
- Cross-chain PAE that is low only in a small patch leaves open the possibility that the interface is real but its exact docking register is wrong.
- Comparing the PAE patterns across the five ranked models is more informative than any single plot. If the same chain pairing appears with low cross-chain PAE in most ranked models, the arrangement has multiple lines of support. If each ranked model pairs the chains differently, treat the complex as unresolved.
The ipTM score summarizes this. In AlphaFold 2 Multimer and AlphaFold 3 output, ipTM values above roughly 0.8 are commonly treated as confident interfaces and values well below that are treated with caution, though the cutoff is a convention rather than a hard physical boundary.
One caution specific to complexes: AlphaFold 3's PAE extends to all token types, including nucleic acids and small-molecule ligands, so the matrix also covers protein-DNA and protein-ligand contacts. Low cross-token PAE between a protein and a ligand means the model is confident about where the ligand sits, which is a strong statement, but it is confidence about geometry, not proof that the interaction occurs in a cell.
AlphaFold PAE Plot Tutorial Tips
These are the practices that separate a casual glance from a real quality assessment.
Look at PAE together with pLDDT, never alone. A model with high pLDDT everywhere and low inter-domain PAE is a strong model. A model with high pLDDT and high inter-domain PAE contains reliable pieces with unreliable assembly. A model with low pLDDT and low PAE is unusual and worth investigating, because it can indicate a compact but locally inaccurate region.
Sort or reorder the matrix when chains are interleaved. Some output files order tokens in ways that scatter chain A and chain B residues across the axes, which smears the block pattern into noise. Regrouping rows and columns by chain, or by your own domain definitions, restores the readable block structure.
Use a fixed color scale across models you are comparing. If one plot runs 0 to 10 Å and another runs 0 to 30 Å, the darker one can look better purely as an artifact of scaling. Pin vmin=0, vmax=30 for all comparisons.
Check the ranked models in sequence. Look at PAE for ranks 1 through 5. Consistency across ranks is a form of validation that requires no experimental data. Convergent domain arrangements across independently run seeds and models are a good sign. Divergent ones mean the data did not determine the answer.
For hinge questions, crop and zoom. If your biological question is about a hinge, crop the matrix to the residues flanking the hinge and plot just that region with a tight color scale. Fine differences of 1 to 3 Å that vanish in a full-protein view become visible.
Keep the raw numbers. Screenshots of heatmaps lose information. Archive the JSON scores files with your project. Figures can be regenerated, raw matrices cannot.
Combine with structural visualization. Load the rank-1 model in PyMOL or ChimeraX, color it by pLDDT, and have the PAE plot open beside it. When you see a pale cross-domain region in PAE, click into the structure and inspect the interface directly. The two views answer each other's questions.
Common Mistakes and Limitations
Every one of these errors appears regularly in practice, and most of them lead to confident claims that the data does not support.
Treating PAE as a per-residue score. PAE is pairwise. You cannot say "residue 87 has a PAE of 3 Å" without saying relative to what. If you want a per-residue summary, average across a row or column, and label it as such.
Confusing PAE with pLDDT. The most common beginner error by far. pLDDT is per-residue, dimensionless, and on a 0 to 100 scale. PAE is pairwise and in angstroms. A plot with a colorful sequence-aligned track on the side is showing pLDDT. The square heatmap is showing PAE.
Reading high inter-domain PAE as a bad model. A two-domain protein with a flexible hinge can be modeled perfectly well and still show high inter-domain PAE, because no single relative orientation exists to predict. The model is telling you the truth about the conformational landscape. The correct response is to analyze the domains separately, not to reject the prediction.
Reading low inter-domain PAE as proof of a biological interaction. For complexes, low cross-chain PAE says the model found one arrangement it can predict confidently. It does not establish that the interaction occurs in vivo, that its affinity is high, or that it is regulated. AlphaFold 3 improved interface accuracy considerably, but the PAE matrix is still a statement about geometry, not about cellular behavior.
Treating the 5 Å figure as a hard boundary. Rounded rules of thumb, such as reading inter-domain PAE under roughly 5 Å as a resolved relative orientation, are conventions drawn from experience, not physical thresholds. A value of 4.8 Å versus 5.2 Å does not change your conclusion. Clusters and trends matter, not single cells.
Ignoring the MSA depth behind the prediction. PAE reflects the information available to the model. A prediction built on a shallow multiple sequence alignment can show high PAE simply because the evolutionary signal was thin, not because the protein is disordered. Before concluding that a region is intrinsically flexible, check the alignment depth in your run logs or the database entry.
Interpreting PAE on cropped or truncated inputs without caution. If you remove a domain to make a construct computable, the removed domain no longer constrains the model, and PAE values involving the new termini can be optimistic relative to the full-length protein. Interfaces that depend on a distant part of the chain can change or vanish in truncations.
Expecting exact symmetry. PAE(i, j) and PAE(j, i) usually agree closely but not exactly. Visualizing the matrix or its upper triangle is fine. Just do not build a pipeline that assumes bitwise symmetry unless you symmetrize it first, for example by averaging with the transpose.
Forgetting that PAE says nothing about side-chain detail. Low PAE between two residues does not guarantee that a specific hydrogen bond, salt bridge, or rotamer in the model is correct. Interface chemistry at that level needs its own validation, typically against known geometries and, where available, experimental data.
Comparing PAE values across proteins or across model versions as if they were standardized. A 6 Å PAE in a 3,000-residue prediction is a different situation from a 6 Å PAE in a 100-residue prediction. Values are also not directly comparable between AlphaFold 2 and AlphaFold 3 outputs, which were trained and calibrated differently.
Reading the database PAE plot for a protein with a known structure as a validation of that structure. The database PAE tells you about the model's internal confidence. Agreement between a model and an experimental structure is a separate question answered by structural alignment, not by PAE.
Frequently Asked Questions
Is low PAE the same thing as high pLDDT?
No. pLDDT scores each residue's local backbone on its own, while PAE scores how confidently two residues are positioned relative to each other. A residue can have pLDDT of 95 and still sit in a domain whose position relative to the rest of the protein is uncertain, which shows up as high PAE against the other domain.
What PAE value counts as good?
There is no official threshold. Values of a few angstroms indicate trusted relative geometry, values in the tens of angstroms indicate uncertainty, and most analyses treat the pattern of blocks rather than individual numbers as the meaningful signal. Values above roughly 30 Å carry essentially no usable information.
My PAE plot is blocky with pale off-diagonal regions. Should I distrust the model?
Usually no. Dark diagonal blocks mean those regions are well modeled. Pale off-diagonal regions mean their relative arrangement is uncertain, which is expected for multi-domain proteins with flexible linkers. Analyze the dark blocks as reliable domains and treat the assembly question separately.
Why is the PAE matrix not perfectly symmetric?
PAE(i, j) is conditioned on aligning the structure on residue j, while PAE(j, i) is conditioned on aligning on residue i, so the two estimates come from different conditioning and need not be identical. In practice the asymmetry is small and rarely changes interpretation.
Where do I find the PAE data after running a job on the AlphaFold server?
The results page includes an interactive PAE viewer, and the downloadable results bundle contains files with the raw PAE matrix in JSON form, which you can load with Python and plot yourself using the code in this article. The exact file names depend on the server version, so list the bundle contents and open the scores file to inspect its keys.
Can PAE tell me anything about DNA, RNA, or ligands?
With AlphaFold 3 output, yes. The PAE matrix covers all tokens in the input, including nucleic acids and small molecules, so cross-chain PAE between a protein and a ligand reflects confidence about their relative placement. With AlphaFold 2 output, the matrix covers protein residues only.
Does high PAE mean the residues are far apart in the structure?
No. PAE measures predicted error, not distance. Two residues can be 8 Å apart in the model with a PAE of 2 Å, meaning they are close and confidently placed, or 8 Å apart with a PAE of 25 Å, meaning their relative placement is a guess. Distance and confidence are separate axes.
Can I use PAE to decide that a region is intrinsically disordered?
High PAE combined with low pLDDT over a segment is consistent with intrinsic disorder, and AlphaFold was designed to reflect that uncertainty. But high PAE alone can also come from a shallow sequence alignment or an unresolved hinge. Check the pLDDT track and the alignment depth before calling a region disordered.