Why Does AlphaFold Predict Disordered Regions with Low Confidence?
By Dr. Zubair Khalid, DVM, MS, PhD ·

Open almost any eukaryotic protein in the AlphaFold Protein Structure Database and you will see the same pattern. Folded domains render in confident blue and cyan, while long tails, linkers, and loops glow yellow and orange. The most likely cause of those low scores is that the residues are intrinsically disordered. AlphaFold is not failing on them. It is reporting, as faithfully as it can, that no single stable structure exists for those residues in solution.
The first thing to check is the per-residue pLDDT profile against independent disorder annotations. If the low-confidence segment sits in a terminal tail or an internal linker, if disorder predictors such as IUPred and the MobiDB consensus agree, and if the region shows no packed secondary structure when you inspect it in 3D, you are looking at genuine intrinsic disorder. The prediction is behaving exactly as designed.
That framing matters because the question behind low confidence is easy to get backwards. A low score does not mean AlphaFold produced a bad structure. It means the model found no consistent structure to produce. Intrinsically disordered regions (IDRs) exist as dynamic ensembles of interconverting conformations, and over 30 percent of the proteome is estimated to be disordered, an estimate that predates AlphaFold and that the low-confidence regions in its predictions largely reproduce [1]. A method trained to return one set of coordinates has no correct answer for a segment that samples many.
This article explains the mechanism behind alphafold low confidence in disordered regions, ranks the causes from most common to rarest, walks through a diagnostic workflow with concrete commands, and separates the cases you can fix from the cases where low confidence is the correct and useful output.
What the Confidence Scores Measure
AlphaFold2 reports confidence at three levels, and each tells you something different about a disordered region.
pLDDT, short for predicted local distance difference test, is a per-residue score from 0 to 100 that estimates how accurately the local backbone around each residue is predicted. The AlphaFold Protein Structure Database, which provides predicted structures for millions of proteins [2], colors every structure by pLDDT using a standard scheme. Blue marks very high confidence above 90, cyan marks confident regions between 90 and 70, yellow marks low confidence between 70 and 50, and orange marks very low confidence below 50. A widely used rule of thumb treats pLDDT 70 as the cutoff for a high-confidence prediction, and extensive regions below that level are common in eukaryotic predictions [3].
PAE, the predicted aligned error, is a pairwise score. It estimates the expected position error between two residues after optimal alignment. Within a folded domain, PAE is low across the whole domain. Between two separate domains, or between a domain and a disordered tail, PAE is high. This is why two domains can each be predicted confidently while their relative arrangement cannot.
For complexes, AlphaFold adds pTM and ipTM, predicted template modeling scores for the whole assembly and for its interfaces. These matter when a disordered region folds on binding, a case covered below.
The key point for IDRs is that pLDDT is calibrated to be a faithful report of expected local accuracy. When the underlying physics allows many conformations, the model cannot place residues with confidence, and the score drops. The score is doing its job.
AlphaFold Low Confidence in Disordered Regions: The Core Mechanism
AlphaFold2 was trained on structures from the Protein Data Bank (PDB), which overwhelmingly capture folded, static states. Three properties of that training setup explain what happens when the model meets a disordered sequence.
First, IDRs are barely represented as resolved structure. Flexible segments often lack electron density in crystallography and appear as gaps, or they are removed from constructs before experiments. A survey of PDB entries categorized residues as modeled, hard missing, and soft missing based on their visibility in structural datasets, and found that hard missing residues often align with low pLDDT scores, while soft missing residues show dynamic behavior that complicates prediction [4]. The model therefore learns that sequence patterns typical of disorder correspond to positions where structure cannot be pinned down.
Second, the coevolution signal is absent. AlphaFold reads a multiple sequence alignment (MSA) and looks for coupled substitutions that define residue contacts. Ordered domains accumulate these constraints over evolution. Disordered regions, whose function often depends on staying flexible, do not maintain a consistent contact pattern, so the MSA carries little geometric information about them.
Third, the architecture outputs one structure per prediction. A disordered region is an ensemble, not a state. Asked to commit to one set of coordinates for a segment that samples many, the network places residues in an arbitrary extended arrangement and reports low confidence.
Ruff and Pappu frame the consequence directly. Low-confidence regions in AlphaFold output largely overlap IDRs, and the temptation to read the returned coordinates as the structure of an IDR should be resisted, because IDR function depends on conformational heterogeneity and on sequence-ensemble-function relationships rather than on a single conformation [1].
Low confidence on a disordered region is therefore not noise to remove. It is the model communicating that the training signal, the evolutionary signal, and the physical reality all point the same way. This segment does not have one shape.
Three Behavior Modes Inside Low-Confidence Regions
A survey of human proteome predictions in the AlphaFold Protein Structure Database found that low-pLDDT regions, those below the pLDDT 70 rule-of-thumb level, are not all the same. The survey identified three recurring modes of behavior, and telling them apart changes how you should treat a prediction [3].
Near-predictive regions resemble folded proteins and can be nearly accurate predictions. This mode is associated with conditional folding, where an IDR adopts a stable structure only upon binding or under specific conditions.
Pseudostructure regions present a misleading appearance of isolated, badly formed secondary-structure-like elements. They look like helices or strands in a viewer, but the elements are not packed against anything and should not be read as real structure. This mode is associated with signal peptides.
Barbed wire regions are extremely unprotein-like. They show wide looping coils, an absence of packing contacts, and numerous signature validation outliers. The conformation returned in a barbed wire region has no predictive value.
The survey found general correlation between the barbed wire and pseudostructure modes and many measures of disorder in MobiDB, a database that aggregates disorder annotations. The authors built a Phenix tool that annotates these modes directly in a prediction, which is the most direct way to classify a low-confidence segment of interest [3].
A practical habit follows from this work. Whenever a low-confidence region matters to your project, record which mode it belongs to, because near-predictive, pseudostructure, and barbed wire regions call for different responses.
Using Low Confidence as a Disorder Signal
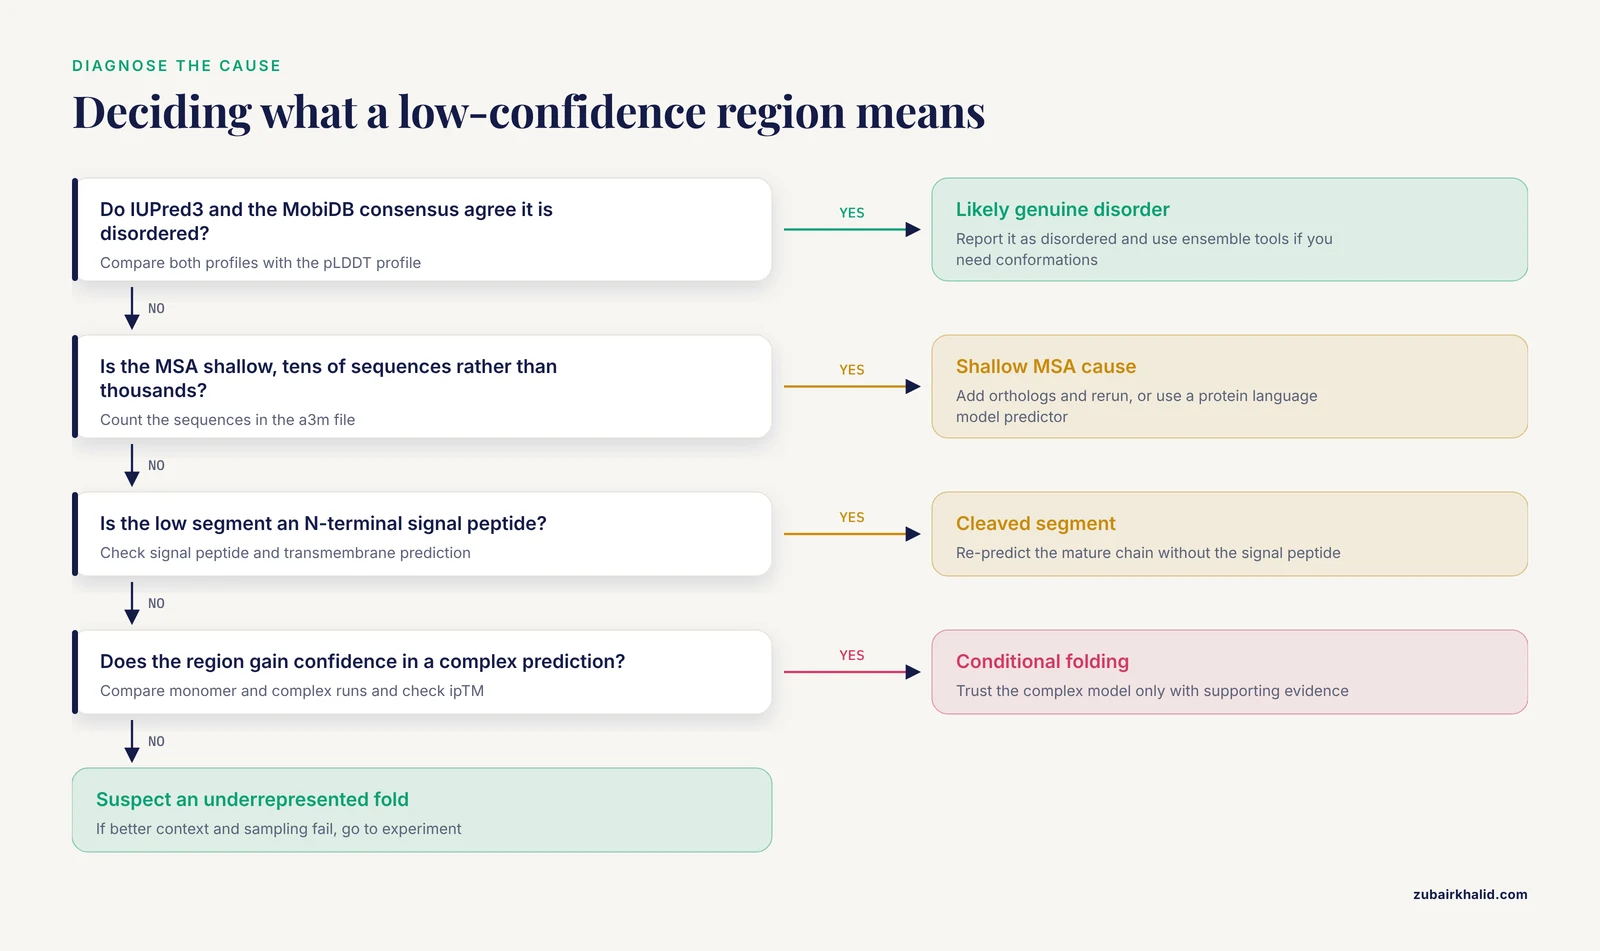
Once you accept that low pLDDT tracks disorder, the score becomes a predictor in its own right, and there is evidence for treating it that way.
The clearest large-scale evidence comes from comparing AlphaFold confidence with what structural experiments can resolve. In the PDB survey described above, hard missing residues, the ones structural experiments could not model, often aligned with low pLDDT, while soft missing residues behaved dynamically and remained difficult [4]. A Long Short-Term Memory (LSTM) model that combined pLDDT, IUPred disorder scores, and the amino acid sequence improved the differentiation between structured and unstructured residues, particularly for shorter unstructured regions [4]. The practical takeaway is that pLDDT is informative on its own and stronger in combination.
pyHCA pushes the same idea from the other direction. The package estimates foldability from sequence alone, using the density of regular secondary structures associated with hydrophobic clusters as defined by hydrophobic cluster analysis, and was applied to the proteomes of 21 species spanning prokaryotes, archaea, and unicellular and multicellular eukaryotes. Cases of low-confidence scores related to disorder were distinguished from cases where low confidence hides something else [5]. Pairing a foldability score with the pLDDT profile turns a vague orange smear into a testable hypothesis. Low pLDDT with low foldability is disorder. Low pLDDT with high foldability is a candidate conditional folder or an underrepresented fold.
For routine work, report the pLDDT profile next to an independent disorder annotation whenever a low-confidence region matters. The two signals agree often enough that disagreement itself is diagnostic, pointing toward the rarer causes described below.
Troubleshooting Table: Symptom to Fix
Use the table below as the core diagnostic reference. Find the symptom that matches your prediction, confirm the cause with the listed check, then apply the fix. The sections after the table explain each mechanism in detail.
| Symptom | Likely cause | How to confirm | Fix |
|---|---|---|---|
| Blue core with orange or yellow termini and linkers | Genuine intrinsic disorder | IUPred and MobiDB score the same segments as disordered, region looks like barbed wire in 3D [3] | Treat pLDDT as a disorder prediction, trim the segment for modeling, use ensemble tools if you need its conformational behavior |
| Entire protein orange, no recognizable secondary structure | Shallow or absent MSA, often an orphan or human-specific isoform | Count sequences in the a3m MSA, confidence does not improve when orthologs are added | Add homologs, predict as a complex if partners are known, use protein language model based predictors, treat all scores cautiously [6] |
| Yellow-orange segment with isolated helix-like sticks | Pseudostructure, often a signal peptide | Signal peptide or transmembrane prediction positive on the N-terminus, elements lack packing [3] | Re-predict the mature chain without the signal peptide |
| A domain that should fold comes back low confidence | Missing cofactor, ion, ligand, or partner | Check for metal-binding or ligand motifs, run a foldability score such as pyHCA [5] | Predict with the ion or ligand using AlphaFold 3 or the AlphaFold Server, validate experimentally if the region matters [7] |
| Region is low confidence alone but confident in a complex prediction | Conditional folding on binding | Compare monomer and complex runs, check interface ipTM [8] | Trust the complex model only with supporting evidence, the free state may still be disordered [2] |
| High-confidence structure inside an annotated IDR | AlphaFold is predicting the conditionally folded state | Cross-check against apo-state experimental data and conditional folding annotations [2] | Report it as a hypothesis about the bound state, not the free structure |
| Enhanced-sampling MD still cannot fold the region | True disorder that resists folding | High fluctuations, low compactness, little secondary structure across the simulation [9] | Accept the disorder, switch to ensemble prediction methods |
| Low confidence where an experimental structure exists | Underrepresented fold or noncanonical sequence | Search the PDB and UniProt for the domain, align the region | Use the experimental structure, note the discrepancy in your records |
The Causes, Ranked from Most Common to Rarest
1. Genuine Intrinsic Disorder
Most low-confidence disordered regions are exactly what they look like. Eukaryotic proteomes carry a large IDR content [1], and most of those regions function while remaining disordered. Alderson and colleagues estimate that up to 80 percent of IDRs in prokaryotes are predicted to conditionally fold, compared with less than 20 percent of eukaryotic IDRs, which means a large majority of IDRs in human and other eukaryotic proteomes work in the absence of conditional folding [2]. For those regions, no binding partner or condition will produce one stable structure, and no prediction method should return one with high confidence.
The mechanism is the combination described earlier. No resolved structure in training, no coevolutionary constraints in the MSA, and an ensemble of conformations in reality. The model answers with an arbitrary extended conformation and a low score. In the barbed wire mode, the returned coordinates are so unprotein-like, with wide loops, no packing, and many validation outliers, that they carry no predictive value at all [3].
The correct response is to accept the signal. Low pLDDT on a segment that independent disorder predictors flag is one of the most useful things AlphaFold gives you for free.
2. Conditional Folding: The Region Folds Only When Bound
Not every IDR stays disordered. Some fold upon binding a partner, an ion, or a ligand, or under specific conditions. These conditionally folded IDRs occupy an intermediate place, and AlphaFold handles them in a surprising way.
Alderson and colleagues found that AlphaFold2 assigns confident structures to nearly 15 percent of human IDRs, and that for IDRs known to conditionally fold, it often predicts the structure of the folded, bound state [2]. Because conditionally folded structures were minimally represented in its training data, this is an emergent behavior rather than a memorized one. Benchmarking against databases of known conditionally folding IDRs, they estimate that AlphaFold2 can identify them at a precision as high as 88 percent at a 10 percent false positive rate [2]. The same study found human disease mutations nearly fivefold enriched in conditionally folded IDRs over IDRs in general, which makes recognizing this class practically important for interpreting variants [2].
The trap is interpretation. A confident structure inside an annotated IDR is evidence that the region can fold, most likely in the bound state. It is not evidence that the free, unbound region looks like that in solution. Ruff and Pappu warn specifically against drawing inferences about IDR structures and their interactomes from AlphaFold output without accounting for conformational heterogeneity [1].
Sequence-level tools help separate the two cases. A low-pLDDT segment with a high pyHCA foldability score is a candidate for conditional folding and deserves a complex-level prediction [5].
3. Missing Partners, Ions, or Ligands
AlphaFold2 predicts single chains by default. Many regions fold only in context, and a monomer-only prediction reports low confidence for exactly the residues that need a partner.
ZNF750 shows how far the gap can go. Its single zinc finger, Z*, has a sequence so different from the CCHH family consensus that it was classified as degenerate and presumed unable to bind zinc and fold. AlphaFold predicted an irregular structure with low confidence. Nuclear magnetic resonance (NMR) and circular dichroism spectroscopy then showed that the corresponding 25-51 segment folds into a well-defined antiparallel beta-beta-alpha structure with a picomolar dissociation constant for Zn2+ and thermal stability above 80 degrees C, using a CCHC ligating motif rather than the expected CCHH [7]. The low-confidence prediction was wrong about foldability because the model had no way to account for the zinc ion.
Complexes change the picture. AlphaFold 3 accepts proteins, nucleic acids, ions, and ligands, and the AlphaFold Server makes those predictions accessible without local installation. Interface confidence is reported as ipTM, the interface predicted template modeling score. In one study of a rice cold shock protein, AlphaFold 3 modeling of the OsCSP1-U6 RNA complex yielded a moderate ipTM of 0.66, which the authors note is expected for proteins containing intrinsically disordered regions [8]. Even with the partner present, the disordered portions keep confidence moderate.
Context also includes the membrane and lipid environment. A nephrology-focused review of AI structural biology notes that renal proteins frequently fall into underrepresented classes, including multipass membrane proteins and intrinsically disordered scaffolds, and that current predictors deliver static snapshots while channels and transporters function as dynamic ensembles embedded in specific lipid and macromolecular environments [6]. A low score can reflect missing context rather than missing structure.
4. Shallow or Absent Evolutionary Information
AlphaFold leans on the MSA. When a protein has few homologs, the model loses its main geometric evidence, and confidence drops everywhere, not only in disordered segments. Orphan proteins, rapidly evolving proteins, and human-specific isoforms are the typical victims. The nephrology review cited above lists human-specific isoforms with shallow MSAs among the classes where confidence scores may not accurately reflect model reliability [6].
This cause is dangerous because it mimics disorder. A globally orange prediction can be a folded protein that simply lacks evolutionary witnesses. The confirm step in the table, counting MSA sequences and testing whether adding orthologs changes the profile, separates this from true disorder.
Disorder also degrades downstream AI tools in parallel ways. An evaluation of AlphaMissense across protein groups found strong performance overall, with Matthews correlation coefficient scores predominantly between 0.6 and 0.74, but low performance on disordered datasets [10]. When the underlying sequence lacks structural constraints, both structure and variant-effect models lose their footing.
5. Signal Peptides and Cleaved Segments
N-terminal signal peptides are a special case of pseudostructure. They are hydrophobic, they adopt a helical conformation inside the translocon, and in water they are unstructured. AlphaFold tends to render them as isolated helix-like elements with mediocre confidence, which the behavior-mode survey linked to the pseudostructure mode and its association with signal peptides [3].
The fix is simple and often forgotten. If your protein is secreted or membrane targeted, predict the mature chain after the cleavage site. The signal peptide will otherwise contaminate both the confidence profile and any downstream analysis that assumes the predicted chain is the biological unit. The same logic applies to propeptides and to targeting sequences that are cleaved in vivo.
6. Noncanonical Folds and Underrepresented Domains
Some regions fold, but into shapes the model has rarely seen. Highly divergent domains, unusual metal ligating motifs, and small disulfide-rich folds can all return low confidence because their nearest training examples are distant.
The hydrophobin study gives a concrete picture. AlphaFold predicted the core beta-barrel of fungal hydrophobins well, except for HFB9A, which came back unfolded with low confidence scores. The authors then ran 500 ns accelerated molecular dynamics (aMD) simulations and obtained folded, energetically stable conformations for all the proteins except HFB9A, which kept much higher disorder, higher atomic fluctuation, the lowest hydrophobicity and compactness, and little secondary structure [9]. Enhanced sampling rescued the predictions that deserved rescuing and confirmed that HFB9A itself carries intrinsic disorder.
The lesson generalizes. When a low-confidence region resists both better context and better sampling, and independent evidence says it should fold, suspect a fold the model underrepresents, and go to experiment.
A Short AlphaFold Tutorial: Diagnosing a Low-Confidence Prediction
This workflow takes a prediction from symptom to diagnosis. Commands assume a Linux or macOS shell with Python 3.
Step 1. Get the structure.
For a protein already in the AlphaFold Protein Structure Database, download the precomputed model directly. File names follow the pattern AF-UNIPROTACCESSION-F1-model_VERSION.pdb.
wget https://alphafold.ebi.ac.uk/files/AF-P04637-F1-model_v4.pdbFor a sequence not in the database, or for a complex with partners, ions, or ligands, use the AlphaFold Server, the free web service from Google DeepMind. Paste the sequences, add any nucleic acids, ions, or ligands, and download the resulting coordinates and confidence scores. For custom runs with your own MSA settings or many sequences at once, use ColabFold.
colabfold_batch query.fasta results/Step 2. Quantify the low-confidence segments.
pLDDT values are stored in the B-factor column of the output file. This script reports how much of the chain falls below pLDDT 50.
python3 - <<'PY'
from pathlib import Path
scores = []
for line in Path("AF-P04637-F1-model_v4.pdb").read_text().splitlines():
    if line.startswith("ATOM"):
        scores.append(float(line[60:66]))
low = [i + 1 for i, s in enumerate(scores) if s < 50]
print(f"{len(low)} of {len(scores)} residues below pLDDT 50")
print("first low residue:", low if low else None)
PY
Step 3. Look at the region in 3D.
Open the file in PyMOL or ChimeraX and color by B-factor. ChimeraX applies the AlphaFold blue-cyan-yellow-orange coloring to AlphaFold predictions automatically. Then judge the mode. Wide looping coils with no packing suggest barbed wire and true disorder. Isolated helix-like sticks suggest pseudostructure and possibly a signal peptide. A compact, packed-looking segment suggests near-predictive behavior and possible conditional folding [3].
Step 4. Cross-check disorder annotations.
Run IUPred3 in long-disorder mode on the same sequence and compare its profile with the pLDDT profile. Then check the MobiDB consensus for your UniProt entry, which aggregates disorder annotations from many predictors and databases. Agreement between low pLDDT and disorder annotations across methods is strong evidence for genuine disorder [3], [4].
Step 5. Check the MSA depth.
ColabFold writes the MSA it used as an a3m file, an alignment format, in the results folder. Count the sequences.
grep -c '^>' results/query.a3mA shallow alignment, tens of sequences rather than thousands, points to the shallow-MSA cause rather than disorder. Adding orthologs, homologous sequences from other species, and rerunning is the cheapest test.
Step 6. Score foldability.
For segments where disorder and foldability conflict, run pyHCA to decide whether the region belongs with DisProt-like disorder, the database of experimentally characterized disordered regions, or with conditionally folded segments [5].
Step 7. Test the complex hypothesis.
If conditional folding is plausible, re-predict with the partner, ion, or ligand on the AlphaFold Server or with AlphaFold 3. Compare ipTM for the interface. A moderate ipTM with a disordered segment involved is expected and should be read cautiously [8].
Safety note: local ColabFold runs need a GPU with substantial memory, and building MSAs against large databases consumes significant disk space. On shared clusters, run MSA generation and inference inside allocated jobs rather than on login nodes, and clean intermediate a3m files after a project ends.
How to Fix Low Confidence, and When You Should Not
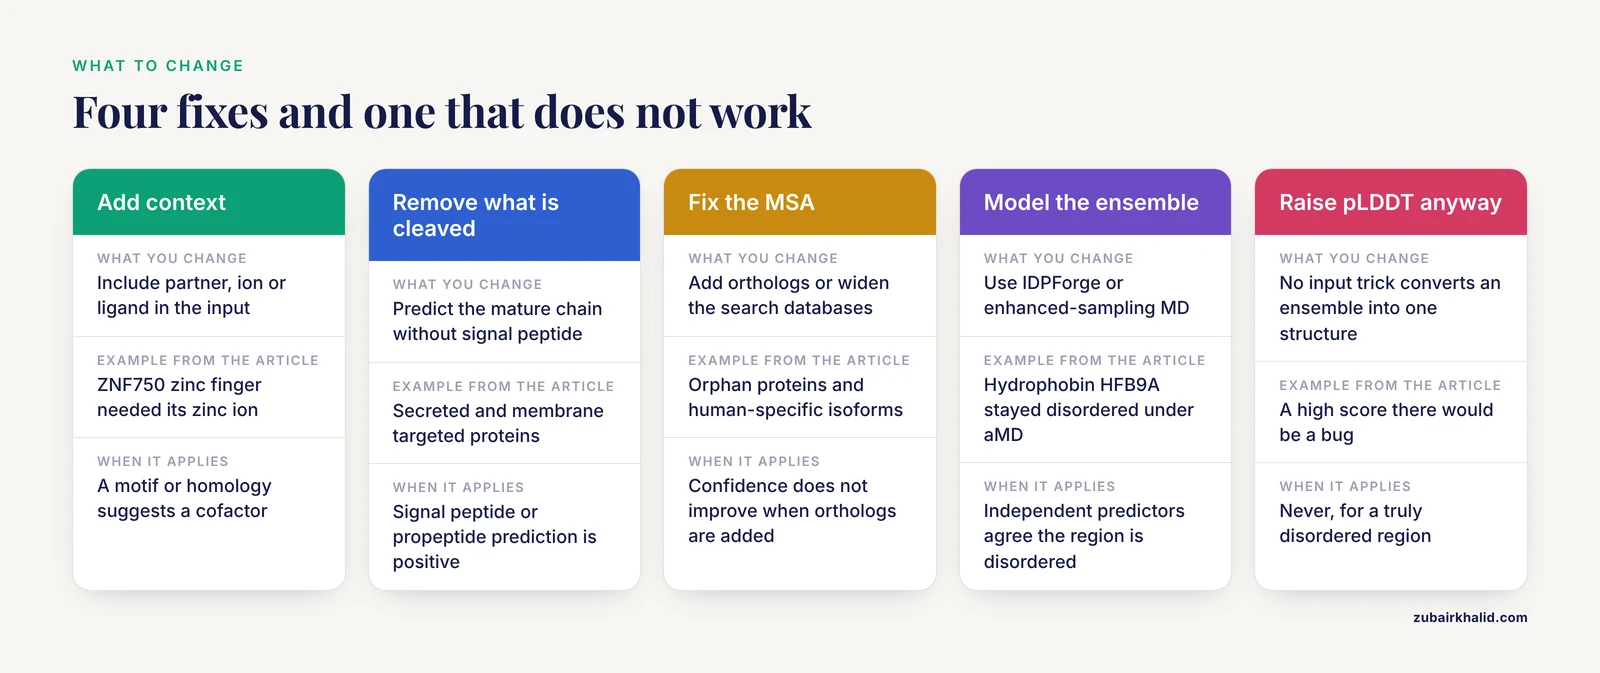
Fixing low confidence means matching the response to the cause. There are four workable strategies and one non-strategy.
Strategy 1. Re-predict with the missing context. If a partner, ion, or ligand completes the fold, add it. AlphaFold 3 and the AlphaFold Server accept proteins, nucleic acids, ions, and ligands in one input. The ZNF750 zinc finger is the cautionary example. Its low-confidence AlphaFold prediction reflected a missing zinc ion and a noncanonical CCHC motif, while NMR verified a well-defined fold [7]. Where a specific ion or ligand is plausible from sequence motifs or homology, include it.
Strategy 2. Remove what does not belong. Signal peptides, propeptides, and cleaved targeting sequences should be predicted separately or removed. Predict the mature chain and map residues back to full-length numbering afterward.
Strategy 3. Fix the MSA. Add orthologs, widen the search databases, or switch MSA generators in ColabFold. If the protein is genuinely orphaned, protein language model based predictors, which read a single sequence, sidestep the MSA problem, though they carry their own limitations for disorder.
Strategy 4. Model the ensemble instead of one structure. If the region is truly disordered, the right target is the ensemble, not a conformation. IDPForge, short for Intrinsically Disordered Protein, FOlded and disordered Region GEnerator, is a recent open-source method built for this case. It uses a transformer protein language diffusion model to generate all-atom ensembles for disordered regions while maintaining folded domains, requires no sequence-specific training, no back transformations from coarse-grained representations, and no ensemble reweighting, and shows good agreement with solution experimental data, with options for biasing by experimental restraints [11], [12]. Enhanced-sampling molecular dynamics is the complementary classical route, with the hydrophobin result as the calibration point. Accelerated MD folded the borderline cases and confirmed that the genuinely disordered HFB9A stayed disordered [9]. Where functional claims depend on the disordered segment, solution methods such as NMR remain the reference standard.
The non-strategy is trying to raise pLDDT on a truly disordered region. No input trick converts an ensemble into a single stable structure, and a high score there would be a bug, not a fix. If independent disorder predictors agree with the low pLDDT profile, the correct action is to report the region as disordered and choose ensemble or experimental methods for anything downstream.
Large-scale comparisons support this division of labor. pLDDT profiles track which residues structural experiments can model, with hard missing residues aligning with low confidence and dynamic soft missing residues remaining difficult [4]. When a low-confidence region carries functional weight, one targeted experiment is worth more than another prediction.
Common Mistakes and Limitations
Mistake 1. Reading low pLDDT as model failure. The overlap between low-confidence regions and IDRs is a feature. Discarding a protein because its tails are orange throws away a correct disorder annotation [1].
Mistake 2. Trusting pseudostructure. Isolated, badly formed secondary-structure-like elements in low-pLDDT regions look like helices and strands in a viewer. They are not packed and have no predictive standing, and the mode is associated with signal peptides [3].
Mistake 3. Reading a confident IDR prediction as the free-state structure. AlphaFold often predicts the conditionally folded state of an IDR. Without apo-state evidence, report such a structure as a hypothesis about the bound form.
Mistake 4. Using AlphaFold output alone for variant interpretation in disordered regions. AlphaMissense performs poorly on disordered datasets even while performing well elsewhere [10], and reviews caution that confidence scores may not reflect reliability for underrepresented protein classes [6].
Safety note: AlphaFold predictions and variant-effect predictors are not clinical evidence on their own. Where a prediction informs a variant call or a diagnosis, pair it with orthogonal functional data and appropriate clinical interpretation.
Mistake 5. Ignoring oligomeric state and cofactors. A monomer prediction of an obligate dimer, or of a zinc finger without zinc, answers a different question than the one you asked [7].
Mistake 6. Expecting MD to fold true disorder. Enhanced sampling helps borderline cases, but a region with genuine intrinsic disorder stays disordered, as the hydrophobin HFB9A showed under enhanced sampling [9].
Mistake 7. Comparing pLDDT across different model versions, chain states, or complex inputs as if the numbers were absolute. Scores are calibrated within a prediction setting, and adding entities changes what the model is being asked.
Limitations. Every tool described here, from pLDDT to pyHCA to IDPForge, produces computational hypotheses. AlphaFold returns a static snapshot, while disordered regions and their complexes are dynamic ensembles in specific cellular environments [1], [6]. For any novel protein where the low-confidence region drives a conclusion, validate with an orthogonal method before building on it.
Prevention and Good Practice
Before predicting, annotate. Check UniProt for disorder, cleavage sites, domains, and known partners. Check the MobiDB consensus for disorder. Note cofactors and ions that sequence motifs suggest. This takes minutes and prevents most misreadings.
During prediction, record the context. Note the model version, whether the input was a monomer or a complex, which entities were included, and the MSA depth. Keep the pLDDT profile alongside the coordinates, not just the structure file.
After prediction, report honestly. State which low-confidence regions were classified as barbed wire, pseudostructure, or near-predictive [3]. Flag confident segments inside annotated IDRs as conditional-folding hypotheses [2]. When a prediction informs a paper or a variant call, report the confidence scores next to the structure.
Version everything. Model versions, database versions, and server updates change outputs. A prediction without a version stamp cannot be reproduced.
Frequently Asked Questions
Does low pLDDT always mean a region is disordered?
No. Most low-pLDDT regions are disordered, but shallow multiple sequence alignments, missing partners, missing ions, signal peptides, and underrepresented folds also produce low confidence. Cross-check with disorder predictors and MSA depth before concluding.
What pLDDT cutoff should I use?
Use the standard color bands. Blue above 90, cyan 70 to 90, yellow 50 to 70, and orange below 50. Many analyses treat 70 as the high-confidence cutoff and below 50 as likely disordered.
Can I make AlphaFold more confident on a disordered region?
Not if the region is truly disordered. Low confidence there is the correct output. You can raise confidence by adding missing partners, ions, or ligands, removing signal peptides, or improving the MSA, when one of those is the real cause.
How do I see pLDDT values for a prediction?
They are stored in the B-factor column of the PDB or mmCIF file. Open the file in PyMOL or ChimeraX and color by B-factor, or parse the column with a short script as shown above.
Does AlphaFold 3 fix the disordered-region problem?
No. AlphaFold 3 adds complexes with nucleic acids, ions, and ligands, but disordered segments still receive moderate to low confidence, and interface scores stay moderate when IDRs are involved.
Why is part of an intrinsically disordered region predicted with high confidence?
Because some IDRs fold upon binding. AlphaFold often predicts that bound-like state, which makes a confident segment inside an annotated IDR a candidate conditional folding element rather than an error.
Which tools should I use instead of AlphaFold for disordered regions?
Use disorder predictors such as IUPred3 and the MobiDB consensus for annotation, pyHCA for foldability, and ensemble generators such as IDPForge when you need conformational ensembles rather than one structure.
Should I cut low-confidence regions before docking or MD?
Usually yes for the folded core, because arbitrary extended conformations distort results. Keep the full-length sequence for disorder analysis and report which residues were trimmed.
Sources
- AlphaFold and Implications for Intrinsically Disordered Proteins.
- Systematic identification of conditionally folded intrinsically disordered regions by AlphaFold2.
- Categorizing prediction modes within low-pLDDT regions of AlphaFold2 structures: near-predictive, pseudostructure and barbed wire.
- Navigating the unstructured by evaluating alphafold's efficacy in predicting missing residues and structural disorder in proteins.
- A sequence-based foldability score combined with AlphaFold2 predictions to disentangle the protein order/disorder continuum.
- Artificial Intelligence Structural Biology in Nephrology: Powerful Scaffolds, Fragile Certainties.
- NMR structure verifies the eponymous zinc finger domain of transcription factor ZNF750.
- Computational Structural Dynamics and Preliminary Heterologous Expression Suggest a "Rigid-Anchor, Flexible-Melting" RNA Chaperone Mechanism for Rice OsCSP1.
- Structural elucidation of four fungal hydrophobins belonging to classes I and II: Results from Alphafold and accelerated molecular dynamics simulations.
- Analysis of AlphaMissense data in different protein groups and structural context.
- IDPForge: Deep Learning of Proteins with Global and Local Regions of Disorder.
- Deep Learning of Proteins with Local and Global Regions of Disorder.