AlphaFold Database Confidence Scores Explained
By Dr. Zubair Khalid, DVM, MS, PhD ·

An AlphaFold database confidence score is a numerical estimate, attached to every predicted structure in the AlphaFold Protein Structure Database, of how closely the model is expected to match the true experimental structure of that protein. Each score is computed by AlphaFold itself during prediction, so it reflects the model's own calibrated self-assessment rather than any comparison against real structural data.
These scores matter because the database holds predictions for essentially every known protein, not experimentally solved structures, and prediction quality varies enormously from residue to residue and protein to protein. A model of a globular kinase domain can be near-experimental accuracy while the same model contains an unstructured tail that should not be trusted at all. Reading the confidence scores correctly is the difference between using the database productively and drawing conclusions from coordinates that the predictor itself flagged as unreliable. This article is a practical alphafold database confidence score interpretation guide: what each metric means, where it is stored, how to read it, and where the metrics break down.
Where the Scores Come From and Where They Live
The AlphaFold Protein Structure Database (AlphaFold DB or AFDB) is a joint effort between Google DeepMind and EMBL-EBI that publishes predicted structures for proteins from across UniProt, spanning more than 200 million entries. Every entry ships with a set of confidence annotations produced by the prediction pipeline itself. These are the alphafold confidence metrics in the database:
- pLDDT, a per-residue score from 0 to 100
- PAE (predicted aligned error), a residue-pair matrix measured in Ångströms
- pTM, a predicted global fold similarity score for the whole chain
- ipTM, the interface equivalent of pTM for multi-chain complexes
pLDDT and PAE are stored alongside the coordinates. pLDDT is written into the B-factor column of the PDB and mmCIF files, which means any structure viewer can color the model by confidence directly. PAE is distributed as a separate JSON file linked from each database entry. The global scores appear in per-residue form (a pTM-like value per residue) in the full output archives, and pTM and ipTM summaries accompany the complex predictions.
The practical consequence is that confidence is not a single number. You choose the metric that matches the question you are asking. pLDDT answers "how reliable is this residue's local geometry," PAE answers "how confident am I in the relative position of these two regions," and pTM or ipTM answers "how much do I trust this fold or this interface as a whole."
pLDDT: The Per-Residue Confidence Score
Definition
pLDDT stands for predicted Local Distance Difference Test score. The underlying metric, lDDT, measures how well local atomic environments are reproduced. For each residue, lDDT asks whether the atoms within a defined neighborhood around that residue sit at the same distances in the model as in a reference structure. pLDDT is AlphaFold's prediction of the lDDT it would obtain against the unknown true structure, expressed on a 0 to 100 scale where higher is better. A pLDDT of 90 means AlphaFold expects the local backbone and side-chain placement around that residue to agree closely with experiment. A pLDDT of 40 means AlphaFold itself does not know where that residue goes.
Because pLDDT is predicted from the sequence and the model's internal representations before any experimental comparison, it is a genuine prediction, not a post-hoc quality measure. This is why it is available for every entry in the database, including proteins that have never been crystallized.
The Standard Interpretation Bands
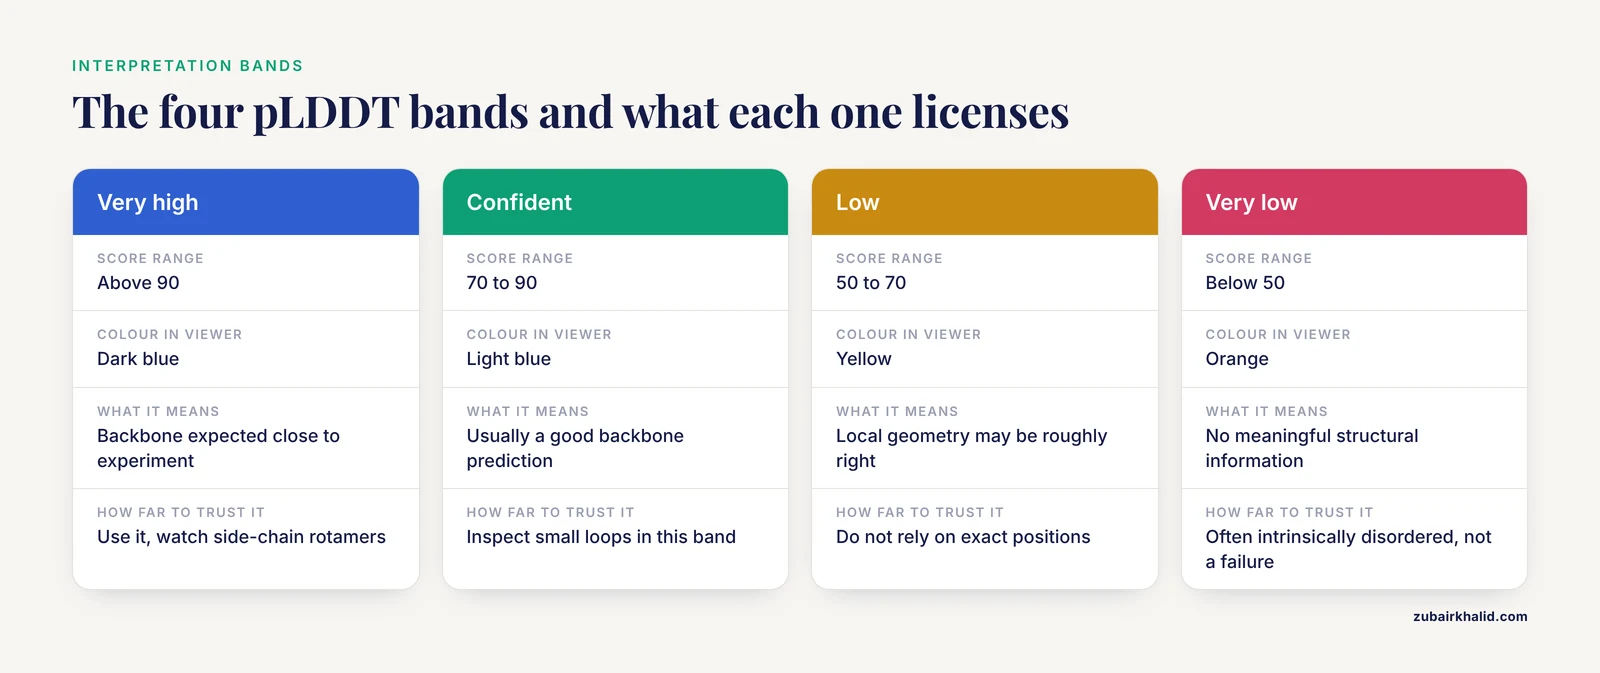
The database colors every structure using four pLDDT bands, and this color scheme is the fastest way to read a model:
- Very high confidence, pLDDT above 90, shown in dark blue. Backbone geometry in these regions is expected to be accurate to roughly backbone-level precision. Treat side-chain rotamers with normal caution.
- Confident, pLDDT 70 to 90, shown in light blue. Usually a good backbone prediction. Side-chain positions are less certain, and small loops in this band deserve inspection.
- Low confidence, pLDDT 50 to 70, shown in yellow. Local geometry may be roughly right, but do not rely on exact positions. These regions often correspond to flexible loops or partially ordered segments.
- Very low confidence, pLDDT below 50, shown in orange. AlphaFold is telling you it has no meaningful structural information here. In the standard documentation, this band frequently corresponds to intrinsically disordered regions, meaning segments that never adopt a single stable structure in solution.
A widely used habit, and a reasonable default, is to treat residues below pLDDT 70 as unreliable for detailed work such as docking or mutation interpretation, and residues below 50 as structurally meaningless. That default has documented exceptions, covered later in this article.
A Worked Example
A published structure-based drug discovery study on the NS5 protein of Kyasanur Forest Disease Virus illustrates confident reading in practice. The researchers took the AlphaFold model of the viral NS5 RNA-dependent RNA polymerase domain, checked that pLDDT scores approached 90 across the modeled region, noted a pTM of 0.8, and only then used the model for docking, molecular dynamics, and free-energy calculations, cross-checking the model with Verify3D, PROCHECK, and ERRAT [1]. The high per-residue scores licensed the downstream work. The same workflow applied to a model with a yellow or orange catalytic site would have been indefensible, because docking against badly placed loop atoms produces meaningless rankings.
What pLDDT Does Not Tell You
pLDDT is strictly a local, per-residue score. It says nothing about whether two domains are oriented correctly relative to each other, whether a chain is in the right conformation, or whether two chains in a complex touch each other correctly. Those questions belong to PAE and pTM. Treating a high mean pLDDT as a certificate of overall model quality is one of the most common interpretation errors.
PAE: Confidence in Relative Positions
Definition
The predicted aligned error (PAE) is a value for every pair of residues in the model, given in Ångströms. For residues i and j, the PAE value estimates the expected positional error at residue j if the model were aligned on residue i. In a well-determined structure, moving one residue tells you exactly where every other residue is, so PAE stays low. In a flexible or poorly constrained model, two domains can each be internally accurate while their relative placement is unknown, and PAE exposes this as a block of high values between the domains even when pLDDT is high everywhere.
This is the key insight for alphafold database confidence score interpretation at the domain level. A two-domain protein can show blue pLDDT across its whole length while the PAE matrix shows a bright block separating the two domains. That pattern means both domains are confidently folded but their arrangement relative to each other is a guess. Conversely, a low PAE block between two chains in a complex prediction is evidence that AlphaFold has placed the chains in a specific, mutually consistent arrangement.
Database entries provide PAE as a downloadable JSON file, and the web interface renders it as an interactive matrix. Learning to read that matrix is one of the highest-value skills in any alphafold tutorial on model quality.
From PAE to Contact Probability
A recent methodological development makes PAE more directly interpretable. Badonyi and Toth-Petroczyy introduced the Pinc score, a simple geometric framework that converts PAE values into conditional contact probabilities, meaning the estimated probability that two residues are actually in physical contact in the native structure. These probabilities are well calibrated against the fraction of native contacts observed in experimentally determined structures. Averaging the contact probability across residues of two interacting chains gives the Pinc interface score, which matches or exceeds the classification performance of more complex scoring methods across five independent benchmark sets. The authors distribute a dependency-free C program and a Google Colab notebook for computing Pinc on any AlphaFold model [2]. For anyone who has struggled with the arbitrary thresholds of interface scoring, Pinc offers a single interpretable number derived from a quantity the database already provides.
pTM and ipTM: Global and Interface Confidence
pTM is AlphaFold's prediction of the TM-score between the predicted structure and the true structure. TM-score is a standard global similarity measure in which values above 0.5 conventionally indicate that two structures share the same fold. A pTM of 0.8, as reported for the KFDV NS5 model discussed above, therefore signals strong confidence that the predicted fold is correct as a whole [1].
For multi-chain predictions produced by AlphaFold-Multimer, ipTM (interface predicted TM-score) summarizes confidence in the arrangement of chains across the interface. In principle, a high ipTM supports a predicted protein-protein interaction. In practice, the situation is more complicated. Schmid and Walter, building the Predictomes database, showed that standard AlphaFold-Multimer confidence metrics do not reliably separate biologically relevant protein-protein interactions from the large number of false positive predictions that appear in proteome-scale screens [3]. Their solution was the SPOC classifier, a machine-learning model trained on curated datasets that combines structure prediction confidence with omics information to separate true and false AF-M predictions. Applied to an all-by-all matrix of nearly 300 human genome maintenance proteins, SPOC generated roughly 40,000 scored predictions viewable at predictomes.org [3]. The lesson for database users is direct: for complexes, raw confidence metrics are a starting filter, not a verdict, and context such as coexpression or pathway membership adds real discriminating power.
Reading Scores in Practice: A Short Alphafold Tutorial Workflow
For a newcomer asking what to actually do with an AlphaFold database entry, the following sequence covers the essentials.
- Open the entry on the database website. The 3D viewer colors the model by pLDDT automatically. Note the proportion of blue versus orange before anything else.
- Read the pLDDT bands. Identify which regions carry your biological question. If your active site, binding groove, or mutation site sits in dark blue, the local geometry is trustworthy. If it sits in orange, the model is not evidence about that site.
- Open the PAE viewer. Check whether the regions you care about show low PAE relative to each other. A domain with high internal confidence but high PAE to the rest of the chain is a reliable part in an uncertain assembly.
- Download the coordinates and the PAE JSON for local analysis. The B-factor column in the coordinate file contains pLDDT, so PyMOL, ChimeraX, and similar tools can recolor by confidence with a single command.
- For complexes, check interface scores and add external evidence. Because standard AF-M metrics do not reliably separate true from false interactions [3], look for convergent support, whether from coevolution, orthogonal interaction data, or a calibrated classifier such as SPOC or Pinc [2].
Users of the AlphaFold 3 server face additional practical gaps. A recent assessment of the server's outputs notes that not all confidence metrics are displayed, only the first of the five models produced by the software is shown by default, and downloads are provided only in mmCIF format, which many practical users handle less comfortably than PDB format [4]. Third-party browser tools such as the AF3 Inspector address this by visualizing all five models together with confidence analytics entirely client-side, with no installation required [4]. If you use the server for complexes with ligands, nucleic acids, or chemical modifications, plan to inspect the full model ensemble rather than relying on the single displayed result.
One more caution comes from systematic benchmarking. Díaz and colleagues evaluated AlphaFold2, OpenFold, ColabFold, and the AlphaFold 3 server across 10 proteins and 222 single amino acid variants, and found that widely used global indicators such as mean pLDDT, pTM, and RMSD frequently suggest comparable performance while substantial local differences between implementations remain. Their framework uses Bland-Altman agreement analysis on per-residue confidence differences and per-residue profiles to expose these differences [5]. In other words, two pipelines can agree on the headline number and disagree meaningfully at the residues you care about.
Low pLDDT Usually Means Disorder, and That Is Information
The single most valuable reinterpretation for new users is that very low pLDDT is usually not a defect. It is a prediction of intrinsic disorder.
Analysis of whole-genome AlphaFold predictions for model organisms found that 30 to 40 percent of amino acids carry very low or low pLDDT values, and that these values relate systematically to intrinsically disordered regions [6]. Cazals and Sarti developed geometrical and topological statistics over whole-genome predictions to identify high- and low-quality predicted domains, to detect false positive and false negative disorder assignments relative to known IDRs, and to characterize how the polypeptide chain fragments into stretches of differing pLDDT [6]. The scale of that low-confidence fraction explains why reading the orange regions as noise wastes a third of the information in a typical eukaryotic model.
The correspondence between low confidence and experimentally invisible residues has been tested directly against crystallography and cryo-EM data. Zheng categorized residues in PDB structures as modeled, hard missing, or soft missing, and found that hard missing residues, those simply absent from experimental maps, often align with low AlphaFold pLDDT scores, while soft missing residues show dynamic behavior that complicates prediction. Combining pLDDT with IUPred disorder scores and sequence features in an LSTM model improved the discrimination of structured from unstructured residues, particularly for shorter unstructured segments [7].
Independent sequence-level methods converge on the same picture. The pyHCA foldability score, built on hydrophobic cluster analysis, distinguishes low-confidence regions that arise from genuine disorder from those arising from other causes, and was validated across the proteomes of 21 species spanning prokaryotes to multicellular eukaryotes [8]. When a sequence-based foldability measure and the model's own confidence agree that a segment is unfolded, that agreement is strong evidence.
There is even an inverted use. Monzon, Haft, and Bateman ran AlphaFold on the AntiFam families, 250 protein sequence families believed to be spurious translations, on the logic that spurious proteins should not fold into well-ordered globular structures. Most showed no evidence of globular structure, confirming the resource, but one family produced a confident globular prediction and on further inspection appears to contain bona fide proteins, so AlphaFold functioned as quality control for AntiFam while AntiFam served as quality control for AlphaFold [9]. The same study carries a warning: mean pLDDT is higher for shorter sequences. Of 131 AntiFam representative sequences shorter than 100 amino acids, six received a mean pLDDT of 80 or greater, so short sequences can earn high confidence with limited evidentiary basis and deserve particular care [9].
Flexibility or Uncertainty? What pLDDT Actually Measures
A persistent debate concerns whether pLDDT tracks structural flexibility. Vander Meersche and colleagues performed a large-scale assessment comparing AF2 pLDDT against flexibility metrics from molecular dynamics simulations in the ATLAS dataset, from NMR ensembles, and from experimental B-factors. Their findings support a nuanced reading: AF2 pLDDT correlates reasonably with MD-derived and NMR-derived flexibility, and it appears more informative than B-factors for flexibility evaluation, but it fails to capture flexibility in the presence of interacting partners and therefore needs cautious interpretation. AlphaFold 3 shows slight improvements in capturing protein dynamics, though molecular dynamics remains superior for comprehensive flexibility assessment [10].
This distinction between uncertainty and flexibility matters experimentally. A residue can be flexible in reality while AlphaFold is confident, if the protein was predicted in a context that constrains it, and a residue can be flexible in reality while the model reports low confidence because the training signal never pinned it down. The two quantities overlap without coinciding.
The connection is useful enough that it has been engineered into methods. Wróblewski and Kmiecik integrated AlphaFold pLDDT scores into CABS-flex, a established method for fast protein flexibility simulations, combining pLDDT with secondary structure information to refine restraint schemes. Tested against the ATLAS database of molecular dynamics simulations covering nearly 1400 proteins, the pLDDT-informed version improved the alignment of predicted flexibility with the MD reference data [11]. Meanwhile, downstream modeling pipelines increasingly treat pLDDT as a reliability weight. ProtCross, a binding-site prediction framework for AlphaFold models, weights its domain-adversarial training loss by pLDDT to reduce the influence of low-confidence regions, and ablation analyses confirmed that pLDDT-guided weighting improved performance relative to unweighted baselines [12]. In inverse protein folding, Melnyk and colleagues used distillation of folding model confidence metrics such as pTM and pLDDT to build a fast differentiable consistency regularizer, improving sequence recovery and protein diversity in designed sequences [13]. These applications all rest on the same premise: pLDDT encodes real, transferable information about local structural reliability, even if it is not a pure physical quantity.
Where the Scores Systematically Fail
Confidence metrics are calibrated, but they are not infallible, and the failure modes are now well documented.
Fold-Switching Proteins
Thacker examined AlphaFold2 confidence on 18 experimentally validated fold-switching proteins, sequences that adopt two or more distinct conformations, across 27,098 predictions. The result was a 33.6 percent high-confidence FalseVerify rate, defined as predictions where AF2 is simultaneously confident in its output and structurally committed to the dominant fold while missing the known alternative conformation [14]. Severity tracks the magnitude of the conformational change: predictions requiring complete secondary structure refolding produced FalseVerify rates of 80 to 97 percent, while local backbone rearrangements produced rates of only 0 to 2 percent. Per-residue analysis showed that confidence failures concentrate in the fold-switching regions themselves, and cross-cluster pLDDT variance serves as a structural fingerprint that separates reliable from unreliable predictions [14]. For proteins with known or suspected alternative folds, a confident single answer can be confidently wrong.
Contact Errors and the Limits of Refinement Guidance
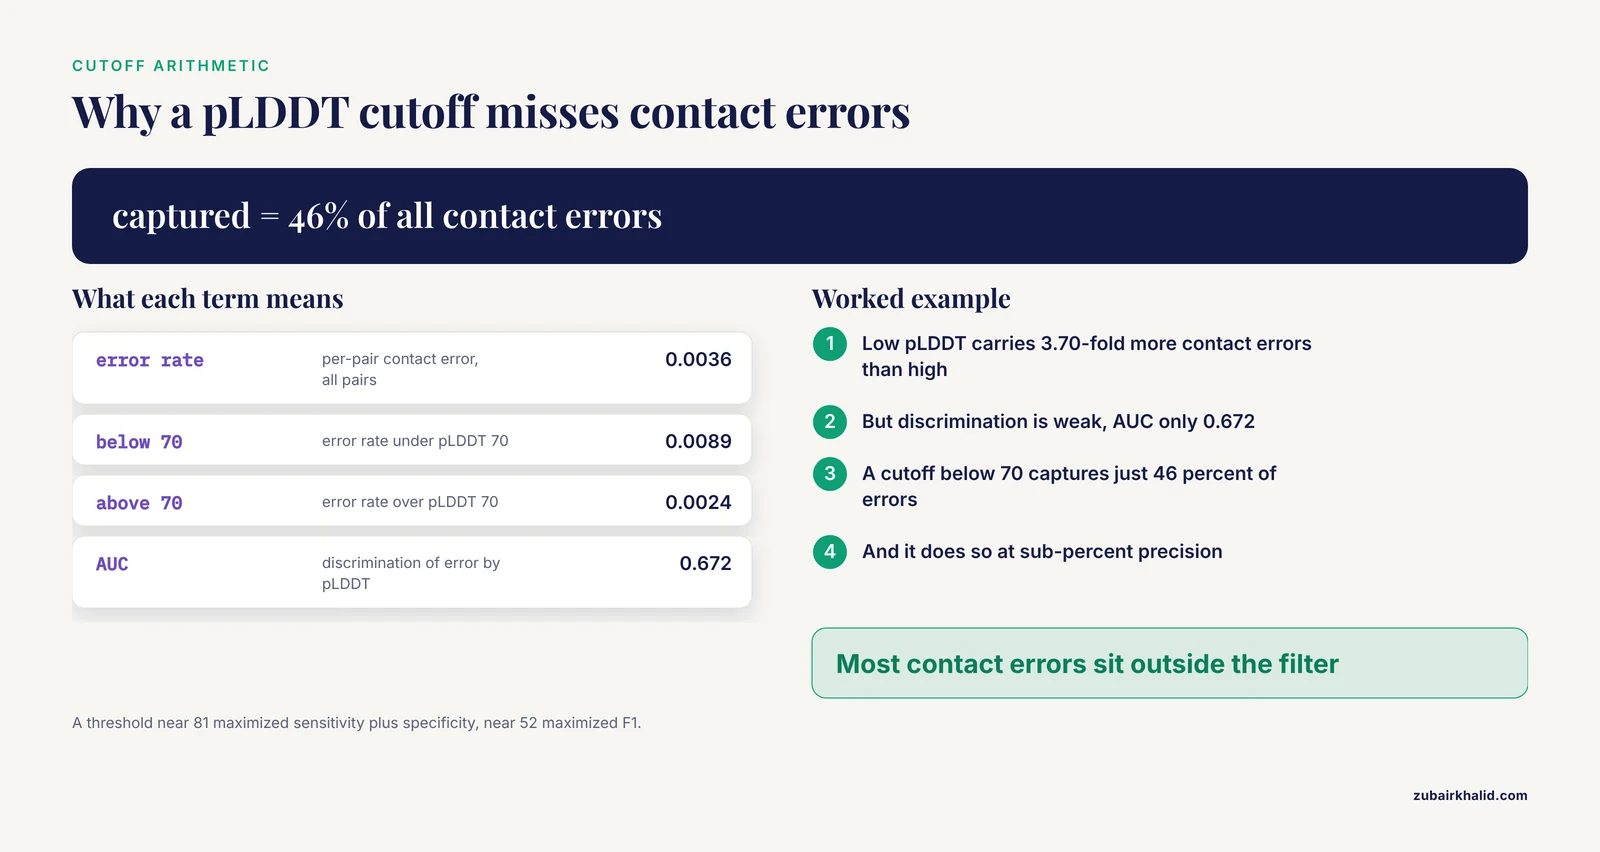
A common assumption holds that low pLDDT marks the regions where AlphaFold's residue contacts are wrong, making low-confidence regions the natural target for refinement. Alam and Kumar tested that premise directly on a homology-controlled benchmark of 231 matched AFDB and PDB chains, comprising over 4.2 million long-range residue pairs. AlphaFold's long-range contact calls were almost all correct, with a per-pair contact error rate of 0.0036. Low pLDDT was associated with elevated error, at 0.0089 below pLDDT 70 versus 0.0024 above, a 3.70-fold enrichment, but it predicted error only weakly, with a discrimination AUC of 0.672. A threshold near pLDDT 81 maximized sensitivity plus specificity, a threshold near 52 maximized F1, and pLDDT below 70 captured only 46 percent of all contact errors at sub-percent precision [15]. The practical takeaways are that low pLDDT regions do carry more contact errors than high pLDDT regions, that most errors nonetheless live outside the simple low-confidence filter, and that selecting residues for refinement purely by a pLDDT cutoff is an inefficient strategy.
Summary of the Confidence Metrics
| Metric | Scope | Units or scale | Question it answers | Typical failure |
|---|---|---|---|---|
| pLDDT | Single residue | 0 to 100 | How reliable is this residue's local structure | High even when domain orientation is wrong, unreliable on short sequences |
| PAE | Residue pair | Ångströms | How confident is the relative position of two residues | Often overlooked, requires matrix reading |
| pTM | Whole chain | 0 to 1, fold-similar above 0.5 | Is the overall fold correct | Can mislead for fold-switching proteins [14] |
| ipTM | Chain interface | 0 to 1 | Is the inter-chain arrangement correct | Does not reliably separate true from false PPIs [3] |
Common Mistakes and Limitations
- Reading mean pLDDT as overall model quality. A single poorly modeled tail can drag a mean down, and a confidently wrong fold-switch can leave a mean high. Global indicators frequently agree across pipelines while local accuracy diverges substantially [5]. Inspect the per-residue profile, not just the summary.
- Trusting interfaces from confidence alone. Standard AlphaFold-Multimer confidence metrics do not reliably separate relevant interactions from false positives in large screens, which is precisely why calibrated classifiers and orthogonal evidence exist [3].
- Assuming low pLDDT means the model failed. Below pLDDT 50, the standard interpretation is an intrinsically disordered region, and the database-wide frequency of such regions, roughly 30 to 40 percent of residues in model organisms, makes this a normal result rather than an error [6].
- Ignoring sequence length. Short sequences receive inflated confidence on average, with documented cases of spurious sequences under 100 amino acids earning mean pLDDT of 80 or greater [9]. Treat confidence on short chains with skepticism.
- Equating low pLDDT with high contact error for refinement planning. Low pLDDT regions do contain more contact errors, but the discrimination is weak, and a simple cutoff below 70 misses over half of all contact errors [15].
- Applying pLDDT as a flexibility predictor without checking context. pLDDT correlates with MD and NMR flexibility measures, but it fails to capture flexibility when the prediction was made in the presence of interacting partners, so models of complexes can understate the mobility of isolated chains [10].
- Trusting high confidence on fold-switching proteins. Around a third of predictions on validated fold-switching proteins were simultaneously confident and committed to the wrong conformational state, and complete refolding scenarios push that failure rate to 80 to 97 percent [14].
- Over-relying on single-server outputs. The AlphaFold 3 server displays one of five models and limits visible metrics, so server-only users see a fraction of the confidence information [4].
Individual research cases always require domain-specific judgment about which metric governs which conclusion, and experimental validation remains the arbiter for any high-stakes claim.
Quick Review
- The alphafold database confidence score is a family of metrics, not one number: pLDDT per residue, PAE per residue pair, pTM per chain, ipTM per interface.
- pLDDT runs 0 to 100 and is stored in the B-factor column, so any viewer can color by confidence. Above 90 is very high, 70 to 90 confident, 50 to 70 low, below 50 very low and usually disordered.
- Low pLDDT below 50 generally means intrinsic disorder, a real biological signal, affecting roughly 30 to 40 percent of residues in model organism predictions [6].
- PAE reveals whether confidently folded domains have a confidently known relative orientation. High pLDDT with high inter-domain PAE means reliable parts, uncertain assembly.
- Standard AF-M confidence does not reliably separate true from false protein-protein interactions, so complex predictions need classifiers or orthogonal evidence [3].
- pLDDT relates to flexibility but is not flexibility, and it underestimates mobility when partners are present during prediction [10].
- Documented failure modes include fold-switching proteins, where about a third of predictions are confidently wrong [14], and short sequences, which receive inflated confidence [9].
Frequently Asked Questions
What does an AlphaFold database confidence score mean?
It is the model's own calibrated estimate of how accurate a prediction is, computed during prediction rather than measured against experiment. pLDDT scores local geometry per residue on a 0 to 100 scale, PAE estimates pairwise positional error in Ångströms, and pTM and ipTM summarize global fold and interface confidence.
What pLDDT value is trustworthy?
The standard bands treat pLDDT above 90 as very high and 70 to 90 as confident for backbone geometry, while 50 to 70 is low and below 50 is very low, often corresponding to disordered regions. Many workflows treat residues below 70 as unreliable for detailed applications, though systematic studies show this cutoff is an imperfect filter for contact errors [15].
Why is part of my AlphaFold model colored orange?
Orange marks pLDDT below 50, meaning AlphaFold expects its local geometry to be wrong or undefined. In most cases this correctly identifies an intrinsically disordered or flexibly unstructured segment rather than a prediction failure, and experimental structures frequently lack density for exactly these residues [7].
What is the difference between pLDDT and PAE?
pLDDT is a per-residue score of local structural accuracy, while PAE is a residue-pair matrix describing expected positional error of one residue relative to another. A model can have uniformly high pLDDT with high PAE between domains, indicating both domains are well folded but their relative orientation is uncertain.
How do I judge confidence for a predicted protein complex?
Look at interface scores such as ipTM and at inter-chain PAE blocks, but do not stop there, because standard AF-M confidence metrics do not reliably separate true interactions from false positives [3]. Calibrated tools such as SPOC for curated screening [3] or Pinc, which converts PAE into contact probabilities [2], improve discrimination.
Can a low-confidence region still be biologically meaningful?
Yes. Very low pLDDT often correctly flags intrinsically disordered regions that carry real functions such as binding promiscuity and post-translational modification sites, and the correspondence between low-confidence residues and experimentally invisible segments has been verified against crystallography and cryo-EM data [7]. Low confidence means the region lacks a single stable structure, not that the prediction is biologically useless.
Sources
- AlphaFold-driven structure-guided identification of NS5 RdRp-targeting antiviral leads against Kyasanur Forest Disease Virus.
- A simple probabilistic AlphaFold interaction score
- Predictomes, a classifier-curated database of AlphaFold-modeled protein-protein interactions.
- AF3 Inspector: In-Browser 3D Model Visualization and Confidence Analytics for AlphaFold 3
- Comprehensive evaluation of AlphaFold/OpenFold prediction of experimentally unresolved proteins through novel metrics.
- AlphaFold predictions on whole genomes at a glance: a coherent view on packing properties, pLDDT values, and disordered regions
- Navigating the unstructured by evaluating alphafold's efficacy in predicting missing residues and structural disorder in proteins.
- A sequence-based foldability score combined with AlphaFold2 predictions to disentangle the protein order/disorder continuum.
- Folding the unfoldable: using AlphaFold to explore spurious proteins.
- Flexibility or uncertainty? A critical assessment of AlphaFold 2 pLDDT.
- Integrating AlphaFold pLDDT Scores into CABS-flex for enhanced protein flexibility simulations.
- ProtCross: Bridging the PDB-AlphaFold Gap for Binding Site Prediction with Protein Point Clouds.
- AlphaFold distillation for inverse protein design
- Confidence Without Verification: Screening pLDDT Unreliability in AlphaFold2 Fold-Switching Predictions
- Where Does AlphaFold Make Contact Errors? A Homology-Controlled Characterization of pLDDT, Contact Error, and the Limits of Contact Refinement