Slide Size for Scientific Presentations: How to Choose
By Dr. Zubair Khalid, DVM, MS, PhD ·

Slide size is the proportions of the canvas your research presentation slides are built on, and the core difference is simple: 16:9 widescreen fills modern projectors and displays, while 4:3 leaves black bars on most current equipment but offers a taller, more compact frame. The best slide size for scientific presentation work is 16:9 unless you know the room, the template, or the recording system requires 4:3.
This guide explains what slide size actually controls, lays out the realistic options with their pros and cons, compares them side by side, works through concrete scenarios such as conference talks and thesis defenses, and covers the resolution problems that hit hardest when your slides carry microscopy and whole-slide imagery.
What Slide Size Actually Means
Two numbers describe a slide. The aspect ratio is the ratio of width to height, written as 16:9 or 4:3. The dimensions are the actual physical or pixel size of that canvas, for example 13.333 by 7.5 inches, or 33.87 by 19.05 cm.
Aspect ratio and dimensions are related but not identical. Every 16:9 slide has the same shape regardless of whether the underlying canvas is set in inches, centimeters, or millimeters. A 16:9 shape maps cleanly onto a 1920 by 1080 pixel full HD screen because 1920 divided by 1080 equals 16 divided by 9. A 4:3 shape maps cleanly onto an old 1024 by 768 projector but not onto a modern display.
Presentation software treats the slide as a scalable canvas rather than a fixed bitmap. Text and vector shapes redraw sharply at any output resolution. Raster images, meaning photographs and micrographs, do not. They carry a fixed pixel count, so the slide size you choose determines how large each image appears relative to the frame, and how much margin you have left for labels and text.
This distinction matters more in science than in business presenting. A typical research presentation slides deck is dominated by figures: gels, plots, histology crops, MRI slices, schematics. The canvas proportions decide how those figures can be arranged, how much text sits beside them, and whether the audience in the back row can read an axis label.
One more piece of vocabulary: letterboxing. When you show a 4:3 slide on a 16:9 screen, the display fills the unused width with black bars on the left and right. The reverse mismatch crops or stretches instead. Both outcomes are avoidable if you pick the size deliberately.
The Main Slide Size Options for Scientific Presentations
16:9 widescreen
Widescreen is the default in current versions of PowerPoint, Keynote, and Google Slides. The standard 16:9 canvas in PowerPoint measures 13.333 by 7.5 inches, which equals 33.87 by 19.05 cm. The shape matches full HD and 4K displays exactly, so a 16:9 deck projected at native resolution wastes no pixels.
The strengths follow from that fit. You get more horizontal room, which suits wide multi-panel figures, timeline schematics, and side-by-side comparisons of conditions. Video clips embedded in research presentation slides are almost always produced in 16:9, so they drop in without cropping. On a desktop monitor, where most reviewers and journal clubs will actually see your deck, widescreen fills the screen.
The weaknesses are real but manageable. In a large room, viewers far from the screen see a smaller effective image for any given font size, because the same content is spread across a wider but not taller frame. Rows of bullet text that wrap across a wide line become harder to track. And older departmental projectors, which still exist, may be native 4:3.
4:3 classic
The 4:3 canvas in PowerPoint measures 10 by 7.5 inches, or 25.4 by 19.05 cm. This was the universal default before widescreen displays took over, and enormous amounts of legacy material, including departmental templates and archived lectures, exist in this shape.
Its strength is vertical space relative to width. A 4:3 slide is proportionally taller, which helps for tall figures such as aligned gel lanes stacked under a label bar, vertical gene-ontology trees, or an anatomical illustration paired with a text column. Text lines stay shorter, which some readability guidelines favor. On a 16:9 display, a correctly scaled 4:3 slide letterboxes but never distorts.
Its weakness is straightforward: on any modern widescreen projector or display, a 4:3 deck uses roughly three quarters of the available screen area. For figure-heavy scientific presentation content, the narrower frame forces smaller multi-panel figures or more slides.
16:10 and other computer-native ratios
Some laptops and tablet screens use 16:10. A 16:10 canvas fills those screens slightly better than 16:9, and the extra vertical strip can hold a caption or a legend. The gain is small, and the mismatch cost runs in both directions: on a 16:9 projector a 16:10 deck letterboxes slightly, and on a 16:10 laptop a 16:9 deck letterboxes slightly. For conference work, where you rarely control the display, 16:9 remains the safer target. Treat 16:10 as a niche choice for teaching decks that will only ever be shown on your own devices.
Custom sizes for print-adjacent uses
Presentation software allows any custom canvas. The useful custom cases in research work are narrow and predictable. An A4 or US Letter portrait canvas works for slide-style handouts and annotated protocols that will be printed rather than projected. A square 1:1 canvas is used when the same figure panels will be recycled for social media or web thumbnails. A 4:5 or 9:16 canvas matters if your institution clips lecture recordings for online distribution. These are secondary outputs. Build the main deck in 16:9 or 4:3 and export adapted versions separately, rather than compromising the primary deck.
LaTeX Beamer
Beamer, the standard LaTeX class for research presentation slides, defaults to a 4:3 canvas of 128 by 96 mm. You select 16:9 with the class option aspectratio=169, which sets the canvas to 160 by 90 mm. Beamer also supports other ratios such as 16:10 and 5:4 through the same option. If your group writes decks in Beamer, decide the aspect ratio in the document class line on day one, because changing it later reflows every frame.
Side-by-Side Comparison
| Criterion | 16:9 widescreen | 4:3 classic | 16:10 | Custom (A4, square) | Beamer 4:3 default |
|---|---|---|---|---|---|
| Typical canvas | 13.33 x 7.5 in (33.87 x 19.05 cm) | 10 x 7.5 in (25.4 x 19.05 cm) | Similar width, slightly taller | Set per purpose | 128 x 96 mm (160 x 90 mm at 16:9) |
| Matches modern projectors and displays | Yes, natively | No, letterboxes | Nearly | Rarely | No, letterboxes |
| Matches legacy 4:3 projectors | No, letterboxes | Yes, natively | No | Rarely | Yes |
| Horizontal room for wide figures | Best | Limited | Good | Varies | Limited |
| Vertical room for stacked figures | Limited | Best | Good | Best (portrait) | Best |
| Embedded video fit | Native | Letterboxed | Slight bars | Varies | Letterboxed |
| Template availability | Current default everywhere | Legacy departmental templates | Rare | Rare | Beamer themes |
| Best for | Conferences, seminars, thesis defense, lectures | Known 4:3 venues, tall stacked figures, legacy templates | Personal-device teaching decks | Printed handouts, social snippets | Beamer users who explicitly opt in |
The pattern in the table drives the recommendation. The best slide size for scientific presentation delivery in unfamiliar rooms is 16:9, because modern projection is overwhelmingly widescreen and the penalty for a mismatch is wasted screen area. The case for 4:3 rests on two specific conditions: you know the equipment is 4:3, or your figure types are disproportionately tall.
How to Choose: The Criteria That Decide Real Presentations
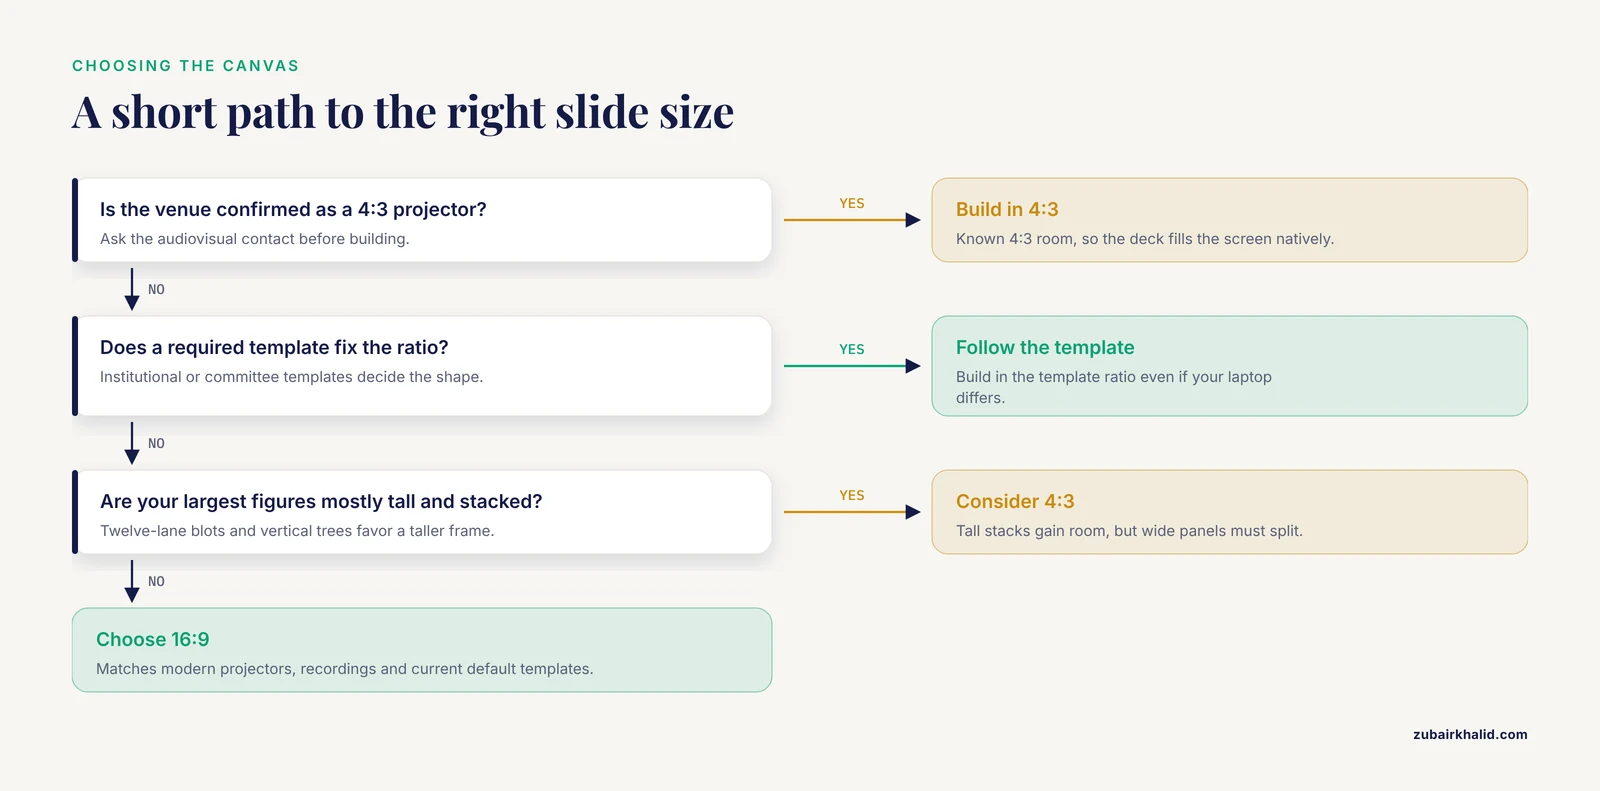
Work through five questions in order. The first answer that pins you down usually settles the choice.
1. What will project in the room? Conference organizers and departmental administrators almost never state slide size on the invitation, but you can infer it. Any venue with recently purchased flat-panel displays or laser projectors is 16:9. A teaching hospital auditorium or an older seminar room may still run a native 4:3 projector. If the stakes are high, email the organizer or the audiovisual contact and ask one question: what aspect ratio is the projector? Thirty seconds of email beats a deck rebuilt the night before.
2. Is there a mandatory template? Many universities, institutes, and clinical departments issue branded templates, and thesis or qualifying-exam committees sometimes require the institutional template. If the template is 16:9, build in 16:9 even if your own laptop screen is a different shape. Deviating from a mandated template creates work for the AV team and looks careless to the committee.
3. What shapes are your figures? Lay out your five largest figures at thumbnail size and look at their aspect ratios. Wide figure arrays, forest plots with many covariates, and multi-panel comparison rows favor 16:9. Tall stacks, such as a western blot with twelve lanes above a quantification plot, favor 4:3 or at least argue against cropping. If your figures are mixed, 16:9 usually wins because wide panels can be shrunk side by side while tall panels can be paired with side text.
4. Will the talk be recorded or streamed? Lecture-capture systems and webinar platforms render in 16:9. A 4:3 deck recorded through these systems is letterboxed in the video, which looks unpolished on playback and shrinks your content for online viewers. If a recording will outlive the talk, as seminar recordings and invited-lecture videos usually do, 16:9 is the safer archive format.
5. Who inherits the deck? Journal-club decks get reused. Lab-meeting templates get passed to new students. A deck built in the current default travels forward more easily than one built in a fading standard.
If all five questions come back neutral, choose 16:9. That is the whole decision procedure.
Worked Scenarios
Scenario 1: A 12-minute conference talk at a national meeting. You know nothing about the projector, the session runs to a strict clock, and your core figure is a five-panel comparison across treatment groups. Choose 16:9 at 13.333 by 7.5 inches. The wide canvas carries the five panels in one row, the recording will look clean, and any modern projector matches. Convert your figures to 16:9-friendly arrangements before you build a single slide, and put the talk on a USB drive plus a cloud backup in PDF as well as native format.
Scenario 2: A thesis defense in a university auditorium. The committee requires the institutional template, which happens to be 16:9, but a senior committee member warns that the backup projector in that auditorium is an older 4:3 unit. Build in 16:9 to match the template and the primary projector, then run a compatibility check: open the deck in the actual room during a rehearsal, confirm the letterboxing is acceptable, and know which two slides contain the densest text in case you need to pace delivery differently. Asking for the rehearsal slot is standard practice, not a favor.
Scenario 3: A weekly journal club in a department with a legacy 4:3 template. The template predates the current projector and nobody has updated it in years. Here the calculus differs from a conference. The room is known, the audience is the same twelve people every week, and the template carries the department logo that everyone expects. Staying with 4:3 costs nothing in this room and keeps every past journal-club deck visually consistent. Alternatively, propose the department migrate the template to 16:9 once, and then retire the problem permanently. Both are defensible. What is not defensible is building a 4:3 journal-club deck and then presenting it at an external seminar without checking the destination display.
Slide Size and Image Resolution: The Part That Bites Scientists
Slide size interacts with image quality in a way that business presenters never encounter, because research presentation slides carry scientific imagery at extremes of scale. The problem is concentrated in digital pathology and whole-slide imaging.
A whole-slide image, meaning an entire tissue section scanned at diagnostic resolution, reaches gigapixel dimensions. That scale is why computational pipelines treat these images as bags of thousands of small patches rather than single pictures, and why multiple-instance learning methods dominate whole-slide image analysis [1]. The same gigapixel scale creates the same problem for your presentation. One full-resolution scan can exceed the memory a laptop comfortably handles mid-talk, and image-registration work across serially stained sections is explicitly complicated by the gigapixel size of the source images [2].
The numbers make the point concrete. In a digitization protocol developed at the Smithsonian National Museum of Natural History, slide scanning at 0.23 micrometers per pixel produced compressed files ranging from 0.15 to 28 GB depending on specimen type, with individual scanning times from 41 seconds to 18 minutes [3]. A 28 GB file cannot be dropped onto a slide. Nobody should try.
The practical workflow has three steps, and all three are routine in digital pathology groups.
- Crop the region of interest. Extract the field that actually supports your argument. Open-source platforms such as QuPath are the standard tool here, and they are designed to accept analytical outputs, which is why model developers build directly into QuPath for clinical usability [4].
- Export at presentation resolution. A full HD 16:9 slide frame is 1920 by 1080 pixels. An image that occupies half the slide width needs roughly 960 pixels of width to render sharply at full HD, and more if you expect viewers to zoom into a shared PDF afterwards. Export your crop at two to three times its on-slide display size in pixels, then let the software scale it down. Scaling down preserves sharpness. Scaling up never does.
- Compress deliberately. A crop exported from a 0.23 micrometer per pixel scan is far above what any projector can show. Heavy downsampling is appropriate for projection. Keep the full-resolution original for the manuscript and the reusable archive, and keep a mid-resolution version for the PDF handout you might email afterwards.
Machine-learning work in this area illustrates the same principle from the other direction. When researchers needed to run cell segmentation and classification on whole-slide images inside clinical workflows, they distilled a large foundation model into a lightweight version that kept comparable performance while cutting size and complexity [4]. The lesson for slide design is identical in spirit: resolution beyond what the display can use costs portability and performance without buying visible quality. The diagnostic-grade scan belongs in your data repository, not in your deck.
The one-size compromise to avoid is pasting a raw gigapixel image onto a slide and shrinking it with the corner handles. The result is a slide that takes thirty seconds to load on the conference laptop, renders with compression artifacts on the projector, and still shows less detail than a purpose-made crop would have.
Design Consequences of Your Size Choice
Slide size is not cosmetic. It changes how much text fits legibly, how figures breathe, and how much mental effort the audience spends decoding the layout rather than learning the science.
Educational research gives this a measurable footing. In a prospective pilot with 41 radiology residents preparing for the 2026 Korean Radiology Board Examination, researchers distributed freely available study materials that included presentation slides alongside flashcards and infographic summaries generated through a governed large language model pipeline, and they measured extraneous cognitive load, meaning the mental effort consumed by the presentation format itself rather than the content, using an adapted scale with acceptable internal consistency (Cronbach alpha 0.87) [5]. The framing matters for slide design: whatever canvas you choose, your job is to keep extraneous load low, because load spent on parsing a cluttered slide is load not spent on your results.
The same pilot reported a voluntary adoption rate of 62.5% among the 24 residents who completed the study, while retention fell to 58.5%, below the prespecified 80% threshold, and the design relied on self-selected users with exploratory effect-size estimates intended for planning a future multicenter trial [5]. Read cautiously, that pattern still teaches something about decks: materials get adopted when they are easy to use, and even good materials lose part of their audience. A slide size that forces cramped text and tiny figures pushes in the wrong direction on both counts.
Concretely, on a 16:9 canvas, resist the temptation to fill the extra width with long bullet lines. Wide lines strain the eye's return sweep. Use the width for a figure beside a short text column, or for two conditions compared left to right. On a 4:3 canvas, the shorter line length is an advantage, but the reduced width means wide figure arrays must be split across two slides. Plan for more slides rather than smaller type. Font size should never be the variable you trade away to fit a canvas.
Common Mistakes and Limitations
Changing slide size after building the deck. Most presentation software offers a resize command, and it is a trap for figure-heavy decks. Resizing from 4:3 to 16:9 either stretches every object or leaves you to reposition hundreds of elements by hand. Text boxes reflow, images distort, and aligned multi-panel figures drift out of registration. Choose the size before you place the first figure. If you inherit a mismatched deck, rebuild the figure slides rather than trusting the automatic conversion.
Assuming the venue matches your laptop. Your 16:10 laptop screen tells you nothing about the projector. Confirm the display, not the device in your bag.
Designing on the laptop and judging from the front row. At your desk, every slide is readable. In the room, the back row sits five times farther from a screen the same size as your monitor. After choosing the canvas, test the deck on an external display at a distance, or print a slide at true scale and view it from across the room.
Exporting micrographs at raw scan resolution. As covered above, keep gigapixel sources out of the deck and export purpose-made crops at two to three times their display size [3].
Treating slide size and slide density as the same problem. A larger or wider canvas does not make a dense slide legible. If a slide needs 11-point type, the fix is splitting the slide, not switching the aspect ratio.
Ignoring the recording. Talks live on as recordings and shared PDFs. A size that letterboxes on the capture system diminishes the deck's afterlife.
A final limitation belongs in the open rather than in a footnote. The research on presentation format in science education is thin and mostly recent. The radiology pilot discussed above was small, had substantial attrition, used self-selected users, and reported exploratory estimates intended for sample-size planning rather than definitive effects [5]. General design principles such as legible font sizes and low extraneous load are well supported, but precise claims about one aspect ratio outperforming another for learning outcomes are not established. Individual talks, rooms, and audiences vary, and judgment beats any single rule.
Frequently Asked Questions
What is the best slide size for a scientific presentation?
For most purposes, 16:9 widescreen is the best choice, because it matches modern projectors, displays, lecture-capture systems, and the default templates of current presentation software. Choose 4:3 only when the venue is confirmed as 4:3, when a mandated template requires it, or when your figures are predominantly tall and stacked.
Is 16:9 or 4:3 better for conference talks?
16:9 is better for conference talks in almost every case. Conference projectors and recorded sessions are widescreen, embedded video is produced in 16:9, and the extra width suits multi-panel scientific figures. A 4:3 deck on a widescreen projector wastes about a quarter of the screen area in black bars.
What pixel dimensions should research presentation slides use?
You do not set pixels in the slide editor, you set physical or paper dimensions, but a 16:9 frame corresponds directly to 1920 by 1080 pixels at full HD. For raster images placed on slides, export crops at roughly two to three times their intended on-slide display size so they stay sharp when projected.
Should I change the slide size after building my deck?
No. Resizing after the fact distorts images, reflows text, and misaligns carefully arranged figure panels. Decide the aspect ratio before building, and if you inherit a deck in the wrong ratio, rebuild the figure slides rather than relying on the automatic resize command.
Does slide size affect the image quality of my microscopy figures?
Slide size affects how large a figure appears and how many pixels it needs, but true image quality is set by the source file and your export resolution. Crop the region of interest from the original scan, export it at adequate pixel dimensions, and keep the full-resolution file out of the deck, since raw whole-slide scans can reach tens of gigabytes.
What slide size does LaTeX Beamer use by default?
Beamer defaults to a 4:3 canvas of 128 by 96 millimeters. To produce 16:9 slides, set the class option aspectratio=169 in the document class line, which gives a 160 by 90 millimeter canvas. Beamer also supports 16:10 and other ratios through the same option.
Further Reading
- Evaluation of biological and biochemical indicators associated with Toxoplasmosis in pregnant women.
Sources
- Collaborative instance-level and bag-level multiple instance learning with label disambiguation for whole slide image analysis.
- From traditional to deep learning approaches in whole slide image registration: A methodological review.
- Digitizing microscope slide-based natural history collections: A protocol using slide scanner technology.
- A lightweight and extensible cell segmentation and classification model for H&E-stained cancer whole slide images.
- Feasibility and psychometric evaluation of large language model-generated radiology learning materials for board examination preparation: a prospective pilot study.