Scientific Presentation Slide Layout: How to Choose
By Dr. Zubair Khalid, DVM, MS, PhD ·

A scientific presentation slide layout is the fixed arrangement of content zones on a slide, such as the title zone, the figure zone, and the text zone, while the template is only the styling wrapper of colors and fonts around those zones. The rule of thumb for choosing: decide the single message each slide must carry, then pick the layout that expresses that message with the fewest words and the clearest visual anchor. Most layout failures in scientific talks come from asking one slide to carry three messages at once, which forces the audience to read instead of listen. Guidance published for scientific presenters is consistent on this point, recommending that the amount of information on one slide be limited and that attention be paid to layout, colors, and fonts so slides are easy to read [1].
This article walks through the main layout options available in standard presentation software, compares them side by side, gives the pros and cons of each, works through real scenarios such as a conference talk and a thesis committee meeting, and closes with the mistakes that sink otherwise good talks.
What a Slide Layout Actually Controls
Before comparing options, define the vocabulary, because presentations software uses these terms loosely.
Layout is the arrangement of placeholders on a slide. A placeholder is a pre-positioned container for a title, body text, image, chart, or table. When you choose "Title and Content" or "Two Content" in PowerPoint, or a layout in Google Slides or Keynote, you are choosing where those containers sit on the canvas.
Template is the styling layer applied across the whole deck. It sets colors, fonts, background, and the position of recurring elements like logos and page numbers. A template can hold several different layouts. This distinction matters because changing the template does not fix a bad layout, and changing the layout does not require rebuilding the template.
Slide master is the parent slide from which layouts inherit their formatting. If your title font is wrong on forty slides, fixing the master fixes all of them.
Aspect ratio is the shape of the slide. The current standard is 16:9, the widescreen shape that matches modern projectors and displays. The older 4:3 shape survives in some institutions and older auditoriums, so it is worth checking the room before you finalize a deck.
White space is the empty area around content. It is not wasted space. It is what separates the figure from the caption and the message from the noise, and it is the cheapest readability tool available.
A useful mental model: the template is the clothing, the layout is the skeleton, and your content is the muscle. Most slide problems are skeletal.
Scientific Presentation Slide Layout Options at a Glance
The table below is the core comparison. Each row is a layout you can build once in your slide master and reuse for the rest of your career.
| Layout | Best for | Strengths | Weaknesses |
|---|---|---|---|
| Title slide | Opening, section breaks | Sets tone, orients audience, zero reading load | Carries no data, easy to waste time on decoration |
| Outline or roadmap slide | Opening minute of any talk | Tells the audience where you are going, reduces cognitive load | Can feel bureaucratic if over-detailed |
| Structured text (short bullets) | Definitions, lists of conditions, methods steps | Fast to build, good for exact terms the audience must capture | Invites text walls, competes with the speaker |
| Figure-dominant | Showing a gel, microscopy image, or schematic as the main event | Puts the evidence front and center, forces one message per slide | Requires a clean figure and a rehearsed explanation |
| Two-column comparison | Before and after, wild type versus mutant, method A versus method B | Makes the contrast itself the visual message | Tempts side-by-side text walls instead of visuals |
| Data chart slide | Quantitative results, dose responses, statistics | Directs attention to the trend, one chart per slide keeps it clean | A busy chart defeats the purpose, axes and labels need care |
| Schematic or flow layout | Experimental design, signaling pathways, workflows | Explains systems in one glance | Time-consuming to build well, clip-art versions look unprofessional |
| Takeaway or summary slide | Closing, transitions between sections | Locks in the message, gives the audience something to photograph | Weak if it merely repeats the agenda |
| Backup slides | Anticipated questions | Absorbs questions without derailing timing | Only useful if actually anticipated |
No single row is the best scientific presentation slide layout for every situation. A deck is a sequence of layouts, and the skill is matching each layout to each message.
The Layout Options in Detail
Title Slide
The title slide carries the talk title, your name, your affiliation, and usually the date or venue. That is all. Decorative stock photos of DNA helices add nothing, and a crowded title slide sets the expectation that every following slide will also be crowded.
Pros. It orients the audience and costs about twenty seconds of talk time. A clean, uncluttered title slide signals that the rest of the deck will be disciplined.
Cons. It conveys no scientific content, so over-investing in it is time wasted. Multi-institution collaborations create author-list pressure, but the full consortium belongs in the footer of a later slide or the abstract, not stretched across the opening.
When to choose it. Every talk needs exactly one, at the start. Longer talks and thesis defenses also benefit from section-break title slides, which use the same layout with a section name instead of the talk title.
Outline or Roadmap Slide
The roadmap slide lists the three to five parts of the talk in the order they will arrive. Presenters of scientific talks are advised to show the outline of the whole presentation at the beginning, then assemble the content by connecting short words and sentences rather than long paragraphs [1].
Pros. The audience builds a mental scaffold in the first minute, which makes every later slide easier to place. It also disciplines you, because a talk that does not fit the outline is a talk that needs editing.
Cons. A roadmap with seven nested levels is a reading exercise, not an orientation. If the outline needs sub-bullets, the talk structure itself needs work.
When to choose it. Talks longer than about fifteen minutes, departmental seminars, and committee presentations. Skip it for a five-minute conference talk, where the roadmap costs a disproportionate share of your slot.
Structured Text Layout
This is the classic "Title and Content" layout with a headline and a small number of short lines. The operative word is short. Building content from short words and short sentences, rather than full prose paragraphs, is a specific recommendation in guidance on scientific presentation method [1]. Each line should be a phrase the audience could copy into their notes, not a sentence you intend to read aloud.
Pros. Fast to build, appropriate for definitions, inclusion and exclusion criteria, reagent lists, and stepwise protocols. Some content is genuinely list-shaped, and pretending otherwise with a forced figure helps nobody.
Cons. This layout is where text walls are born. Bullets are also a weak tool for showing relationships, because a flat list hides hierarchy, causality, and mechanism. If you find yourself writing bullets with sub-bullets three levels deep, the content wants a schematic layout instead.
When to choose it. When the content is a genuine list of parallel items and each item is short. A good self-test: if you cannot say each bullet aloud in under five seconds, rewrite it or change layouts.
Figure-Dominant Layout
A figure-dominant slide gives one image most of the canvas, with a short title stating the finding and a small caption or annotation set. Variants include the full-bleed image, the large image with a side panel for annotations, and the multi-panel figure with panel letters called out.
Pros. This is the strongest layout for experimental science, because the evidence is the message. A large, well-annotated Western blot, micrograph, or gel forces the audience to look where you want them to look. It also keeps you honest, since a slide that cannot support one clear headline finding usually means the experiment does not support one either.
Cons. It demands good figures, which means exporting at high resolution, keeping fonts in the figure legible at projection size, and re-making figures that were designed for a journal page rather than a screen. A journal figure with eight panels, compressed to fit a slide, is unreadable from the fourth row.
When to choose it. Any time a single image carries the point. For multi-panel journal figures, split them across several slides and show each panel at the moment it becomes relevant, rather than shrinking the whole composite onto one slide.
Two-Column Comparison Layout
Two content zones side by side, usually with a visual divider or a versus framing. The pairs that recur in biology are control versus treatment, wild type versus knockout, before versus after, and method A versus method B.
Pros. When the scientific point is the contrast, the layout makes the contrast visible. Comparisons read left to right faster than they read top to bottom, and identical axes or identical framing on both sides make differences pop.
Cons. It doubles the content budget, and many presenters spend it on doubled text. Two dense text columns are harder to read than one, not easier. The layout works only when both columns are structurally parallel, meaning the same type of content sits in the same position on each side.
When to choose it. Paired data, competing models, and protocol comparisons. If the two columns are not parallel, use a single-column layout and handle the contrast verbally.
Data Chart Slide
One chart, one headline, minimal chart junk. The title states the finding ("Knockout delays wound closure by two days"), and the chart shows the evidence. The layout holds the chart large, the axis labels legible, and the statistical annotation present but not dominant.
Pros. It trains the audience to look for trends rather than raw numbers. It also maps cleanly onto how results sections are narrated, one experiment per slide, one conclusion per experiment.
Cons. It requires chart editing skills that default software settings do not encourage. Default gridlines, legends placed by the software rather than by logic, and rainbow color schemes all survive into far too many conference talks. Reducing each chart to its essential elements takes more time than building the slide itself.
When to choose it. Every quantitative result. If a result is not quantitative, it probably belongs in a figure-dominant or schematic layout instead.
Schematic or Flow Layout
A schematic slide shows a system as boxes and arrows, an experimental timeline, or a signaling pathway, built from shapes rather than text lists.
Pros. Mechanism is inherently spatial, and a good schematic encodes relationships that bullets cannot. It is also the natural layout for the "here is my experimental design" slide that committees and audiences expect early in a talk.
Cons. Schematics are the most time-consuming layout to build well. Misaligned arrows, inconsistent box sizes, and clip-art icons undermine credibility faster than almost any other slide defect. Build your schematics in a vector drawing tool or the software's own shape tools, align everything deliberately, and reuse them across talks.
When to choose it. Experimental design overviews, multi-step mechanisms, timelines, and any content where the relationships between parts are the message.
Takeaway or Summary Slide
A single conclusion, stated as one sentence, occupying most of the slide. Some presenters keep one takeaway slide per section, others keep one for the whole talk.
Pros. It gives the audience the sentence you want them to remember and repeat to colleagues who missed the talk. It also gives you a clean transition between sections.
Cons. If the takeaway simply restates the roadmap, it adds nothing. A summary slide earns its place only by compression, saying in one line what the preceding slides took five minutes to establish.
When to choose it. At section breaks and at the close. In question-heavy settings like committee meetings, a standing conclusions slide also gives examiners an anchor during discussion.
Backup Slides
Backup slides sit after the closing slide and are shown only in response to questions. Common contents are the raw gels behind a summarized figure, the full statistical model, alternative interpretations, and protocol details.
Pros. They let you answer anticipated questions with a prepared visual instead of a rambling verbal answer, which protects your remaining time and your composure.
Cons. They reward over-preparation. A sixty-slide backup stack suggests you could not decide what to cut from the main deck. Ten to twenty well-chosen backups cover most question sessions.
When to choose them. Job talks, thesis defenses, and any talk followed by extended questioning.
How to Compare Layouts: The Criteria That Decide Real Choices
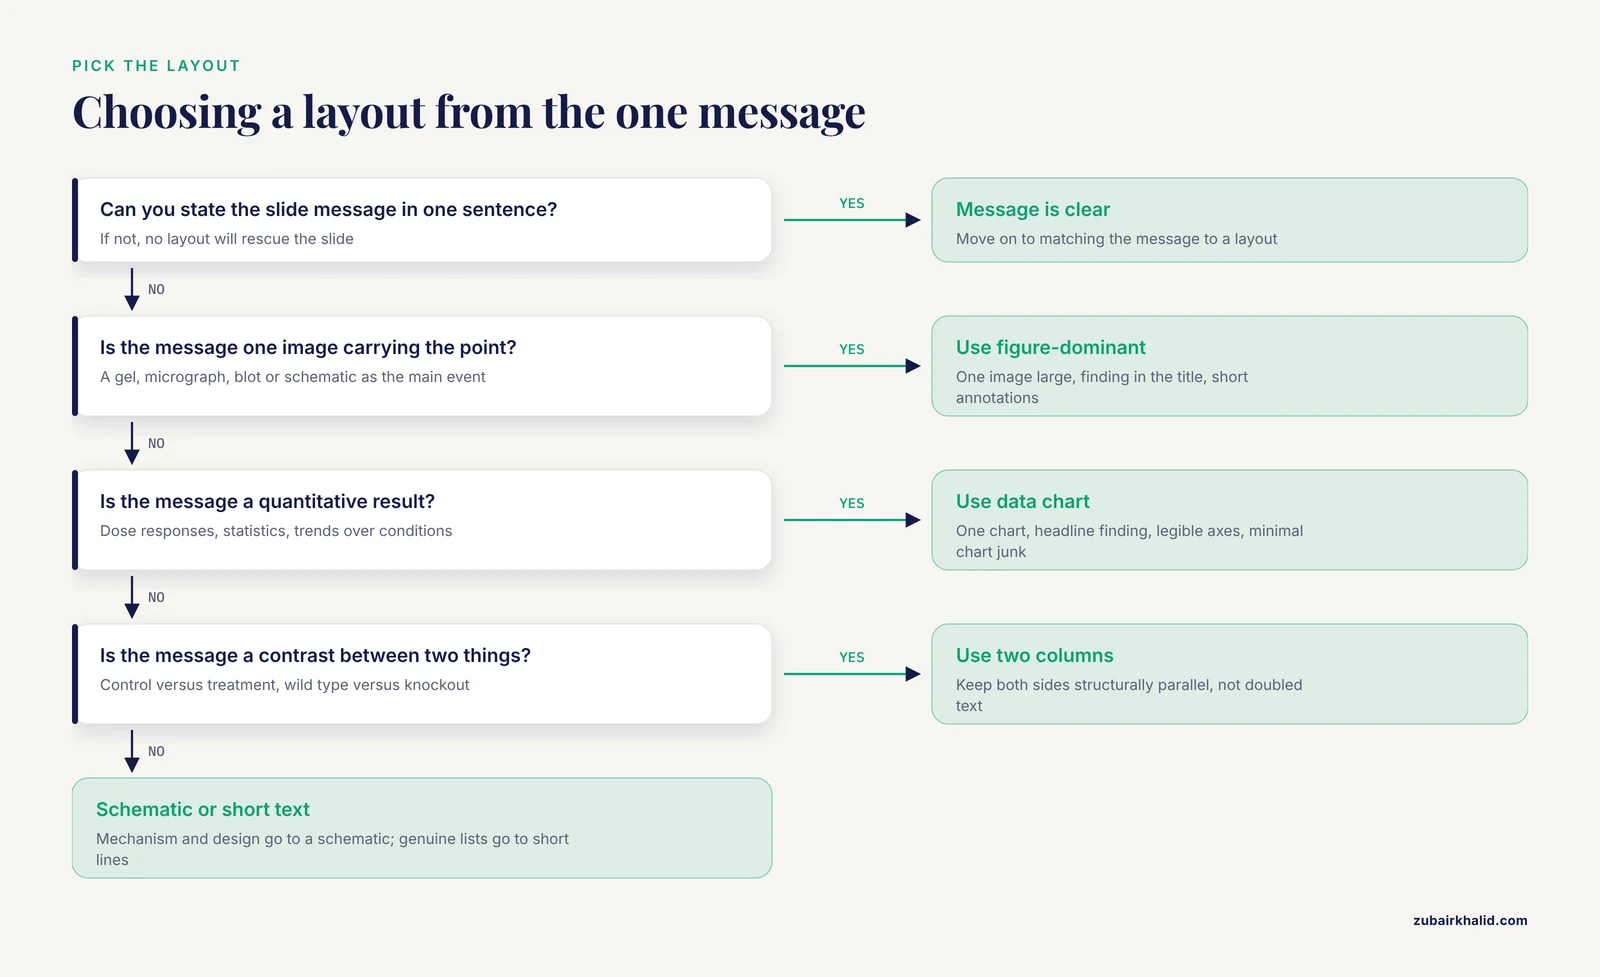
The pros and cons above describe each layout on its own terms. Real choices are decided by five criteria, applied in order.
1. What is the one message? This is the primary filter. A finding supported by one image points to a figure-dominant layout. A contrast points to two columns. A mechanism points to a schematic. If you cannot state the message in one sentence, no layout will rescue the slide.
2. Who is the audience and what do they already know? A specialist audience needs less scaffolding, so you can lean on figure-dominant and chart layouts and skip definitional text slides. A mixed audience, common at departmental seminars and conferences, needs the schematic and structured-text layouts to establish context before the data-heavy layouts appear.
3. How long is the talk? A widely used planning heuristic is roughly one content slide per minute, adjusted for slides you dwell on. Under this heuristic, a ten-minute talk carries about ten content slides plus title and backup slides, which leaves no room for layout padding like decorative section dividers.
4. What are the room and projection conditions? A large auditorium with a distant screen punishes small fonts, thin lines, and pale colors more than a small conference room does. Red slides on blue backgrounds, low-contrast gray text, and thin 1-point axis lines all vanish under projection. The published guidance on scientific presentations explicitly ties readability to attention given to layout, colors, and fonts [1], and the practical translation is simple: high contrast, large type, and dark text on light backgrounds unless the venue dictates otherwise.
5. What does the venue expect? Conference norms, committee expectations, and job-talk conventions differ. A defense expects an explicit experimental-design schematic and a limitations slide. A flash talk expects almost nothing but figures. Ask colleagues who have presented in the same venue, and check whether the organizer supplies a template with fixed layouts.
Worked Scenarios
Scenario 1. Ten-minute conference talk on one published experiment. Roughly ten content slides. Open with a title slide, skip the roadmap because the talk is short, and spend one schematic slide on experimental design. Give each result a figure-dominant or data chart slide, one message each. Close with a single takeaway slide and carry five backup slides for methods questions. The most common failure mode here is importing eight-panel journal figures directly, which forces you to say "ignore most of this slide" within the first minute of your results.
Scenario 2. Journal club presenting someone else's paper. The layout pressure inverts. You must convey a paper you did not design, so structured-text slides earn their place for summarizing the study question and key methods. Show the paper's central figure large, using a figure-dominant layout, and add your own annotation rather than reading the original caption aloud. A two-column layout works well for "what the authors claim" versus "what the data show," which is the analytical heart of a good journal club.
Scenario 3. Thesis committee meeting. Committees expect orientation, so include the roadmap. Show the project-level schematic once and reuse it with the current stage highlighted at each subsequent section break. Data chart layouts dominate the middle. End with a takeaway slide listing completed aims and a two-column layout comparing proposed versus completed work for the next period. Backup slides covering anticipated committee questions are standard and expected.
Scenario 4. Lab meeting progress update. Informal venue, expert audience, low stakes for polish. The roadmap can be one line spoken rather than a slide. Figure-dominant and chart layouts carry the update, and the schematic layout earns its keep when a new experimental direction needs explanation. The most common lab-meeting layout mistake is pasting raw notebook content, unedited and unzoomed, onto text-heavy slides.
A Closer Look at Slide-Based Data and Why Layout Extends to Your Figures
Some scientific slides contain data that themselves live on a physical slide, in the laboratory sense. Glycan microarrays and DNA microarrays are slide-based assays, and the way their results are arranged, charted, and reported is a layout problem in exactly the sense this article discusses. Work on glycan microarray reporting emphasizes presenting array data as charts, tables, and heatmaps, with filtering and sorting by monosaccharide content and glycan sequence, exported alongside metadata that follow community reporting guidelines so the data remain clear and evaluable for reproducibility [2]. Imaging systems for DNA microarrays similarly analyze spot distribution across the glass slide and evaluate geometric and intensity properties automatically [3]. The lesson for presentation design transfers directly. When your slide shows array heatmaps or spot images, arrange them the way the reporting frameworks arrange them, with consistent geometry, explicit scales, and metadata available on demand in your backup slides [2]. A heatmap without its color scale, or a microarray image without its grid orientation, is a layout failure that makes even excellent data unverifiable from the podium [3].
Building a Research Template for Your Lab
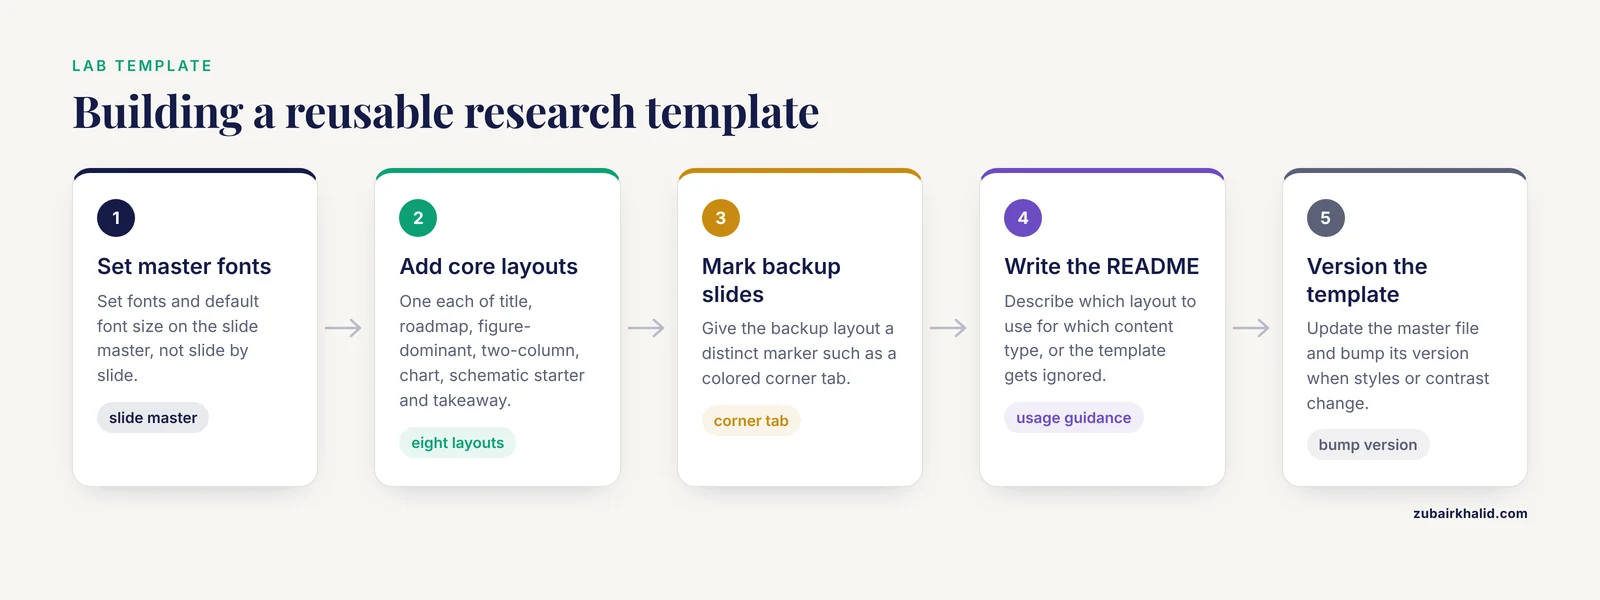
A reusable research template turns layout decisions from per-talk chores into one-time choices. Build it once in your slide master and every future deck inherits it.
What goes into the template. Your institution's colors and logo, one standard title slide layout, one roadmap layout, one figure-dominant layout, one two-column layout, one chart layout, one schematic starter page, one takeaway layout, and one backup-slide layout with a distinct marker such as a colored corner tab so you never accidentally present a backup slide. Set the fonts and the default font size on the master, not slide by slide.
Keep the template in a shared location with a short README describing which layout to use for which content type. A template without usage guidance gets ignored within a semester.
Distinguish the slide template from other lab documents. A slide template structures communication. A lab notebook template PDF structures record-keeping, capturing raw observations, dates, reagent lots, and deviations at the bench. The two serve different purposes and should not be merged. What connects them is workflow. The numbers you present on a data chart slide trace back to entries in your lab notebook, and clean bench records make clean figures. Many labs keep a lab notebook template PDF for each project, printed or filled electronically, precisely so that the numbers that eventually reach a chart slide have an unambiguous provenance. Keep both documents, use each for its own job, and your presentations become easier to build because the underlying record is already organized.
Version the template. When you improve a schematic style or fix a color-contrast problem, update the master file and bump its version. Colleagues presenting with last year's template fragments is a quiet, recurring source of inconsistent deck sets at multi-speaker events.
Common Mistakes and Limitations
Text walls. The single most common failure. Full sentences, paragraphs, and nested bullets force the audience to read while you talk, and audiences cannot do both well. If a slide needs more than a handful of short lines, split it or convert the content to a schematic.
Reading slides aloud. Turning your back to the audience to read your own slide converts a talk into a document reading session. Slides support the speaker, they do not replace the speaker. Thorough rehearsal with the actual slides, until you know the content well enough to face the audience, is an explicit recommendation in published guidance on scientific presentation [1].
One deck for every audience. Reusing a conference deck for a committee meeting, unchanged, ignores the different scaffolding each audience needs. Build the habit of re-opening the outline before reusing anything.
Journal figures pasted unmodified. Figures designed for print at small size carry small fonts and dense panels. Redraw or substantially edit them for projection, or split them across slides.
Inconsistent layouts within one deck. Titles jumping position, fonts changing, and bullet styles drifting between sections all read as carelessness. The slide master exists to prevent this, so use it.
Decoration over clarity. Transitions, animations, and stock imagery add delivery risk and no scientific content. Animation earns its place only when it sequences information, for example revealing pathway steps in the order you narrate them.
Ignoring the room until you arrive. Aspect ratio mismatches, washed-out projectors, and missing adapters are discovered at the podium too late. Verify the setup in advance whenever you can.
A limitation worth naming once. Layout advice improves the clarity of a presentation, but it cannot fix weak science, and no layout guarantees a talk lands with every audience member. Individual talks also vary with venue norms, institutional templates, and presenter style, so treat the options above as a decision framework rather than a rigid rulebook.
Frequently Asked Questions
What is the best scientific presentation slide layout?
There is no single best layout for an entire deck. The best approach is one message per slide, matched to the layout that expresses it, which usually means a mix of figure-dominant and data chart layouts for results, a schematic for experimental design, and structured text only for genuinely list-shaped content.
How many slides should a ten-minute talk have?
Plan roughly one content slide per minute, so about ten content slides plus a title slide and a few backups. Slides you dwell on reduce this number, and a short conference talk usually does not need a roadmap slide at all.
Should I use bullet points on my scientific slides?
Use them sparingly and only for genuinely parallel list content, with short phrases rather than full sentences. Bullets hide hierarchy and relationships, so content describing a mechanism or a flow belongs in a schematic layout instead.
What layout works best for presenting data figures?
A figure-dominant layout, with the image large, the finding stated in the slide title, and annotations added for projection. Split multi-panel journal figures across several slides rather than shrinking the whole composite onto one.
How is a slide template different from a lab notebook template PDF?
A slide template controls the styling and layout zones of your presentation deck, while a lab notebook template PDF structures bench-level record-keeping of raw observations, reagent lots, and dates. They serve different jobs, and the notebook is where the numbers that later appear on your chart slides should originate.
How do I keep slides readable in a large auditorium?
Use high-contrast colors, dark text on light backgrounds, large fonts, and thick chart lines, and test the actual room and projector in advance when possible. Readability depends on layout, colors, and fonts working together, not on font size alone.
Sources
- [[Methods of Scientific Presentation and Announcement].](https://pubmed.ncbi.nlm.nih.gov/34992164/)
- CarbArrayART: a new software tool for carbohydrate microarray data storage, processing, presentation, and reporting.
- DNASER I: layout and data analysis.