Science Fair Research Paper Template: Adapting for Student Projects
By Dr. Zubair Khalid, DVM, MS, PhD ·
By the end of this guide you will have a complete, fill-in-the-blanks science fair research paper template, a worked example based on a realistic student project, a lab notebook layout that feeds directly into the paper, and a step-by-step workflow that takes you from a rough question to a bound, judge-ready document. You do not need special software. Have on hand a word processor or a plain text editor, a spreadsheet program such as Excel, Google Sheets, or LibreOffice Calc, and either a bound notebook or a printed lab notebook template you can fill in by hand.
A template does the structural thinking for you so you can spend your energy on the experiment. National surveys of high school Science and Engineering Fair students, run during the 2021-22 and 2022-23 school years, asked 1,789 students which communication practices they used in their projects. The listed practices included the literature review, the research notebook, software for preparing tables, graphs, and images, the written report, poster preparation, slide presentations, and the judge interview [1]. The written report sits at the center of that list. A good template turns the report from a last-week scramble into a record of decisions you already made.
Why a Template Works for Science Fair Projects
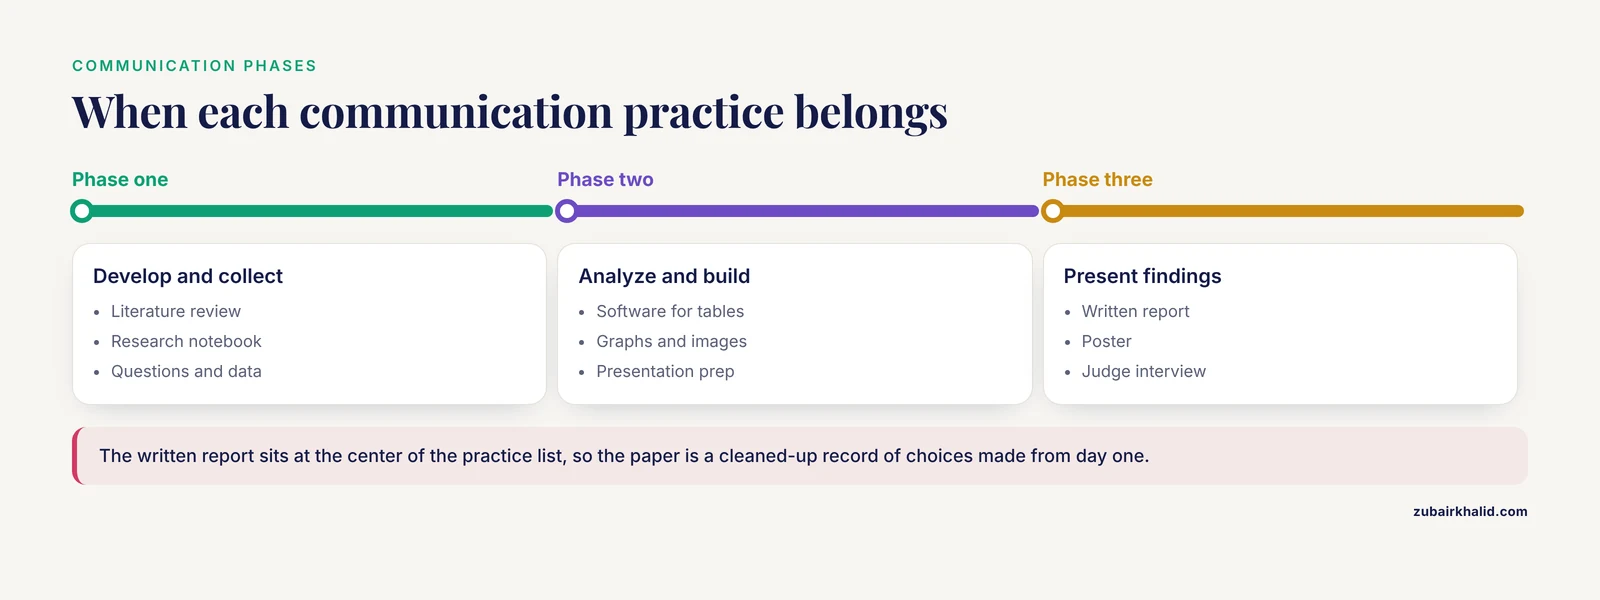
The survey work on science fair students makes one point very clearly. Communication is not a separate stage bolted onto the end of research. It is part of the research itself. The literature review and the research notebook belong to the phase where students develop research questions and collect data. Software for tables, graphs, and images belongs to the phase where students analyze results and build a presentation. The written report, the poster, and the judge interview belong to the phase where findings are presented [1].
That means the paper you submit is really a cleaned-up version of choices you make from day one. When you organize those choices in advance, three things happen:
- You notice gaps early. A template asks for a materials list in week one, so you discover missing supplies before experiment day.
- You write less from scratch. Every section of the paper draws on something you already produced, such as notebook entries, spreadsheet summaries, or citation notes.
- You answer judges better. Judges ask questions the paper already answers, so you respond from evidence instead of memory.
A survey of 1,789 students confirms that students who reach fair outcomes rely on this full chain of practices rather than a single polished poster [1]. The template below builds that chain deliberately.
The Science Fair Research Paper Template Format
Most fairs accept the same basic structure, which mirrors the IMRaD format (Introduction, Methods, Results, and Discussion) used in professional journals. The exact page limits vary by fair, so treat the lengths below as proportions to scale up or down. This is the core science fair research paper template format, with the purpose of each section spelled out so you know what judges look for.
| Section | Purpose | Suggested length in a 10 to 15 page paper |
|---|---|---|
| Title page | Names the project, student, school, and date | 1 page |
| Abstract | Summarizes question, method, result, and conclusion in one paragraph | 150 to 250 words |
| Introduction and literature review | Establishes what is known and why your question matters | 2 to 3 pages |
| Question and hypothesis | States the testable prediction | Half a page |
| Materials and methods | Lists materials and describes procedures so another student could repeat them | 2 to 3 pages |
| Results | Presents data in tables and figures with no interpretation | 2 to 3 pages |
| Discussion | Explains what the results mean, compares them to published work, admits error sources | 2 to 3 pages |
| Conclusion | Restates the answer to your question in two or three sentences | Half a page |
| Acknowledgments | Credits people who helped, such as a mentor who reviewed safety plans | A few lines |
| References | Lists every source cited, in a consistent style | 1 page |
Two sections deserve special attention because students misjudge them most often.
The abstract is a compressed version of the whole paper, not a teaser. It states the question, the method in one sentence, the main numerical result, and the conclusion. Judges often read the abstract before anything else, and some fairs require submitting it separately.
The literature review is not a book report. It is a short argument that your question is worth asking and that you know how other people have approached it. Three to five solid sources, cited properly, beat fifteen websites skimmed for quotes.
Step-by-Step Walkthrough With a Worked Example
This walkthrough uses a realistic middle or high school project: testing whether the color of light affects how quickly bean seeds germinate. Every example value shown is invented for demonstration and marked as such, so you can see exactly what your own numbers should look like.
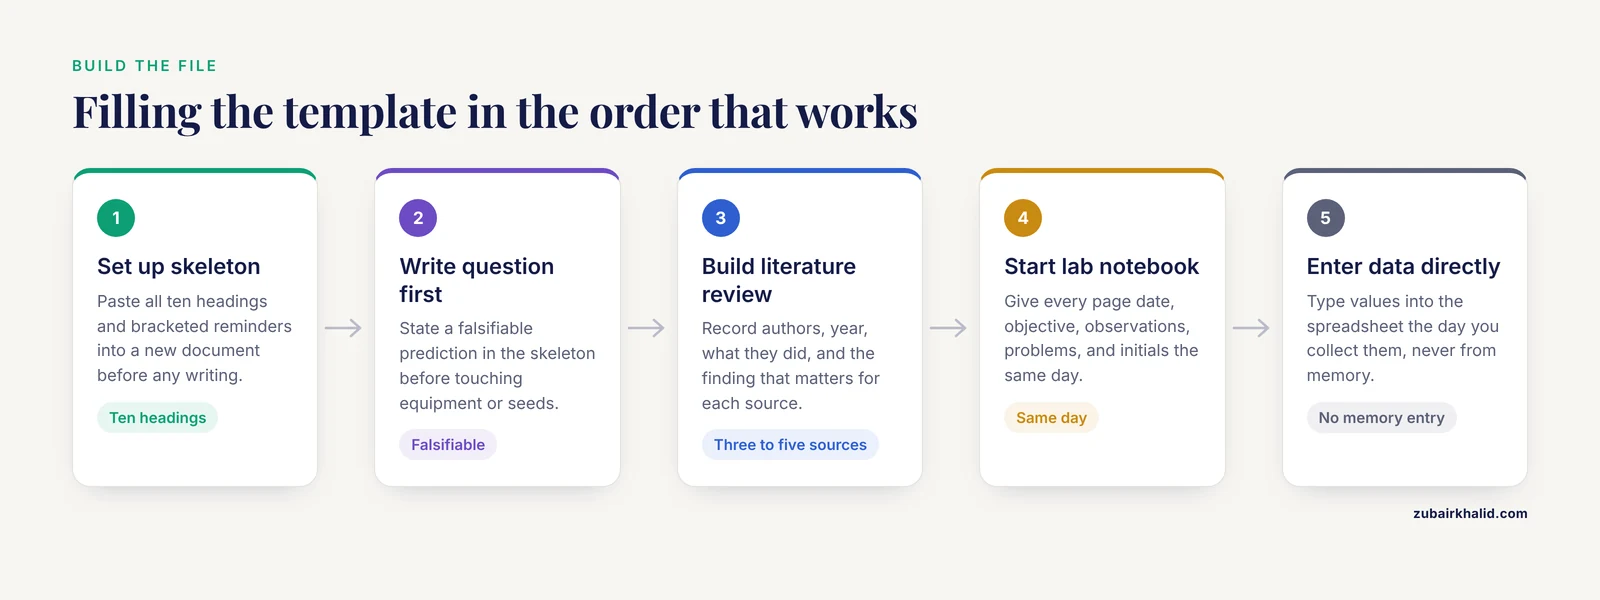
Step 1: Set up the skeleton file
Create a new document and paste this skeleton. Saving the headings first means you can drop notes into the right place as you go.
The Effect of Light Color on Bean Seed Germination Rate
[Your Name], [School], [Date]

ABSTRACT
(paste last)

INTRODUCTION AND LITERATURE REVIEW
- What is germination and what factors control it
- What published studies say about light and germination
- Why this question matters (food production, classroom relevance)

QUESTION AND HYPOTHESIS
Question: How does light color affect the germination rate of
bush bean seeds over 7 days?
Hypothesis: Seeds grown under red light will germinate faster
than seeds grown under blue, green, or white light, because ...

MATERIALS AND METHODS
Materials:
- 40 bush bean seeds (same packet, same lot)
- 4 seedling trays with 10 cells each
- Red, blue, green, and white LED grow lights (same wattage)
- Potting soil, 250 mL beaker, ruler marked in mm
- Growth chamber or dark closet at approximately 22 degrees C
Procedure:
1. Fill each cell with the same volume of soil.
2. Plant one seed 2 cm deep in each cell.
3. Assign trays to light treatments. Darken all sides except
   the lamp side so the only difference is light color.
4. Water each cell with 30 mL of water every 24 hours.
5. Count germination (radicle visible) at the same time daily
   for 7 days.
6. Measure seedling height in mm on day 7.

RESULTS
Table 1. Germination counts by day and treatment
Figure 1. Cumulative germination curves
Table 2. Day 7 seedling heights

DISCUSSION
- What the data show
- How this compares to published work
- Sources of error and limitations

CONCLUSION

ACKNOWLEDGMENTS

REFERENCES
Expected result: a document with all ten headings and a handful of bracketed reminders. Nothing else yet. That is correct at this stage.
Step 2: Write the question and hypothesis before touching equipment
A hypothesis is a prediction you can prove wrong. "Seeds need light" is vague. "Seeds grown under red light will show radicle emergence sooner than seeds under green light" is specific and falsifiable. Write it in the skeleton now, even if you revise it later. Revising a written prediction is good science. Never changing one after seeing the data is how honest projects drift.
Step 3: Build the literature review from three to five real sources
Search your school library database, Google Scholar, or PubMed for terms like "light color seed germination." For each useful source, record four things: authors, year, what they did, and the one finding that matters to you. Then write one to two sentences per source explaining how it connects to your question.
Format each reference in a consistent style. A common choice for student work is APA style, which looks like this for a journal article:
Author, A. B., & Author, C. D. (2020). Title of the study.
Journal Name, 12(3), 45-58. https://doi.org/10.1234/example
Keep a running citation list in a separate file as you read. Reconstructing references from memory the night before the deadline is the single most common source of citation errors.
Step 4: Set up the lab notebook the same day
The research notebook is one of the practices science fair students themselves identify as central to developing questions and collecting data [1]. Whether you use a bound notebook or print a lab notebook template PDF, give every page the same structure:
| Field | What to write | Example |
|---|---|---|
| Date and time | When the entry was made | 2026-02-03, 08:15 |
| Objective | What you plan to do this session | Plant all 40 seeds |
| Procedure changes | Anything different from the written method | Tray 2 lamp replaced, same model |
| Observations | Raw counts, measurements, sketches | 3 radicles visible in red tray |
| Problems | What went wrong | Green lamp flickered for 10 min |
| Signature | Initials, and a mentor countersignature if your fair requires one | JK |
Photograph or scan notebook pages weekly. If your fair asks for a digital copy, you will already have it.
Step 5: Record data directly into a spreadsheet
Set up one sheet with columns for treatment, cell number, day, and germination status, plus a separate sheet for heights. Enter values the day you collect them, never from memory. A row of raw data looks like this:
treatment,cell,day,germinated
red,1,1,0
red,1,2,1
red,2,2,0
blue,1,2,0
The first row is a header row naming each column, including units where relevant. This plain structure matters later when you build figures.
Step 6: Analyze the data with simple, honest statistics
For each treatment, calculate the mean germination day and the standard deviation, which measures how spread out the values are. In Google Sheets or Excel, with germination day values for the red tray in cells B2 through B11:
=AVERAGE(B2:B11)
=STDEV.S(B2:B11)
=COUNTIF(C2:C11, ">0")
Expected output for a demonstration dataset, using invented numbers:
Mean germination day (red):     3.4
Standard deviation (red):       0.84
Seeds germinated (red):         9 of 10
Report both the mean and the standard deviation in your results table, for example "3.4 days (SD 0.84)". Reporting spread, not just averages, is what separates a strong results section from a weak one. If a seed never germinated, exclude it from the germination-day average and say so in the methods or results text.
Step 7: Make figures with graphing software
Preparing tables, graphs, and images with software is a named practice among science fair students [1], so do it deliberately rather than screenshotting your spreadsheet. Rules that make figures judge-friendly:
- Label both axes with the quantity and the unit, for example "Days after planting" and "Cumulative seeds germinated".
- One figure, one message. Do not pile four variables onto one chart.
- Caption every table and figure below the item, numbered in order, for example "Table 2. Mean seedling height on day 7 by light treatment."
- Refer to each item by number in your text. A figure no paragraph mentions is dead weight.
Step 8: Write results and discussion in the right order
The results section states what happened. No reasons, no excuses. "Seeds under red light germinated in a mean of 3.4 days compared with 4.8 days under green light." The discussion then interprets. Compare your numbers to the published studies you cited, name at least two sources of error honestly, such as lamp distance variation or seed lot differences, and explain what you would change with 40 more seeds and another month.
Step 9: Write the abstract last
Copy one sentence from each major section and compress:
This study tested whether light color affects the germination
rate of bush bean seeds. Forty seeds were grown for 7 days under
red, blue, green, or white LED light at equal intensity, with
germination checked every 24 hours. Seeds under red light
germinated in a mean of 3.4 days versus 4.8 days under green
light. These results suggest that red light accelerates early
germination in this seed lot, though lamp placement variation
limits the strength of the conclusion.
Question, method, result, limitation, all in four sentences. If a judge reads nothing else, this paragraph carries your project.
Step 10: Format, check, and print
Set the document to a standard font, double-space the body text, number pages, and put tables and figures either inline near their first mention or grouped after the results, whichever your fair's rules specify. Then run this final check:
- Every figure and table is numbered and mentioned in the text.
- Every citation in the text appears in the reference list, and vice versa.
- Units appear on every measurement.
- The methods would let a stranger repeat the experiment.
- The abstract matches the numbers in the results exactly.
Borrowing Professional Habits: FAIR Data and Metadata
The template above is a scaled-down version of habits that professional research runs on, and it is worth understanding where they come from. The FAIR principles, a widely adopted framework in the open science movement, state that research data should be Findable, Accessible, Interoperable, and Reusable. Reviews of FAIR implementation frameworks compare them across dozens of technical parameters, which tells you how seriously the research community treats data organization. Architectural studies of FAIR-compliant repositories describe the same challenge at scale, where huge volumes of data and metadata must stay organized and machine-readable [2].
You can borrow the spirit of FAIR in three small moves:
- Give every data file a name that explains itself, such as
2026-02-10_germination_red-trial.csv, rather thandata2.xlsx. - Add a plain text README file with each dataset that lists column meanings, units, and any deviations from the planned method.
- Keep the raw data untouched. Do analysis in a copy, so the original record always survives.
Metadata, meaning the descriptive information that surrounds data, is its own discipline in professional science. Projects such as the MatCore effort in materials science exist specifically to build unified metadata standards so that computational results from different labs can be understood together [3]. Your README file is a kindergarten version of the same idea, and it costs ten minutes.
The professional world even has a publication type, the data paper, whose entire job is to describe a dataset so that other researchers can find, evaluate, and reuse it [4]. Your results section, which presents data cleanly with units and methods, is the same skill in miniature. Preservation matters too. Studies of long-term research data preservation note that digital records decay quickly when nobody takes responsibility for maintaining them [5]. Back up your notebook scans and spreadsheets to a second location the same week you create them.
There is also a lesson in how professional reviews are built. Guidelines projects in clinical research often use a structured extraction template guided by a framework defined in advance, refined by an advisory group, and applied consistently across all sources [6]. Your literature review table, with the same four columns filled for every source, is exactly that method at student scale.
Documenting AI Use Honestly
If you use a generative AI tool at any stage, whether for brainstorming questions, editing prose, or summarizing a source, treat the interaction as something to document rather than hide. Recent work on governing AI in science proposes treating AI interactions as structured, inspectable components of the research process, where the legitimacy of an AI-assisted paper depends on how model use is documented and made accountable, with records of model configuration, prompts, and outputs preserved as provenance [7]. You do not need their full technical framework. A simple AI use log meets the standard:
Date: 2026-02-05
Tool and version: [name the tool and model]
Prompt: "Explain how phytochrome in seeds responds to red light"
Use of output: background understanding only, no text copied
into the paper
Attach this log as an appendix if your fair allows it, or describe AI use in your methods section. What undermines a project is undocumented use, not use itself. Also verify anything an AI told you against a real source before citing it, because generated text can be confidently wrong.
Preparing for Judges: Turning the Paper Into a Poster and a Talk
The survey of science fair students identified judge interviews as a distinct communication practice, separate from the written report and the poster [1]. Preparation is mostly reuse:
- Your results tables become poster figures, usually one main graph and one supporting table.
- Your abstract becomes your two-minute spoken summary. Read it aloud three times and time it.
- Your discussion section predicts most judge questions. If you wrote down error sources there, you already have answers ready.
- Bring your notebook. Judges who see dated, signed, honest entries trust the numbers more.
Common Mistakes and Limitations
- Writing the abstract first. You will rewrite it anyway once the data arrive. Always write it last.
- Putting interpretation in the results section. Results report what happened. The discussion explains why.
- Pasting raw spreadsheet dumps into the paper. Judges want summary tables and figures, with raw data available in an appendix or notebook on request.
- Missing units. "Height: 23" means nothing. "Height: 23 mm" means something.
- Citing sources you did not read. If you cannot say what a paper did, do not list it. A short reference list of genuinely read sources is stronger than a long one of skimmed titles.
- Notebook gaps. A missing week of entries makes judges doubt the whole dataset. Write an entry even on days when nothing worked, especially then.
- Changing the hypothesis after seeing the data without saying so. If your results surprised you, that is a finding. Report the original hypothesis and discuss what you learned.
- Ignoring your fair's own rules. Page limits, required forms, and safety approval vary by fair and by grade level. Check your local and regional fair's official guidelines before formatting the final document, since no general template can substitute for those rules.
- Overclaiming. Ten seeds in one trial support a cautious conclusion about that seed lot under those conditions. Words like "suggests" and "under these conditions" are not weaknesses. They are what accurate science sounds like.
Individual fairs can also impose requirements this general template cannot anticipate, such as mandated safety forms for projects involving vertebrate animals, human subjects, or regulated microbes. Read your fair's rules document early, and ask your teacher or fair coordinator when a rule is unclear.
Frequently Asked Questions
What is a science fair research paper template?
It is a pre-organized document skeleton containing every standard section of a science fair paper, from title page to references, with prompts and placeholders that tell you what belongs in each section. You fill it in as your project progresses instead of writing the paper from a blank page at the end.
What sections does the standard science fair research paper template format include?
The standard format includes a title page, abstract, introduction with literature review, question and hypothesis, materials and methods, results, discussion, conclusion, acknowledgments, and references. This mirrors the IMRaD structure used in professional research journals, adjusted for student work.
How long should a science fair research paper be?
Most middle and high school papers run roughly 10 to 15 pages, double-spaced, but every fair sets its own limits. Scale the section proportions in the template table above to whatever length your fair specifies, and prioritize complete methods and honest results over hitting an exact page count.
Where can I find a free science fair research paper template?
This article contains a complete free science fair research paper template in the Step 1 code block that you can copy into any word processor, along with a lab notebook table you can recreate on paper. Your teacher, school library, or the official website of your specific fair may also provide one tailored to local rules.
How do I write the abstract for my science fair paper?
Write it last, in one paragraph of about 150 to 250 words covering four things: your question, your method in a single sentence, your main numerical result, and your conclusion including one honest limitation. Match every number in the abstract exactly to the results section.
How many sources do I need for the literature review?
Three to five sources you have actually read, each connected to your question with a sentence or two of your own analysis, will outperform a longer list of skimmed web pages. Choose peer-reviewed articles or books when possible and cite them in one consistent style.
What goes in a lab notebook and how does it connect to the paper?
Every dated entry should record the objective, the procedure followed, raw observations and measurements, any problems, and your initials. Survey research on science fair students identifies the research notebook as a core practice tied to developing questions and collecting data, and your methods and results sections are largely rewritten from those entries.
Can I use AI tools when writing my science fair research paper?
Check your fair's rules first, and if use is allowed, document every interaction in a log recording the date, the tool, the prompt, and how you used the output. Current research on AI in science supports exactly this approach, treating documented AI interactions as accountable parts of the research record rather than something to hide.
Sources
- High school science fair: Characterizing student communication and presentation practices and their association with SEF outcomes.
- Big Data Architectures for FAIR-compliant Repositories: A Systematic Review
- Towards MatCore: A Unified Metadata Standard for Materials Science
- Publish-Review-Curate Modelling for Data Paper and Dataset: A Collaborative Approach
- FAIR Forever? Accountabilities and Responsibilities in the Preservation of Research Data
- Developing forensic patient-oriented research guidelines: a rapid review using an integrated knowledge translation approach.
- Inspectable AI for Science: A Research Object Approach to Generative AI Governance