Science Fair Project Checklist Template
By Dr. Zubair Khalid, DVM, MS, PhD ·
By the end of this article you will have a working science fair project checklist template for your own project, a lab notebook structure that survives judge questions, a worked example showing how to turn raw measurements into a result, and a short list of the mistakes that cost students the most points. You need a bound or composition notebook, a spreadsheet program such as Excel, Google Sheets, or LibreOffice Calc, and a calendar with your fair date marked on it.
A checklist sounds trivial. It is not. National surveys of high school Science and Engineering Fair students show that the practices judges and organizers care about map directly onto checklist items. Out of 1,789 students surveyed nationally, the most commonly used practices included the literature review, the research notebook, software for preparing tables and graphs, the written report, poster board preparation, a slide presentation, and the interview with the judges [1]. Every one of those practices is a checklist line item. Students who track them from day one finish with a coherent project. Students who improvise usually scramble in the final two weeks.
The same habit shows up in professional science. Systematic reviewers use structured checklists such as the JBI checklist to judge the quality of every study they include [2]. Research programs that produce large shared datasets rely on templates for data management, standardized metadata, and documented decisions at every step [3]. Your science fair project is a small version of the same workflow, and the template below borrows from both worlds.
Why a Checklist Template Beats a Blank Page
A blank page invites two failure modes. The first is drift, where the question quietly changes halfway through and the data no longer answer anything. The second is missing records, where a student cannot remember which plant got which treatment or what the units were.
A science fair project checklist template solves both problems because it forces three commitments early:
- A written question that stays fixed.
- A notebook where every measurement lands with a date, a unit, and a condition label.
- A planned analysis, so you know what graph you are building before you collect data.
The payoff shows up at the end. When judges interview students, they ask about the reasoning behind choices, and students who used a research notebook throughout the project can answer from evidence rather than memory [1]. Even the topic selection stage benefits from structure. An analysis of five decades of student science fair projects in Taiwan, from 1970 to 2025, found that dentistry-related projects clustered around recurring themes, which tells you that surveying existing project categories is a legitimate early step rather than a shortcut [4].
The Master Checklist Template
Copy this into a document, a spreadsheet, or the first page of your notebook. Check items off only when the deliverable physically exists.
SCIENCE FAIR PROJECT CHECKLIST

PHASE 1 - QUESTION AND BACKGROUND  (target: weeks 1-2)
[ ] Topic chosen and approved by teacher
[ ] Testable question written in one sentence
[ ] Background research from at least 3 credible sources
[ ] Source list started (author, title, year, URL or page)
[ ] Variables identified: independent, dependent, controlled

PHASE 2 - DESIGN  (target: weeks 2-3)
[ ] Hypothesis written as an if/then statement
[ ] Materials list complete with quantities
[ ] Step-by-step procedure numbered
[ ] Number of trials decided (3 or more per condition)
[ ] Safety review done, forms signed if required
[ ] Data table sketched with units in column headers

PHASE 3 - DATA COLLECTION  (target: weeks 3-6)
[ ] Notebook page numbered and dated for every session
[ ] Every measurement recorded same day, with units
[ ] Conditions labeled on every row (which sample, which group)
[ ] Photos taken of setup and unexpected events
[ ] Problems and changes logged, not erased

PHASE 4 - ANALYSIS  (target: weeks 6-7)
[ ] Raw data entered into spreadsheet
[ ] Averages and spread calculated for each condition
[ ] At least one graph made (correct chart type for the data)
[ ] Pattern described in one sentence
[ ] Result compared back to the hypothesis

PHASE 5 - REPORT AND DISPLAY  (target: weeks 7-8)
[ ] Written report drafted (intro, methods, results, discussion)
[ ] Graphs and tables labeled with titles and units
[ ] References formatted consistently
[ ] Display board built: question, methods, results, conclusion visible
[ ] Board readable from about 1 meter

PHASE 6 - PRESENTATION  (target: final week)
[ ] 2 to 3 minute talk rehearsed out loud at least 3 times
[ ] Predicted judge questions listed with answers
[ ] Notebook, report, and board packed the night before
The week targets assume roughly an eight-week runway, which fits most school timelines. Shift them proportionally if your fair is closer. The order does not change.
Step by Step Walkthrough With a Worked Example
This walkthrough follows one concrete project so every checklist item has a real output: "Does soil type affect the height of bean seedlings after 14 days?"
Step 1. Fix the Question and Identify Variables
Write the question in one sentence and name three things:
- Independent variable, the thing you change. Here, soil type (potting soil vs. sandy soil).
- Dependent variable, the thing you measure. Here, seedling height in centimeters on day 14.
- Controlled variables, everything held constant. Here, seed variety, water volume per day (50 mL), light exposure, pot size, and starting date.
If you cannot name all three, the project is not ready for data collection. This single step prevents the most common late-project disaster, which is realizing the data cannot answer the question.
Step 2. Set Up the Data Table Before Collecting Anything
Sketch the table in the notebook first. Units go in the headers.
| Pot | Soil type | Day 0 height (cm) | Day 7 height (cm) | Day 14 height (cm) |
|---|---|---|---|---|
| A1 | Potting | 1.0 | ||
| A2 | Potting | 1.2 | ||
| B1 | Sandy | 1.1 | ||
| B2 | Sandy | 1.0 |
A row that says "A1, potting, 3.2" with no unit is a row you will argue with yourself about in week seven. The header says centimeters once, so every entry inherits it.
Step 3. Collect Data With Three or More Trials Per Condition
Run at least three pots per soil type. Three is the conventional minimum that lets you see whether one weird seedling is a trend or an accident. Record on the same day you measure, in ink, in the notebook. If a seedling dies, write that down. Professional data practice treats the record of what actually happened, including failures, as part of the dataset, and documentation of analytic decisions is a core expectation in modern research data frameworks [3].
Step 4. Calculate the Result
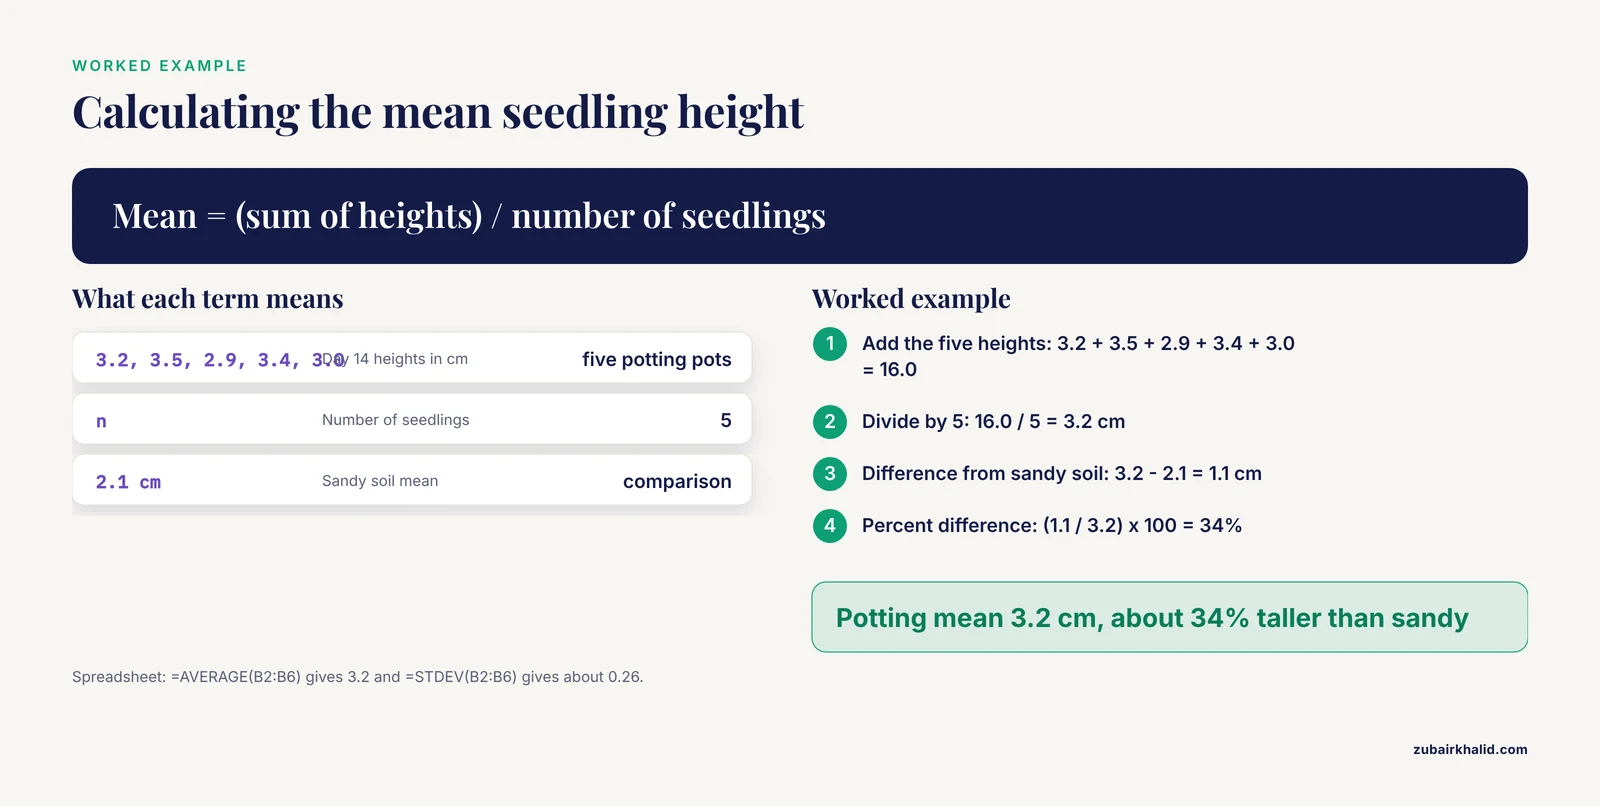
Enter data into a spreadsheet and compute the average (mean) height per condition. Here is the calculation for five potting-soil seedlings measured on day 14:
Heights (cm): 3.2, 3.5, 2.9, 3.4, 3.0

Mean = (3.2 + 3.5 + 2.9 + 3.4 + 3.0) / 5
     = 16.0 / 5
     = 3.2 cm
Expected output in a spreadsheet cell: 3.2
For spread, compute the range or, in a spreadsheet, the standard deviation:
Spreadsheet formula:  =AVERAGE(B2:B6)     → 3.2
                     =STDEV(B2:B6)       → about 0.26
Then compute the difference between conditions and express it relative to the control:
Potting soil mean:      3.2 cm
Sandy soil mean:        2.1 cm
Difference:             1.1 cm
Percent difference:     (1.1 / 3.2) × 100 = 34%
Expected sentence for your results section: "Seedlings in potting soil averaged 3.2 cm on day 14, about 34 percent taller than the 2.1 cm average in sandy soil." That sentence, with the numbers behind it in the notebook, is the core of your project.
Step 5. Choose the Right Graph
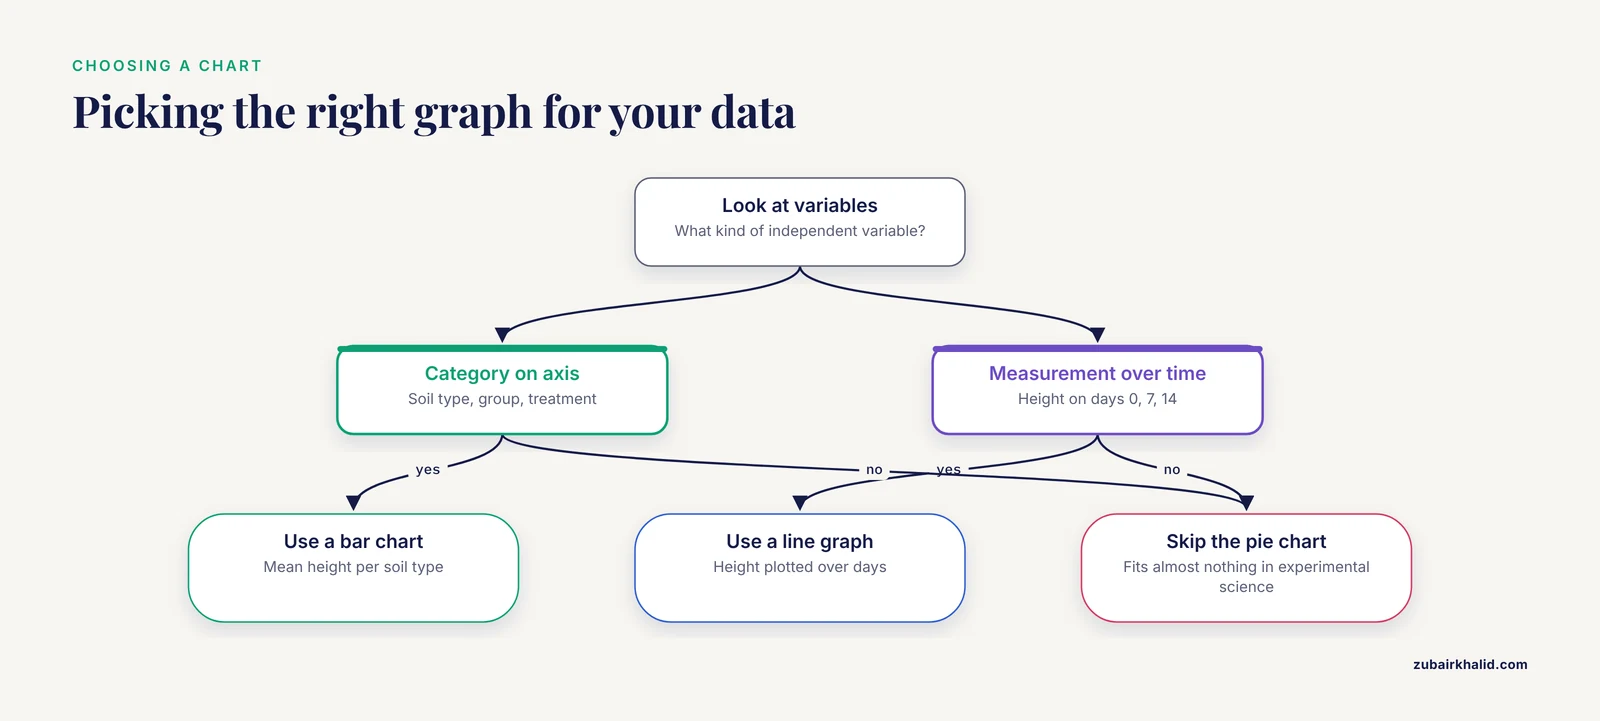
A bar chart fits this example because the independent variable (soil type) is a category and the dependent variable (mean height) is a number. A line graph would fit if you plotted height over days for each soil type. A pie chart fits almost nothing in experimental science. Label both axes with the variable and the unit, for example "Mean height (cm)" on the y-axis.
Step 6. Compare Back to the Hypothesis
State whether the data supported the hypothesis, in that direction-specific language. "Supported" and "not supported" are both complete answers. A hypothesis that fails is a valid result, and judges respect a student who says so plainly.
A Lab Notebook Template You Can Print or Copy
Many students search for a lab notebook template pdf, and downloadable versions exist from university outreach programs and science fair organizations. The specific file matters less than the structure. Any printed or handwritten page works if it contains these fields:
LAB NOTEBOOK PAGE

Date: ________  Page: ____  Project: ______________

Today's goal (one line):
_____________________________________________

Procedure followed today (numbered steps or reference
to procedure page #):
_____________________________________________

Observations and data:
  Measurement | Value | Unit | Condition/label
  ___________ | _____ | _____ | ______________
  ___________ | _____ | _____ | ______________

Problems, surprises, or deviations:
_____________________________________________

Next step:
_____________________________________________
Signed: ________ (some fairs require witness initials)
Two conventions make this notebook credible to judges. First, never erase. Draw one line through a mistake and write the correction beside it, so the record shows what happened and when. Second, record the conditions label on every row of data. In large collaborative research projects, shared naming conventions and controlled labels for samples are what allow data from different people to be combined at all, and the same discipline scales down to a single notebook.
Data Habits Borrowed From Professional Research Templates
The FAIR principles, which stand for Findable, Accessible, Interoperable, and Reusable, guide how professional research data are managed, and they translate directly to student scale [5]. You are not required to follow them, but four of their habits will make your project stronger and easier to defend:
- Name files and samples consistently. "A1_day14.txt" beats "final2_REAL.txt". Large research platforms build their entire data organization around standardized naming so results can be found and compared later [6].
- Keep the raw data. Keep the spreadsheet of original measurements separate from the graph-making copy. Analysts in large data projects preserve provenance, meaning the documented trail from raw data to final figure, so anyone can retrace the result [3].
- Write down decisions. If you exclude a dead seedling or average two readings, log the decision and the reason. Modern data-science frameworks treat documentation of analytic decisions as part of the research product itself, not an afterthought [3].
- Make your labels mean what they say. When you label a measurement, the label should still truthfully describe what was actually measured. Researchers studying data quality emphasize that descriptors and labels must remain accurate at the point of use, not just at the moment of collection [7].
A lighter version of this thinking appears in the FAIR readiness concept from plant biology research, which treats data quality as a spectrum rather than a pass or fail test. A student project does not need machine-readable metadata, but richer labeling and traceable provenance reliably improve how well the work holds up [8]. Structured training programs in responsible research practice list FAIR data handling among their core skill areas, alongside research integrity and science communication, which is essentially the same skill set your checklist is building [9].
Timeline and Phase Summary
| Phase | Typical timing | Key deliverable | Most common failure |
|---|---|---|---|
| Question and background | Weeks 1 to 2 | One-sentence testable question | Question too broad to test |
| Design | Weeks 2 to 3 | Numbered procedure and blank data table | No decided number of trials |
| Data collection | Weeks 3 to 6 | Complete notebook with dated entries | Loose-leaf data recorded days later |
| Analysis | Weeks 6 to 7 | One graph and one results sentence | Graph with unlabeled axes |
| Report and display | Weeks 7 to 8 | Report and finished board | Board text too small or dense |
| Presentation | Final week | Rehearsed talk and predicted Q&A | First rehearsal is the fair itself |
Science Fair Project Checklist Template Tips
Use the checklist as a weekly gate, not a decoration. Spend five minutes each Sunday going down the list. If an unchecked item belongs to a phase you are already past, fix it that week. Small gaps, such as a missing unit or an unlogged change, are cheap to repair early and expensive to reconstruct later.
Match the checklist to your project type. An engineering or invention project replaces the data table with a design-iterations log and a test-results table. A survey or observational project replaces the trials with a sample-size plan and a consent or permission step if you are interacting with people. The phases stay identical. Analysis projects done entirely in software still need the notebook, because judges want to see the decisions behind the code.
Prepare the judge interview as its own deliverable. The interview with judges is a recognized, distinct communication practice in science fairs, separate from the poster and the written report [1]. Write down the ten questions you would ask if you were the judge, then answer them out loud. The predictable set includes "Why did you choose three trials?", "What would you do differently?", and "What is your biggest source of error?"
Keep the board for the story and the notebook for the proof. The display board carries the question, a short methods summary, the main graph, and the conclusion. The notebook stays on the table as evidence that the work is real. National survey data on science fair students show that poster board preparation and the research notebook serve different roles in the project, one for presenting findings and one for developing the research itself [1].
Write the results sentence before the report. One sentence with the numbers in it, like the worked example above, becomes the spine of the abstract, the board's results panel, and your opening line with the judges.
Common Mistakes and Limitations
Changing the question after data collection starts. If the question must change, stop, write the new question, and note the change in the notebook with the date. Do not quietly reinterpret old data against a new question.
Recording data on loose paper. Loose sheets get lost, and they carry no dates. Anything not in the bound notebook effectively did not happen as far as a judge is concerned.
Skipping repeats. A single measurement per condition cannot show whether a difference is real or luck. Three or more trials per condition is the minimum that lets you say anything about consistency.
Confusing correlation with causation. If you measured two things that moved together but did not control the conditions, you can describe the relationship. You cannot claim one caused the other.
Overstating the labels. A measurement labeled "plant growth" that is actually "height of the tallest stem" will mislead you and the judges. Check that every label on your tables and graphs matches what was actually measured [7].
Building the board the night before. Board construction reliably takes longer than expected, and a rushed board is where printing errors and missing labels live. The board belongs to week seven of the timeline, not the last night.
Treating the checklist as complete once data exist. National survey data show that analysis-stage practices, such as preparing tables and graphs with software, and presentation-stage practices, such as the written report and slide deck, are used by students in addition to data collection, not instead of it [1]. A project with great data and no rehearsed presentation loses points that the data earned.
One honest limitation. A checklist cannot design your experiment for you. It enforces the decisions you make, so the quality of the final project tracks the quality of the question and the procedure you write in phases one and two.
Frequently Asked Questions
What is a science fair project checklist template?
It is a pre-built list of deliverables, organized by project phase, that you check off as your science fair project progresses from question to presentation. Each item corresponds to a physical artifact, such as a written hypothesis, a data table, or a rehearsed talk.
When should I start using the checklist?
Start on day one, during topic selection, and work through it in phase order. The first three phases, question, design, and setup, determine whether the later data can answer anything at all.
What should a science fair lab notebook include?
Every page should carry a date, the day's goal, the procedure followed, the raw measurements with units and condition labels, any problems encountered, and the next step. Write in ink, never erase, and number the pages.
How many trials do I need for a science fair project?
Three or more trials per condition is the working minimum for an experimental project. Three lets you judge whether a result is consistent, and more trials give you a steadier average.
What do science fair judges usually ask about?
Judges typically probe your reasoning, asking why you chose your methods, how many trials you ran, what your sources of error were, and what you would change. Students who used a research notebook can answer these from their own records.
How do I turn my data into a graph?
Enter the raw data into a spreadsheet, calculate the average for each condition, and pick the chart type that matches the variables. Categories on one axis call for a bar chart, a changing measurement over time calls for a line graph, and both axes need labels with units.
What goes on the science fair display board?
The board carries the question, a brief methods summary, the main graph or table with a title and units, the conclusion, and your references. Keep text large enough to read from about a meter and let the notebook on the table carry the detailed evidence.
Can I use a checklist template for engineering or invention projects?
Yes. Keep the same six phases and swap the data table for a design log and a test-results table. The question phase becomes a requirements statement, and the analysis phase becomes a comparison of design versions against those requirements.
Sources
- High school science fair: Characterizing student communication and presentation practices and their association with SEF outcomes.
- Context of data sharing practices in collaborative human genomic research in low and middle income countries: A systematic review.
- Advancing PTSD-Substance Use Comorbidity Treatment Research Through Applying FAIR and FACT Data Science Frameworks in Project Harmony.
- Exploring exhibited works on dentistry-related topics at the student science fair projects in Taiwan from 1970 to 2025.
- Navigating the new NIH Data Management Sharing plan: the NIH HEAL Initiative Data2Action DMPTool template.
- The Human Intracerebral EEG Platform: A Cloud-Based Trusted Research Environment for Collaborative SEEG Research in Epilepsy and Neuroscience.
- Representational Veracity in Data Science Health Research: Targets, Proxies, Labels, and Descriptors.
- FAIR Data Standards for AI in Plant Biology: Current Practice and Case Studies.
- Training resources on open and responsible research and innovation (Open RRI): gaps, quality and opportunities to advance training.