Science Fair Presentation Board Template: How to Lay Out Your Display
By Dr. Zubair Khalid, DVM, MS, PhD ·
By the end of this guide you will have a complete, panel-by-panel plan for your science fair display board. You will know exactly which section goes on which panel, how large each element should be, how to size your graphs so nothing looks pixelated, and how to check the finished board before you carry it into the judging hall. You will also get a reusable research template for the text of each panel and a simple lab notebook format that feeds directly into it.
Nothing needs to be installed. You need a tri-fold foam or cardboard display board (the standard size at most US fairs is 48 inches wide by 36 inches tall when open), printed or hand-lettered headings, adhesive (double-sided tape or a glue stick), a ruler, and your project materials: your question, hypothesis, procedure, data, graphs, and conclusion. If you plan to generate your graphs on a computer, a free tool such as Python with the matplotlib library or a spreadsheet program is enough.
Why Board Layout Is a Judged Skill
Presenting findings is not decoration around the science. It is part of the science itself. The National Research Council framework behind the Next Generation Science Standards names Obtaining, Evaluating, and Communicating Information as one of the eight core Science and Engineering Practices, and communicating research results is treated as part of scientific inquiry rather than an afterthought [1].
That framing shows up in real science and engineering fairs. In national surveys of US high school science and engineering fair participants run during the 2021-22 and 2022-23 school years, 1,789 students described the communication and presentation practices they used. The listed practices included literature review, keeping a research notebook, using software to prepare tables, graphs, or images, writing a report, preparing a poster board, giving a PowerPoint presentation, and interviewing with judges [1]. Poster board preparation was one of the standard practices students reported, alongside the notebook and the judge interview.
Two practical conclusions follow. First, the board is one of three communication artifacts judges expect: the board, the verbal interview, and often a written report or notebook. Second, the notebook is not optional paperwork. Survey respondents treated the research notebook as a core part of developing their research questions and collecting data [1]. The board layout below is designed to translate a well-kept notebook into a display a judge can read in a few minutes.
The Three-Panel Anatomy of a Science Fair Board
The standard tri-fold board opens into three vertical panels. Think of the board as a story that reads left to right, with the center panel carrying the payoff.
Left Panel: The Question and Background
The left panel answers why anyone should care and what you predicted. From top to bottom:
- Problem or Question. One sentence, phrased as a question. Example: "Does salt concentration change the freezing point of water?"
- Background Research. Two to four short paragraphs or three to five bullet points summarizing what published work or prior observations say about your topic. This is where your literature review lives. In the national fair survey, literature review was classified as part of developing research questions and collecting data, not as a separate chore [1].
- Hypothesis. One sentence in the form "If [I change the independent variable], then [the dependent variable will do this], because [reason]."
Center Panel: The Title and the Evidence
The center panel is the widest and the one judges see first. From top to bottom:
- Title. Large, centered, readable from across the aisle. Include your project title and nothing else. Names and school usually go on a separate form or the front flap, depending on your fair's rules, so check them before printing.
- Materials and Procedure (condensed). A numbered list of the major steps and key materials. Do not reproduce your entire notebook. Judges want to see that your method was controlled and repeatable.
- Data and Graphs. Your best two to four figures, each with a caption that states what the figure shows.
- Results Statement. One or two sentences summarizing the trend in words, with the actual numbers.
- Conclusion. One short paragraph stating whether the data supported the hypothesis, the single most important result, and one realistic source of error or a next experiment.
Right Panel: Analysis, Application, and Sources
The right panel closes the story. From top to bottom:
- Analysis or Discussion. Why you think you got the results you did. Connect back to the background research on the left panel.
- Real-World Application. One short block on who would use this finding.
- References. Three to five sources, formatted consistently. List them even if you cited them only in the background section.
- Acknowledgments (optional). Thank mentors, teachers, or anyone who provided equipment, following your fair's rules about naming adults.
The Bottom Strip and Table Space
Keep a clean, empty table surface in front of the board for your notebook, an abstract page, and any physical artifacts (your apparatus, samples in sealed containers, or demonstration materials). Many fairs limit table space to the width of the open board, so plan for that footprint.
Board Dimensions and the Arithmetic That Makes the Layout Work
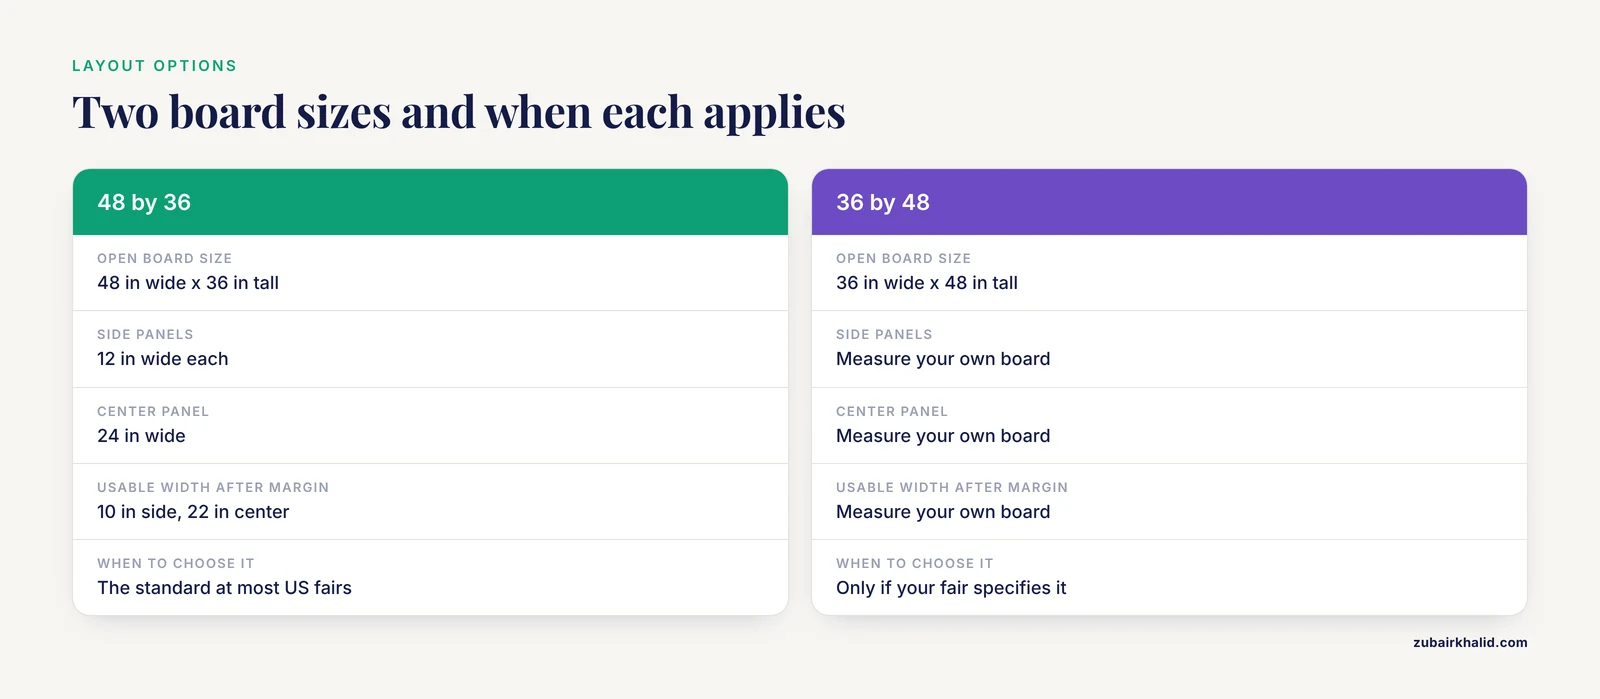
Most tri-fold boards sold in the United States are 48 inches wide by 36 inches tall when open, with two 12-inch side panels and a 24-inch center panel. Some are 36 by 48 flipped (36 wide, 48 tall), so measure your actual board before you plan.
Here is the layout math for a standard 48 by 36 board, using a 1-inch safety margin on every edge so nothing gets clipped when the board folds or sits on a table:
Open board:      48 in wide  x  36 in tall
Side panels:     12 in wide each, center panel 24 in wide
Safety margin:   1 in on all sides

Usable side panel width:   12 - 2 = 10 in
Usable center width:       24 - 2 = 22 in
Usable height (all panels): 36 - 2 = 34 in

Five content blocks per side panel at 34 in tall:
34 in of usable height ÷ 5 blocks ≈ 6.8 in per block,
minus 0.5 in gaps between blocks ≈ 5.5 to 6 in of
usable height per block.
That arithmetic tells you the real constraint of a science fair board: each side panel holds about five blocks of content at readable sizes, and the center holds three to four. If your outline has more blocks than that, cut text, do not shrink fonts.
Font sizes follow a simple rule of thumb used across poster sessions: a viewer should read the title from about 10 feet away, headings from about 5 feet, and body text from about 3 feet. In practice that means title letters 2 to 4 inches tall (roughly 100 to 200 point type if you print on paper), panel headings 36 to 48 point, and body text 24 to 28 point. Anything smaller than 18 point forces judges to lean in, and they often will not.
Science Fair Presentation Board Template, Step by Step
This is the full walkthrough, from an empty board to a finished display. Follow the steps in order and check the expected result after each one.
Step 1: Assemble the Content From Your Notebook
Lay your lab notebook open next to the empty board and pull out six things: your final question, your hypothesis, your condensed procedure (10 steps or fewer), your raw data table, your two to four best graphs, and your one-paragraph conclusion. If you cannot find any of these in your notebook, that gap is the first thing to fix, because judges at science and engineering fairs expect the notebook to document the project from question through data collection [1].
A minimal lab notebook format that feeds the board cleanly has six columns. Many universities and science outreach programs publish a free printable lab notebook template pdf you can print and hole-punch, or you can copy this structure into a bound notebook:
Date        | 2026-01-14
Objective   | Test whether 0, 5, and 10 percent salt solutions
            | freeze at different temperatures
Method      | 100 mL of each solution in identical cups, freezer
            | set to -18 C, checked every 10 minutes
Observation | 0% salt froze at 50 min, 5% at 80 min, 10% not
            | frozen after 120 min
Deviation   | Freezer opened once at 40 min for about 15 seconds
Next step   | Repeat trial 2 for the 10% solution
The Deviation column matters more than students expect. Professional research groups log deviations from the planned protocol the same way, and structured templates with explicit fields are how modern research organizations keep records usable later. The NIH-funded Data2Action project, for example, built a structured planning template precisely so that diverse study records could be standardized, protected, and reused rather than sitting in unreadable free-form notes [2].
Step 2: Draft the Text Using a Reusable Research Template
A research template is a reusable scaffold with fixed headings that you fill in for each new project. Use this skeleton, one heading per block, and hold yourself to the word limits:
LEFT PANEL
  Question:      1 sentence
  Background:    3 bullet points, each under 20 words
  Hypothesis:    1 sentence, "If...then...because..."

CENTER PANEL
  Title:         5 to 12 words
  Materials:     5 to 8 items
  Procedure:     6 to 10 numbered steps, each under 15 words
  Graphs:        2 to 4 figures, each with a 1-sentence caption
  Results:       1 to 2 sentences with the key numbers
  Conclusion:    3 to 5 sentences

RIGHT PANEL
  Analysis:      3 to 5 sentences
  Application:   2 to 3 sentences
  References:    3 to 5 sources, consistent format
If a section will not fit the limit, the fix is almost always to move detail into your notebook and write "full procedure in lab notebook" or "raw data in lab notebook" on the board. That is standard practice and judges respond well to it, because it signals the notebook exists and is organized [1].
Step 3: Make Your Graphs at Print Resolution
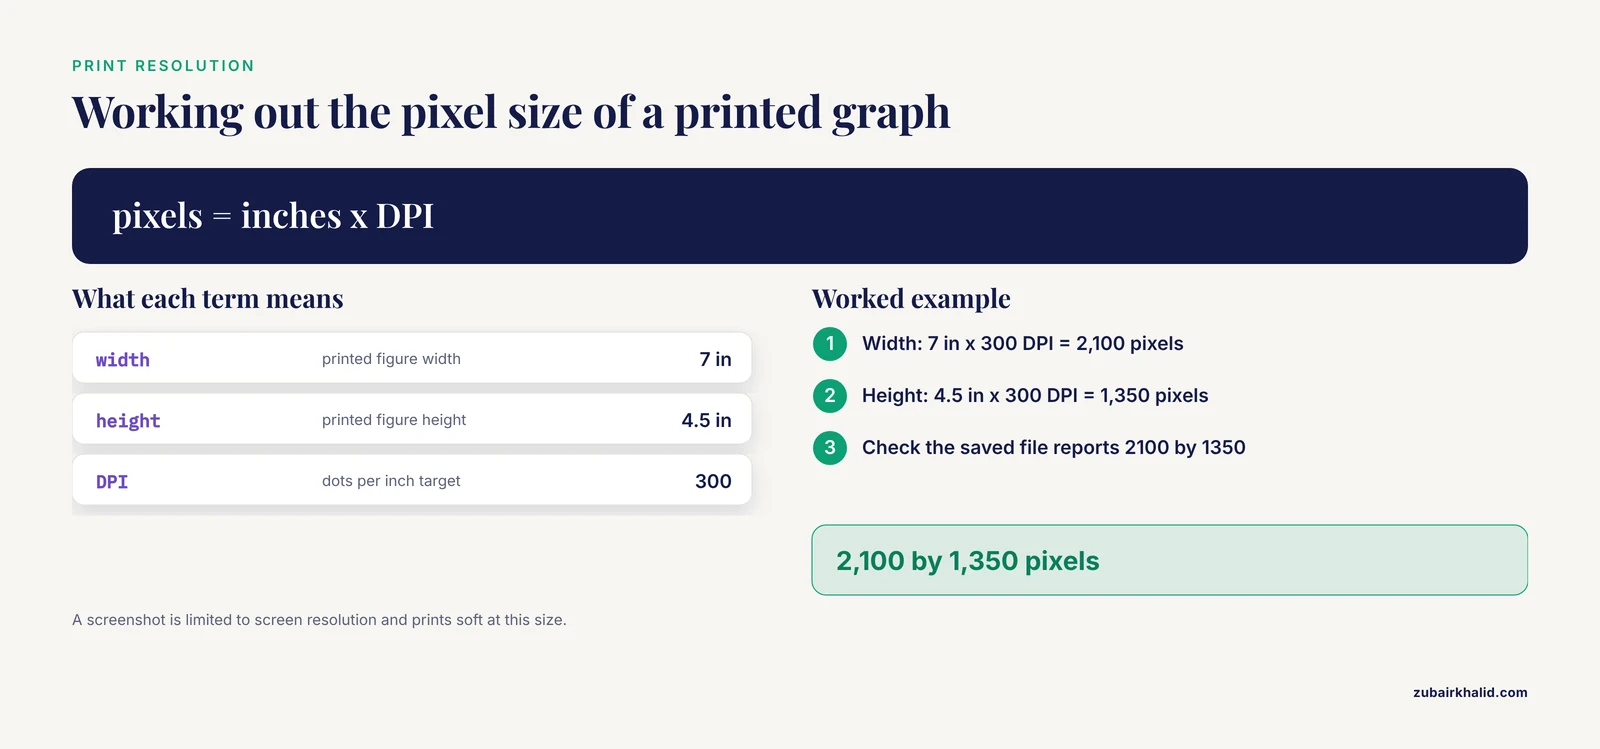
Low-resolution images are the most common visual defect on student boards. The fix is to control resolution deliberately. Digital image sharpness is measured in DPI, dots per inch. For a printed figure that judges will view at arm's length, 300 DPI is the standard target.
A 300 DPI figure that prints 7 inches wide by 4.5 inches tall needs 2,100 by 1,350 pixels. If you generate graphs in Python with matplotlib, set the figure size and DPI explicitly rather than screenshotting:
import matplotlib.pyplot as plt

fig, ax = plt.subplots(figsize=(7, 4.5), dpi=300)

salt = [0, 5, 10]
freeze_min = [50, 80, 120]

ax.plot(salt, freeze_min, marker="o", color="darkblue")
ax.set_xlabel("Salt concentration (percent)")
ax.set_ylabel("Time to freeze (minutes)")
ax.set_title("Freezing Delay vs. Salt Concentration")

fig.savefig("freeze_graph.png", dpi=300, bbox_inches="tight")
print(fig.get_size_inches() * fig.dpi)
Expected output:
[2100. 1350.]Those two numbers are your pixel dimensions. A 2,100 by 1,350 pixel image placed in a 7 by 4.5 inch space prints at exactly 300 DPI. If you use a spreadsheet instead, export or print the chart as an image at high quality rather than taking a screenshot of the screen, because a screenshot is limited to screen resolution and will look soft when enlarged.
Step 4: Label Every Figure Accurately
Every axis needs a label with units, every figure needs a caption, and every label must state truthfully what the data actually represent. This is not just a style rule. In data science research, a named construct called representational veracity asks whether the labels, descriptors, and classifications attached to data still truthfully represent the phenomena they claim to describe at the point of use, and identifies this as a distinct check that ordinary measurement validation does not capture [3]. On a science fair board the same principle applies at small scale. A photo captioned "10 percent salt solution" must actually show the 10 percent solution. A graph axis labeled "minutes" must actually be minutes. If you pooled or transformed data, the caption or methods block should say so in one honest sentence.
Step 5: Lay Out the Board Before You Glue Anything
Dry-fit every element. Place all headings, paragraphs, graphs, and photos on the board without adhesive and step back 6 feet. Check three things:
- The center panel's title is the first thing your eye lands on.
- Text blocks are left-aligned and read top to bottom, left to right.
- No block crosses the fold line between panels, because anything near a fold warps or peels when the board is moved.
Only after the dry-fit looks right do you glue. Use double-sided tape or a glue stick applied edge to edge. Liquid glue warps paper.
Step 6: Attach Items So They Survive Transport
Boards get carried through parking lots, gymnasium doors, and onto tables. Flat lamination or clear report covers protect printed pages. Photos and graphs should be mounted on a slightly larger colored backing sheet (a half-inch border) to lift them visually off the board. Avoid loose papers pinned only at one corner. If your fair is outdoors or in a gym, bring two large binder clips to clamp side panels to the table so a breeze or a bumped table does not fold the board mid-interview.
Step 7: Prepare the Digital Companion
More fairs now expect a digital supplement. Two low-effort, high-value additions:
- A QR code on the right panel linking to a copy of your raw data table, your full procedure, or your analysis code. Sharing analysis code in an open, version-controlled repository is increasingly treated as a marker of credible, reproducible science, aligned with the NIH Gold Standard Science emphasis on transparency and with the FAIR principles, findable, accessible, interoperable, and reusable [4]. Even at the student level, "the full dataset and analysis script are available at this link" is a strong line in an interview.
- Your PowerPoint or slide deck, saved on a USB drive as well as the cloud, if your fair includes a presentation round. PowerPoint presentations were among the standard communication practices reported by fair participants in the national survey [1].
Step 8: Do the Privacy Check
If your project involved photographs of people, human subjects, patient data, or any identifiable information, the board needs a privacy pass before it leaves your house. Clinical research faces exactly this tension, and studies of open data sharing note that privacy and confidentiality concerns, amplified by modern AI methods that can reidentify supposedly deidentified data, are a leading reason researchers hold data back [5]. For a student board the practical version is simple: show faces only with written permission, never post names or school affiliations on the public board unless your fair's rules direct it, and blur or crop anything that could identify a person in a photo. When in doubt, show the apparatus or the data, not the participant.
Step 9: Run the Final Quality Check
Before you leave for the fair, run through this list:
[ ] Board measured, fits the fair's stated size limits
[ ] Title readable from 10 feet
[ ] Body text 24 point or larger, no block smaller
[ ] Every graph has labeled axes with units and a caption
[ ] Numbers in the Results match the notebook exactly
[ ] References listed, 3 to 5 sources
[ ] Notebook, abstract, and any USB drive packed
[ ] Adhesive, scissors, tape, and a spare printed set packed
[ ] Spelling checked by someone who did not write the board
The numbers-matching check deserves emphasis. Whatever figure or statistic you put on the board must trace back to a page in your notebook. This is the small-scale version of the provenance checks that big data research builds into every workflow, where each stage of processing is documented so the final result can be traced to its origin [6]. If a judge asks where a number came from and you can open the notebook to the page, you win that exchange.
Step 10: Rehearse the Two-Minute Walkthrough
Stand next to your finished board and explain the whole project out loud in under two minutes, using the board's left-to-right order as your script: question, background, hypothesis, method, results, conclusion. The judge interview is one of the core communication practices fair participants report using [1], and the board's layout is your outline for it. If any panel cannot be explained in two sentences, that panel has too much on it.
Key Layout Options at a Glance
| Element | Standard option | Alternative | When to choose the alternative |
|---|---|---|---|
| Board size | 48 in wide x 36 in tall tri-fold | 36 in wide x 48 in tall tri-fold | Only if your fair specifies it, some do |
| Figure resolution | 300 DPI printed images | 150 DPI for large banner text | Banner text viewed from several feet |
| Body text | 24 to 28 point printed | Hand lettering with a stencil | When no printer is available, keep letters uniform |
| Adhesive | Double-sided tape | Glue stick, spray adhesive | Tape for photos, glue for full pages |
| Data supplement | QR code to a shared folder | USB drive shown on request | QR when the fair has public viewers, USB for privacy-sensitive data |
| Notebook on table | Bound composition notebook | Printed lab notebook template pdf pages in a binder | Binder if you want the judge to flip to a specific page fast |
Common Mistakes and Limitations
These are the errors judges and science fair coordinators report seeing year after year, in rough order of how much they cost you.
- Walls of text. A paragraph printed in 14 point type is a document, not a display. Cut each block to the limits in the template above. If it does not fit, the detail moves to the notebook, not to a smaller font.
- Screenshot-resolution graphs. A screenshot of a spreadsheet chart stretched across half the center panel looks blurry at 300 DPI printing standards. Regenerate the figure at print resolution as shown in Step 3.
- Unlabeled or mislabeled figures. Missing axis units, captions that do not match the figure, or photos labeled with the wrong trial undermine the entire board's credibility, because judges read label errors as a sign the underlying data handling was loose.
- No visible notebook. Fair participants themselves identify the research notebook as a core part of developing questions and collecting data [1]. A polished board with no notebook on the table invites the hardest question a judge can ask: show me your raw data.
- Reading the board aloud. The board is the visual aid, you are the presentation. Rehearse the two-minute walkthrough so the interview adds value the board does not already contain.
- Decorations over content. Glitter borders, 3D stickers, and backgrounds with patterns compete with your graphs. Choose a solid, light background color and spend your effort on figure quality.
- Crossing the fold line. Any element placed across a panel seam buckles when the board is folded for transport. Keep every block fully inside one panel.
- Overstating the conclusion. "This proves salt always raises the freezing point" overruns three trials of one compound. State what your data showed, at your sample size, with your conditions.
- Privacy lapses. Faces, names, or identifying details from human-subject work on a public board create real ethical problems, and even professional clinical research treats reidentification risk as a live concern that shapes what gets shared publicly [5].
One honest limitation applies to everything above: fairs differ. Your specific fair's rulebook on board size, abstract requirements, and what may be displayed overrides any general template, and individual edge cases, especially around human or animal subjects, need a ruling from your fair's review committee or your teacher before the day of the event.
Science Fair Presentation Board Template Tips
- Write the conclusion first. If you cannot state your conclusion in three sentences, the board is not ready to lay out. The conclusion is the anchor that everything else supports.
- Photograph the dry-fit. Take a phone photo at Step 5 before gluing. If anything falls off in transit, you have the reference for rebuilding it exactly.
- Print two copies of every page. One for the board, one in a folder. Ink smears, pages tear, and the fair will not pause for you.
- Use your notebook as the appendix, not the board. The professional parallel is deliberate: major research programs pair a concise summary with openly available underlying data and code so reviewers can verify claims, which improves credibility for the researcher as well [4]. On a student board, the concise summary is the board and the open record is your notebook.
- Organize your digital files the way you organize the board. Researchers building large datasets follow FAIR principles, making each dataset findable, accessible, interoperable, and reusable, with standardized metadata and documented processing steps [2], [6]. A student folder named "science fair" with files named "final_graph_v3_REAL.png" fails that test. Name files to match board sections: "graph1_freeze_curve.png", "table1_raw_times.csv".
- Rehearse with someone who knows nothing about your project. Their confusion points at exactly the panel that needs simplifying.
Frequently Asked Questions
What size board do most science fairs require?
Most US fairs accept the standard 48 by 36 inch tri-fold board, but every fair publishes its own limits and some cap the table footprint as well. Check your fair's rulebook before buying the board, because a board that exceeds the limit can be turned away at check-in.
What goes on each panel of a science fair presentation board?
Left panel: question, background research, and hypothesis. Center panel: title, condensed materials and procedure, graphs with captions, a results statement, and the conclusion. Right panel: analysis, real-world application, and references. This left-to-right order mirrors how judges read the board and matches the story arc of a research project.
How big should the title and text be?
Title letters should be readable from about 10 feet, which usually means 2 to 4 inch tall letters. Panel headings work at 36 to 48 point and body text at 24 to 28 point. Nothing on the board should be smaller than 18 point.
Should I put my full lab notebook on the board?
No. The board carries condensed summaries, and the notebook sits on the table as the underlying record. Fair participants themselves report the research notebook as a core tool for developing questions and collecting data, so bring it, keep it open to a useful page, and be ready to show raw entries on request.
Can I show photos of people or sensitive data on my board?
Only with written permission for faces, and never with names or identifying details visible. Privacy and reidentification risks are taken seriously even in professional clinical data sharing, so crop, blur, or replace human photos with apparatus shots when permission is uncertain.
Do I need a QR code or digital supplement?
It is not usually required, but it is one of the highest-value additions you can make. A QR code linking to your raw data, full procedure, or analysis code signals transparency and lets interested judges verify your work, which mirrors how modern research pairs a concise paper with openly shared data and code.
How do I make my graphs look sharp in print?
Generate them at 300 DPI rather than screenshotting the screen. In matplotlib, set the figure size and DPI before saving, so a 7 by 4.5 inch figure exports at 2,100 by 1,350 pixels. In a spreadsheet, export the chart as a high-quality image instead of capturing the screen.
What should I bring in my bag on fair day?
The board, your lab notebook, your abstract, a USB drive with your slides and data, scissors, double-sided tape, binder clips to steady the side panels, and one spare printed copy of every page. A small repair kit has saved more projects than any single layout decision.
Sources
- High school science fair: Characterizing student communication and presentation practices and their association with SEF outcomes.
- Navigating the new NIH Data Management Sharing plan: the NIH HEAL Initiative Data2Action DMPTool template.
- Representational Veracity in Data Science Health Research: Targets, Proxies, Labels, and Descriptors.
- Research Code Sharing in Support of Gold Standard Science.
- Navigating open data sharing and privacy in the age of clinical AI research: from reidentification to pseudo-reidentification.
- Big data approaches to bovine bioacoustics: a FAIR-compliant dataset and scalable ML framework for precision livestock welfare.