How to Track Research Project Progress With a Spreadsheet
By Dr. Zubair Khalid, DVM, MS, PhD ·

By the end of this guide you will be able to build a working research project tracking spreadsheet in Excel, Google Sheets, or LibreOffice Calc. It will list every task in your project, show percent complete at a glance, flag overdue items automatically, and give you a one-screen summary you can paste into a lab meeting slide or a funding report. You need only three things: a spreadsheet application, about an hour of setup time, and a rough list of your project milestones.
Spreadsheets remain the default tracking tool in most laboratories, and for good reason. They are free, they require no administrator approval, and every trainee already knows the basics. A medical physics lab at Duke University reported that before adopting a dedicated platform, its projects were tracked with email threads and spreadsheets, which worked but produced fragmented communication and delays [1]. That experience captures the tradeoff perfectly. A spreadsheet is a genuinely capable tracking tool for small teams and single projects, and this guide shows you how to get the most out of one before you outgrow it.
Why Spreadsheets Still Anchor Research Project Management
Research project management has a simple core: define what done looks like, break the work into trackable units, measure progress against those units on a fixed schedule, and act on what the measurements show. Large collaborations formalize this with indicator frameworks. The Lancet Countdown, an international collaboration tracking health and climate change, organizes its work into defined thematic groups and reports annually on a fixed series of indicators across them [2]. The United States National Tuberculosis Indicators Project uses routinely collected data to measure program performance against national objectives and to prioritize improvement efforts [3]. A hospital quality improvement team studying operating room efficiency selected three key performance indicators, tracked weekly performance on a spreadsheet, and used the results to drive a Plan-Do-Study-Act improvement cycle that raised first case on-time starts from 50% to 91% [4].
The pattern in all three cases is the same, and it transfers directly to a bench or field project at any scale. Your spreadsheet is simply the smallest useful version of an indicator system. You define indicators (tasks completed, samples processed, manuscripts submitted), collect data on a schedule, and review the numbers at fixed intervals.
Spreadsheets also serve as the connective tissue between specialized systems. The Australasian Virtual Herbarium delivers quarterly usage data to collection custodians as a spreadsheet containing download events, record counts, and user categories [5]. The Laboratory Animal Management Assistant, a web system for tracking mouse colonies, was designed to ease the transition from paper- or Excel-based management and exports data in a popular spreadsheet format [6]. A primary care pilot project entered its tobacco intervention flow sheet data into a spreadsheet that doubled as a patient registry [7]. Even rapid qualitative analysis workflows rely on an Excel matrix, with analysts coding interview notes directly into a framework-by-facility spreadsheet and tracking analysis time in one [8]. Knowing how to structure a spreadsheet well is therefore a durable skill, whether the spreadsheet is your whole system or the export format of someone else's.
Building a Research Project Tracking Spreadsheet Step by Step
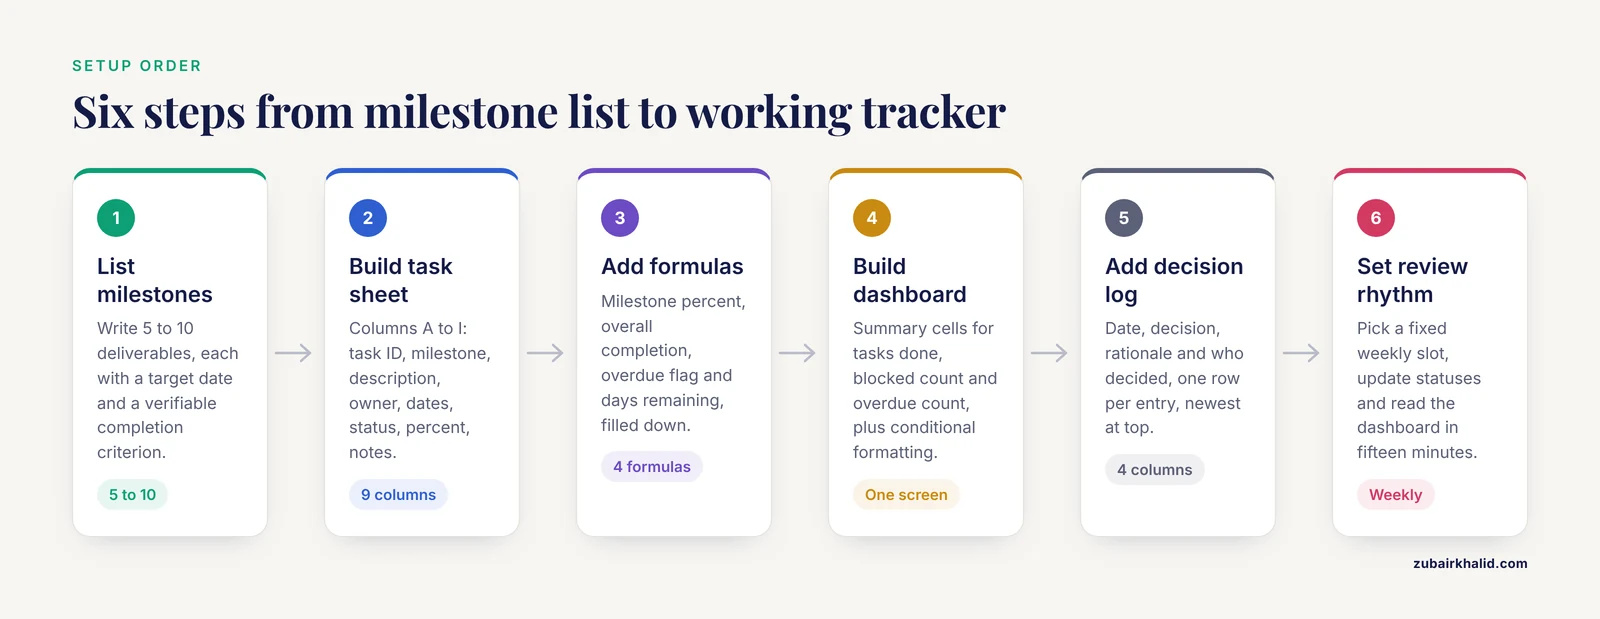
The walkthrough below uses standard functions that work identically in Excel and Google Sheets. LibreOffice Calc supports all of them with the same syntax. Where the applications differ, the difference is noted.
Step 1. Define Your Milestones Before You Open the Spreadsheet
List the 5 to 10 major deliverables of your project. For a typical wet-lab thesis project this might look like:
M1  Literature review and project plan approved
M2  Ethics/protocol approval obtained
M3  Reagents and equipment procured
M4  Assay validation complete (n=3 pilot runs)
M5  Main data collection complete
M6  [Statistical analysis](/blog/guides/statistical-analysis) complete
M7  Manuscript first draft
M8  Manuscript submitted
Each milestone gets a target date and, critically, a completion criterion you can verify. "Assay validation complete" is verifiable. "Work on assay" is not. This mirrors how large indicator projects operate. The tuberculosis indicators project measures specific, defined activities such as whether recommended initial therapy was delivered and whether culture conversion was documented, rather than vague effort [3].
Step 2. Create the Master Task Sheet
Open a new workbook and rename the first sheet Tasks. Create these columns in row 1:
| Column | Header | Content |
|---|---|---|
| A | Task ID | Short code, e.g., M4-02 for milestone 4, task 2 |
| B | Milestone | Which milestone this task belongs to |
| C | Task description | One line, verb first |
| D | Owner | Person responsible |
| E | Start date | Date format YYYY-MM-DD |
| F | Due date | Date format YYYY-MM-DD |
| G | Status | Dropdown: Not started, In progress, Blocked, Done |
| H | % complete | Number 0 to 100 |
| I | Notes | Blocking issues, links, decisions |
Now build the Status dropdown so the column stays clean. In Excel, select column G, then choose Data, Data Validation, Allow: List, and enter:
Not started,In progress,Blocked,DoneIn Google Sheets, select column G, choose Data, Data validation, Add rule, Dropdown, and paste the same four values. Expected result: clicking any cell in column G shows a small arrow with the four choices. Free-typed entries such as "done!" or "in prog" are now impossible, which matters because every formula downstream depends on consistent text.
Step 3. Add the Progress Formulas
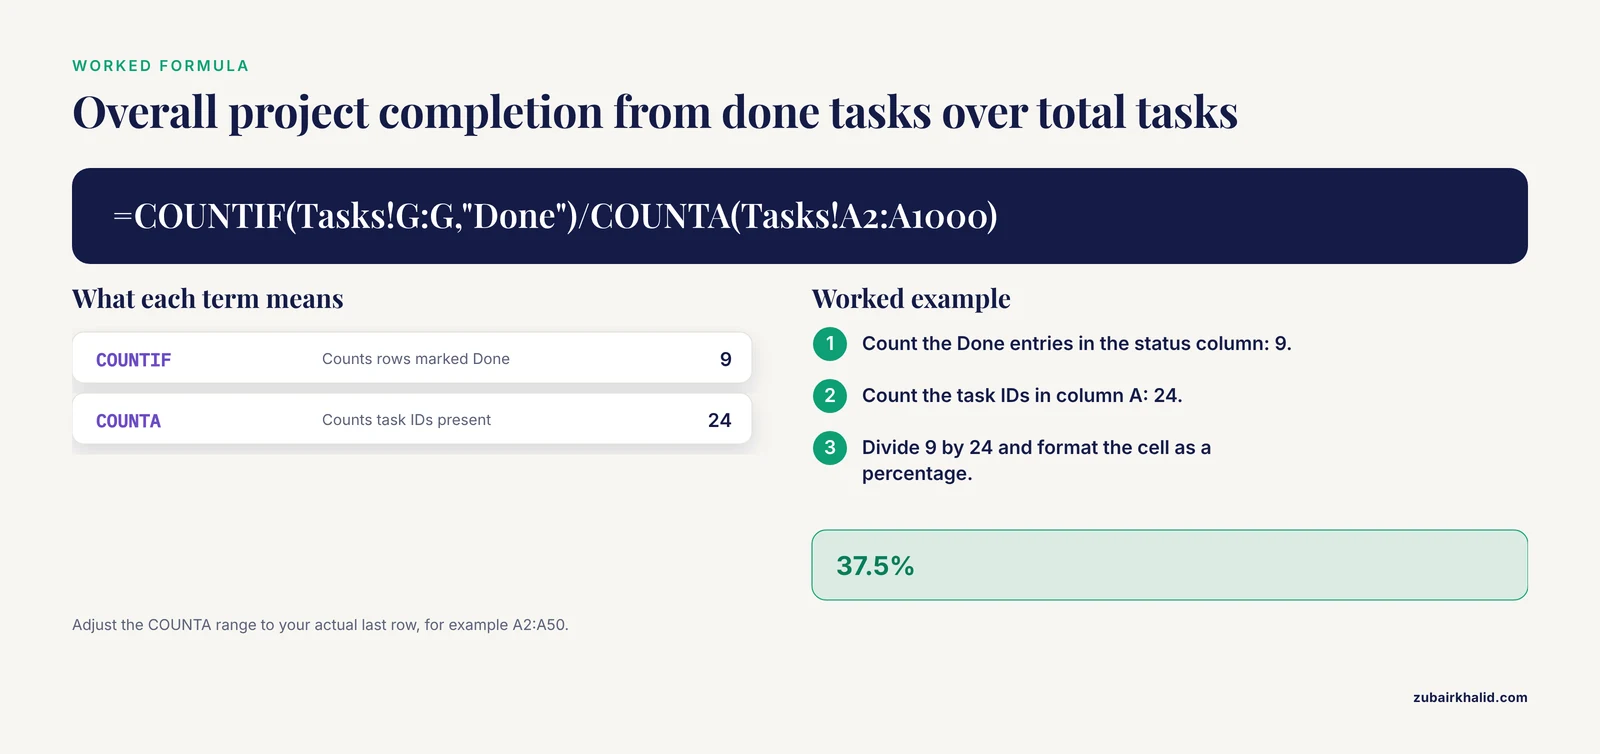
These four formulas turn a flat list into a tracking system. Enter them once and fill down.
Percent complete for a milestone. On a new sheet named Dashboard, put milestone names in column A and enter:
=COUNTIFS(Tasks!B:B,A2,Tasks!G:G,"Done")/COUNTIF(Tasks!B:B,A2)Format the cell as a percentage. Expected output for a milestone with 5 tasks where 3 are Done: 60%.
Overall project completion. On the Dashboard:
=COUNTIF(Tasks!G:G,"Done")/COUNTA(Tasks!A2:A1000)Expected output with 24 tasks and 9 Done: 37.5%.
Overdue and not done. This is the formula that saves projects. It compares each task's due date against today's date:
=IF(AND(F2<TODAY(),G2<>"Done"),"OVERDUE","")Fill this down in column J of the Tasks sheet. Any row with a past due date and a status other than Done displays OVERDUE. Because TODAY() recalculates every time the file opens, the flags update themselves with no manual maintenance.
Days remaining. In column K:
=IF(G2="Done","",F2-TODAY())A task due 5 days from today shows 5. A negative number on an unfinished task confirms the overdue flag.
Weighted completion is a useful refinement when tasks differ in effort. Add an effort column (column L, in hours), then compute project progress as:
=SUMIF(Tasks!G:G,"Done",Tasks!L:L)/SUM(Tasks!L:L)This weights a 40-hour experiment the same as a 40-hour one and ignores a 1-hour form, giving a far truer picture than a raw task count.
Step 4. Build the One-Screen Dashboard
Below the milestone table on the Dashboard sheet, add three summary cells:
=COUNTIF(Tasks!G:G,"Done")&" of "&COUNTA(Tasks!A2:A1000)-1&" tasks done"Hmm, that formula has a concatenation bug. The clean version is:
=COUNTIF(Tasks!G:G,"Done")&" done of "&COUNTA(Tasks!A2:A1000)&" total"Adjust the range to match your actual row count, for example COUNTA(Tasks!A2:A50). Expected output: 9 done of 24 total.
Then add a blocked-task counter, because blocked tasks are the leading indicator of trouble:
=COUNTIF(Tasks!G:G,"Blocked")And a count of overdue items:
=COUNTIF(Tasks!J:J,"OVERDUE")Apply conditional formatting so the dashboard reads at a glance. Select the overdue cell, choose Format, Conditional Formatting, and set cells containing values above 0 to red fill. Select the milestone percent-complete column and apply a color scale from red through yellow to green. In both Excel and Google Sheets this takes under two minutes and converts numbers into a visual status report suitable for pasting into a slide.
Step 5. Add a Decision Log Sheet
Create a third sheet named Log with four columns: Date, Decision, Rationale, Decided by. One row per entry, newest at top. This is the sheet people skip and later regret skipping. When a reviewer asks why you changed the primary endpoint, or a co-author asks why the sampling plan changed mid-project, the answer lives here. Long-running registry studies formalize this instinct as documented data quality indicators with defined remedial measures when quality slips [9]. Your log sheet is the personal-scale version of the same discipline.
Step 6. Set a Review Rhythm
A tracker nobody opens is decoration. Pick a fixed review interval and put it in your calendar. Weekly is right for most active projects. The operating room quality improvement team reviewed its spreadsheet weekly, sent messaging updates, and used control charts in feedback sessions to keep momentum [4]. Your equivalent is simpler: open the file, update statuses, glance at the dashboard, and note anything blocked. Fifteen minutes weekly beats a two-hour monthly reconciliation, because small drifts are cheap to correct and large drifts are not.
Key Formulas Reference
| Purpose | Formula | Notes |
|---|---|---|
| Milestone % complete | =COUNTIFS(Tasks!B:B,A2,Tasks!G:G,"Done")/COUNTIF(Tasks!B:B,A2) | Format as percentage |
| Overall completion | =COUNTIF(Tasks!G:G,"Done")/COUNTA(Tasks!A2:A50) | Adjust range to your rows |
| Overdue flag | =IF(AND(F2<TODAY(),G2<>"Done"),"OVERDUE","") | Self-updating via TODAY() |
| Days remaining | =IF(G2="Done","",F2-TODAY()) | Blank for finished tasks |
| Effort-weighted progress | =SUMIF(Tasks!G:G,"Done",Tasks!L:L)/SUM(Tasks!L:L) | Requires an hours column |
| Blocked count | =COUNTIF(Tasks!G:G,"Blocked") | Early warning signal |
| Tasks due this week | =COUNTIFS(Tasks!F:F,">="&TODAY(),Tasks!F:F,"<="&TODAY()+7,Tasks!G:G,"<>Done") | For weekly planning |
| Distinct owners active | =COUNTA(UNIQUE(FILTER(Tasks!D:D,Tasks!G:G<>"Done"))) | Google Sheets, or Excel 365 |
Research Project Tracking Spreadsheet Tips
One file, multiple sheets, one source of truth. Keep tasks, dashboard, and log in a single workbook stored in shared cloud storage. Multiple copies of the same tracker emailed between collaborators is the failure mode that dedicated platforms exist to fix, and the Duke medical physics case study identified exactly this fragmentation before centralizing its project information [1]. A shared cloud spreadsheet gets you most of the centralization benefit at zero cost.
Separate tracking from data. The tracker records whether the Western blot happened. The band intensities live in your analysis files. Never let raw experimental results accumulate in the tracker, because trackers get filtered, sorted, and reordered, and mixed-purpose sheets corrupt both purposes.
Use dates, not week numbers. Enter actual calendar dates in dedicated date-formatted columns. Text dates like "early March" cannot drive a formula, cannot be sorted correctly, and cannot trigger an overdue flag.
Add a reagent and sample inventory sheet while you are at it. Stockouts and over-ordering are persistent laboratory problems, and handwritten or static inventories are prone to human error [10]. A fourth sheet in the same workbook with columns for item, catalog details, quantity, location, and reorder date prevents the classic failure of discovering mid-experiment that a critical antibody ran out. If your volume grows, the same principle scales up. The LIME system, for example, links a smartphone barcode-scanning app to a cloud spreadsheet so inventory updates happen in real time [10], and dedicated laboratory information management systems exist for high-throughput sample tracking [11].
Write tasks as verifiable outputs. "Analyze flow cytometry data for cohort 1" can be marked Done. "Do analysis" cannot. If you cannot write a checklist question that has a yes or no answer, split the task until you can.
Protect formula cells. In Excel, select the formula ranges, open Format Cells, check Locked, then protect the sheet with Review, Protect Sheet, leaving data-entry cells unlocked. In Google Sheets, use Data, Protect sheets and ranges. This stops the single most common spreadsheet accident, which is a collaborator typing a number over a formula.
Check your spreadsheet the way you would check an assay. Data quality frameworks in registry research evaluate consistency, accuracy, and completeness against defined indicators [9]. Your tracker deserves the same audit. Once a month, pick three rows at random and verify the status against reality. A tracker that says 80% complete while the bench says 50% is worse than no tracker, because it produces false confidence.
Common Mistakes and Limitations
Treating status as free text. Without dropdown validation, you will accumulate "Done", "done", "COMPLETE", and "wrapped up", and your COUNTIF formulas will silently undercount. If your dashboard shows 0% complete on a milestone you know is finished, check the exact text in the status cells against the formula's match string first. Case differences alone can break the match.
Hardcoding dates inside formulas. =IF(F2<DATE(2026,3,1),...) goes stale the moment the timeline shifts. Always compare against TODAY() or against a deadline cell you can edit in one place.
Letting the file fork. The moment someone emails a copy, you have two trackers and zero truth. If offline editing is unavoidable, adopt filename versioning (tracker_2026-03-14.xlsx) and merge on a fixed schedule. Cloud storage with a single shared link eliminates the problem entirely and costs nothing.
Building before doing. Elaborate multi-sheet systems with Gantt charts, dependency arrows, and resource-loading formulas are a famous form of productive procrastination. The operating room team that improved first-case on-time starts from 50% to 91% did it with weekly spreadsheet entries and disciplined review, not elaborate software [4]. Start with Steps 1 through 4, use the system for a month, and only then add complexity that a real need reveals.
Keeping the spreadsheet past its useful life. Spreadsheets have a real ceiling. As project throughput and team size grow, the spreadsheets traditionally used for sample tracking become unsuitable and need replacement with proper laboratory information management systems [11]. The warning signs are formula errors appearing after multiple people edit simultaneously, lookup formulas breaking when rows are inserted, and review meetings spent debating the tracker instead of the science. LAMA, the laboratory animal management system, was built specifically because paper- and Excel-based colony tracking stopped scaling, though its developers deliberately preserved spreadsheet export so the data never got trapped [6].
Confusing the tracker with the plan. A tracker records what is happening. It does not decide what should happen. Your milestone list, prioritization, and scope decisions are research project management decisions that no formula makes for you.
When to Move Beyond a Spreadsheet
Graduate to dedicated tools when you hit any of these thresholds. Multiple people editing simultaneously and overwriting each other's formulas. A sample or reagent count in the hundreds, where typed entries accumulate errors that barcode scanning eliminates [10]. A need for automated reminders, approval workflows, or audit trails. A collaboration spanning institutions where email-thread coordination is producing delays [1]. The open-source ecosystem offers domain-specific options, from web-based sample tracking systems designed to replace overextended spreadsheets [11] to specialized animal colony databases [6], and general project management platforms have documented benefits for coordination, delegation, and trainee development in academic labs [1].
Until then, a well-built spreadsheet is not a compromise. It is a functioning indicator system, the same architecture that national programs [3], global collaborations [2], and hospital quality teams [4] use, scaled to the size of your project.
Frequently Asked Questions
What is a research project tracking spreadsheet?
A spreadsheet that lists your project's tasks and milestones with owners, due dates, and statuses, plus formulas that compute progress and flag overdue work automatically. It serves as a lightweight project management system built from standard spreadsheet software.
How do I track research project progress without software?
Use a spreadsheet together with a fixed weekly review habit. The tracking logic lives in formulas like COUNTIF for completion counts and TODAY()-based comparisons for overdue flags, so no special software is needed beyond Excel, Google Sheets, or LibreOffice Calc.
What columns should a research project tracking spreadsheet have?
At minimum: task ID, milestone, task description, owner, start date, due date, status, percent complete, and notes. An effort-in-hours column enables weighted progress calculations, and a computed column for overdue flags makes the tracker self-updating.
Which formulas matter most in a tracking spreadsheet?
The core four are COUNTIFS for milestone completion percentage, COUNTIF divided by COUNTA for overall progress, an IF-AND formula comparing due dates against TODAY() for overdue flags, and SUMIF divided by SUM for effort-weighted progress. All work identically in Excel and Google Sheets.
How often should I update my research tracker?
Weekly, at a fixed time, is the practical standard for active projects. Quality improvement teams that tracked performance weekly on a spreadsheet and reviewed it in regular feedback sessions achieved measurable efficiency gains, and the same rhythm works at individual-project scale.
What are the most common spreadsheet tracking mistakes?
Free-text status entries that break COUNTIF matching, hardcoded dates that go stale, multiple emailed copies that fork the file, over-engineered layouts that delay actual work, and continuing to use a spreadsheet after team size or sample volume has outgrown it.
Can I track samples and inventory in the same spreadsheet?
Yes, as a separate sheet within the same workbook, with columns for item, location, quantity, and reorder status. Static handwritten inventories are prone to error, so keep the sheet structured and consider barcode-based approaches if your inventory grows large.
When should my lab switch from spreadsheets to project management software?
Switch when simultaneous edits cause formula errors, when sample counts reach the hundreds, when you need automated reminders or audit trails, or when coordination across institutions is slipping through email. Dedicated platforms have documented benefits for project coordination and team accountability in academic research settings.
Sources
- Relevance and application of digital project management in academic research: A case study in a Medical Physics lab and practice.
- The Lancet Countdown: tracking progress on health and climate change.
- Monitoring tuberculosis programs - National Tuberculosis Indicator Project, United States, 2002-2008.
- A Plan-Do-Study-Act Cycle to Enhance Operational Efficiency in a Newly Established Paediatric Cardiac Operating Room.
- The Australasian Virtual Herbarium: Tracking data usage and benefits for biological collections.
- Laboratory Animal Management Assistant (LAMA): a LIMS for active research colonies.
- Front-office staff can improve clinical tobacco intervention: health coordinator pilot project.
- Rapid versus traditional qualitative analysis using the Consolidated Framework for Implementation Research (CFIR).
- Harmonized Data Quality Indicators Maintain Data Quality in Long-Term Safety Studies Using Multiple Sclerosis Registries/Data Sources: Experience from the CLARION Study.
- Laboratory Inventory Management Engine (LIME): A free tool for managing laboratory inventories via barcode scanning and automatic cloud-based spreadsheet integration.
- Efficient sample tracking with OpenLabFramework.