How to Run an Effective Project Status Meeting for Your Research Team
By Dr. Zubair Khalid, DVM, MS, PhD ·

By the end of this guide you will be able to plan, chair, and close a research project status meeting that fits in 30 to 45 minutes, tracks a short list of agreed metrics, catches problems while they are still cheap to fix, and ends with a named owner and a date for every action. You will also know how to set warning thresholds for your metrics, so the team spends its time on decisions instead of arguing about whether something is off track.
Have these ready before you start: the current project plan, a one-page list of key performance indicators, a shared tracker such as a spreadsheet or project board, the minutes from the previous meeting, and a repeating calendar slot. For the control-limit calculation in Step 4, a spreadsheet or Python 3 with its standard statistics module is enough.
What a Research Project Status Meeting Is For
A research project status meeting is a short, recurring meeting in which the team compares actual progress against the project plan and decides what to change. It is a control tool, not a science seminar. A lab meeting goes deep on data and interpretation. A journal club covers literature. The status meeting answers three questions: where are we against the plan, what is blocking us, and who does what before the next meeting.
This is the operating core of research project management. A plan without a status meeting goes stale quietly, and a status meeting without a plan turns into a conversation about activity rather than progress. The meeting is the loop that keeps the two connected.
Most status meetings are organized around key performance indicators, usually shortened to KPIs. A KPI is a quantifiable measure of how well the project is doing against its objectives. A review of KPI practice in the construction project management domain identified cost, time and schedule, quality, client satisfaction, and effective communication as the most important indicator families. Research teams use the same families with one translation: client satisfaction becomes funder, collaborator, or ethics-review satisfaction, and quality becomes things like replication success, sequence-verified constructs, or a passed validation assay.
The case for anchoring the meeting in a small, deliberate set of indicators comes from project-based organizations. A study of an R&D and innovation project-based organization applied lean principles, an approach focused on removing waste from processes, to identify and categorize KPIs from the organization's own quality manuals, benchmarking data, and stakeholder surveys, precisely because many such organizations do not know how to formulate indicators in the first place [1]. Build your list the same way: from your plan and from what your stakeholders define as success, not from whatever is easiest to count.
Before the Meeting: Plan, Metrics, and Thresholds
Start from a research project plan template
A research project plan template gives the meeting something to check against. At minimum it should contain:
- The objective and the success criteria
- Work broken into milestones, each with deliverables, an owner, and a date
- A KPI list with targets
- A risk register
- A decision log
The status meeting reads from this document and never rewrites scope inside the meeting. If the plan does not exist yet, build a simple version before the first status meeting, because a meeting with nothing to compare against will drift.
Choose a short list of KPIs
The most common planning failure is tracking everything. Experience from a large smart city project shows the pattern: the team compiled a pool of 258 candidate indicators, organized them into eight evaluation dimensions, and then deliberately filtered the pool down to a project-specific shortlist [2]. Apply the same filter. Three to six KPIs are enough for a weekly meeting.
Make each one SMART: Specific, Measurable, Attainable, Realistic, and Time-bound, the criteria used to develop measurable KPIs for construction projects [3]. "Improve cloning throughput" fails the test. "Sequence-verify at least three constructs per week through week 12" passes.
Spread the metrics across a few dimensions so no single number dominates. The Balanced Scorecard, a management method that groups indicators into a small number of balanced perspectives, was applied to fifteen performance indicators in educational institutions across three dimensions, institutional capacity, educational efficiency, and quality management, so decision makers saw value for all stakeholders rather than one column of numbers [4]. A research team can balance scientific output, schedule, and quality or conduct in the same spirit.
Research teams can also carry indicators that are not purely scientific. In a nanomedicine project, an exploratory assessment found that key performance indicators for responsible research and innovation, covering dimensions such as ethics and stakeholder engagement, were not entirely different from the organizational R&D indicators and could even be aligned with them [5]. In practice, items like documentation completeness, training records, and safety checks belong on the same dashboard as throughput.
Set thresholds before the first meeting
A threshold converts a debate into a check. Write down, for every KPI, four values: the target, the warning limit, the action limit, and the pre-agreed response when a limit is crossed. The response should be a sentence, such as "investigate before the next meeting" or "notify the PI the same day."
A published example shows how a fixed floor works. In an implementation study of a patient-centered care model across seven Chilean primary care centers, each monitored item was assigned an expected minimum score of 67 percent of overall progress, and progress was checked twice, in 2019 and 2020. Six of the seven centers reached the minimum threshold, and the shortfall pattern was informative, with operational conditions advancing furthest and clinical services lagging [6]. The threshold made the review binary and comparable across sites, which is exactly what a status meeting needs from its own thresholds.
A Research Project Status Meeting, Step by Step
The walkthrough assumes a weekly 30-minute meeting for a team of four to eight people. Scale the times proportionally for larger groups.
Step 1. Fix the cadence, the length, and the roles
Weekly is the default for an active project. Assign two standing roles, a chair who moves the agenda along and a notetaker who records decisions and actions. Rotate the notetaker monthly so the meeting does not depend on one person's memory.
Step 2. Send a pre-read 24 hours ahead
The chair updates the tracker and sends the agenda with the current numbers already filled in. The meeting reviews numbers, it does not collect them. This single habit is what makes a 30-minute meeting possible.
PROJECT STATUS MEETING - <project name>
Date: <YYYY-MM-DD>   Length: 30 min   Chair: <name>   Notetaker: <name>

1. Headline status (3 min)
   Overall: GREEN / AMBER / RED
   One-sentence reason: ______
2. KPI dashboard (8 min)
   For each metric: target, actual, trend, inside or outside warning limits
3. Milestones and deliverables (8 min)
   Done since last meeting, due before next meeting, at risk
4. Blockers and decisions (7 min)
   Blocker, owner, needed-by date
5. Actions recap (2 min)
   Every action read aloud with owner and due date
6. Confirm next meeting date and pre-read deadline
Step 3. Open with the headline status
The chair states the overall RAG status, Red, Amber, or Green, in one sentence. Green means on plan. Amber means a risk is being managed. Red means a milestone or metric is off plan and needs a decision. Giving the conclusion first stops the meeting from opening with a monologue and hands late arrivals the one thing they need.
Step 4. Review the KPI dashboard with the math already done
The chair presents each metric as target, actual, and trend, then flags anything outside its limits. Two small calculations do most of the work.
First, progress against the plan:
Milestone: sequence-verify 24 constructs by week 12
Verified so far: 15 constructs
Elapsed: week 8 of 12

Percent complete   = 15 / 24        = 62.5%
Expected progress  = 8 / 12         = 66.7%
Schedule gap       = 62.5% - 66.7%  = -4.2 percentage points
Required rate      = (24 - 15) / 4  = 2.3 constructs per week
Actual rate so far = 15 / 8         = 1.9 constructs per week
Read aloud, the output is one sentence: "We are about 4 percentage points behind, and closing the gap needs 2.3 constructs per week against a historical 1.9, so we either add capacity for four weeks or move the milestone."
Second, check whether a rate-type metric is still inside its normal variation. The standard tool is the Shewhart control chart, a statistical process control plot that compares each new measurement against limits computed from the process's own baseline variation. In an IVF laboratory study, embryology KPIs were tracked monthly on such charts with warning limits at 2 sigma and control limits at 3 sigma, where sigma is the standard deviation of the metric during stable operation. The Day 5 usable blastocyst rate flagged adverse shifts in laboratory performance before the clinical pregnancy rate changed, which is the early-warning behavior a status meeting wants from its metrics [7]. A short script computes the limits:
import statistics

# Weekly success rate for the last 8 sequencing runs, in percent
rates = [92, 88, 91, 90, 87, 93, 89, 90]

mean = statistics.mean(rates)
sd = statistics.stdev(rates)

print(f"mean = {mean:.1f}%")
print(f"2-sigma warning limits: {mean - 2*sd:.1f}% to {mean + 2*sd:.1f}%")
print(f"3-sigma control limits: {mean - 3*sd:.1f}% to {mean + 3*sd:.1f}%")
Expected output:
mean = 90.0%
2-sigma warning limits: 86.0% to 94.0%
3-sigma control limits: 84.0% to 96.0%
The multiplier sets the sensitivity. The 2-sigma band catches drift early but produces more false alarms, so crossing it triggers a look, not a panic. The 3-sigma band is the action line. If this week's rate is 85.5 percent, it sits below the warning limit but above the control limit, so the pre-agreed response applies: note it, check the obvious causes, and recheck next week. A point outside the 3-sigma limits, or a run of points on one side of the mean, triggers investigation the same day.
Common errors at this step, with fixes:
- Error: the metric has no baseline, so no limits exist. Fix: run the process for four to eight cycles and compute the baseline before setting limits.
- Error: the spoken numbers and the tracker disagree. Fix: the tracker is the single source of truth, and the meeting pauses until it is corrected.
- Error: a metric is reported as a raw count with no denominator. Fix: report rates, such as verified constructs per attempt, never counts alone.
Step 5. Walk the milestones and deliverables
For each milestone due before the next meeting, confirm three things: it is still the right milestone, the owner still owns it, and the date still holds. Give schedule pressure explicit airtime. In a survey of 124 construction practitioners, project time ranked first among KPI-related factors with a mean score of 4.387 on a five-point scale and a relative importance index of 0.877, a normalized priority score running from 0 to 1, ahead of the other sides of the classic iron triangle of time, budget, and quality [8]. Research teams feel the same hierarchy through grant renewal dates, revision deadlines, and facility booking windows. Name the hard dates out loud every week.
Step 6. Surface blockers and assign owners
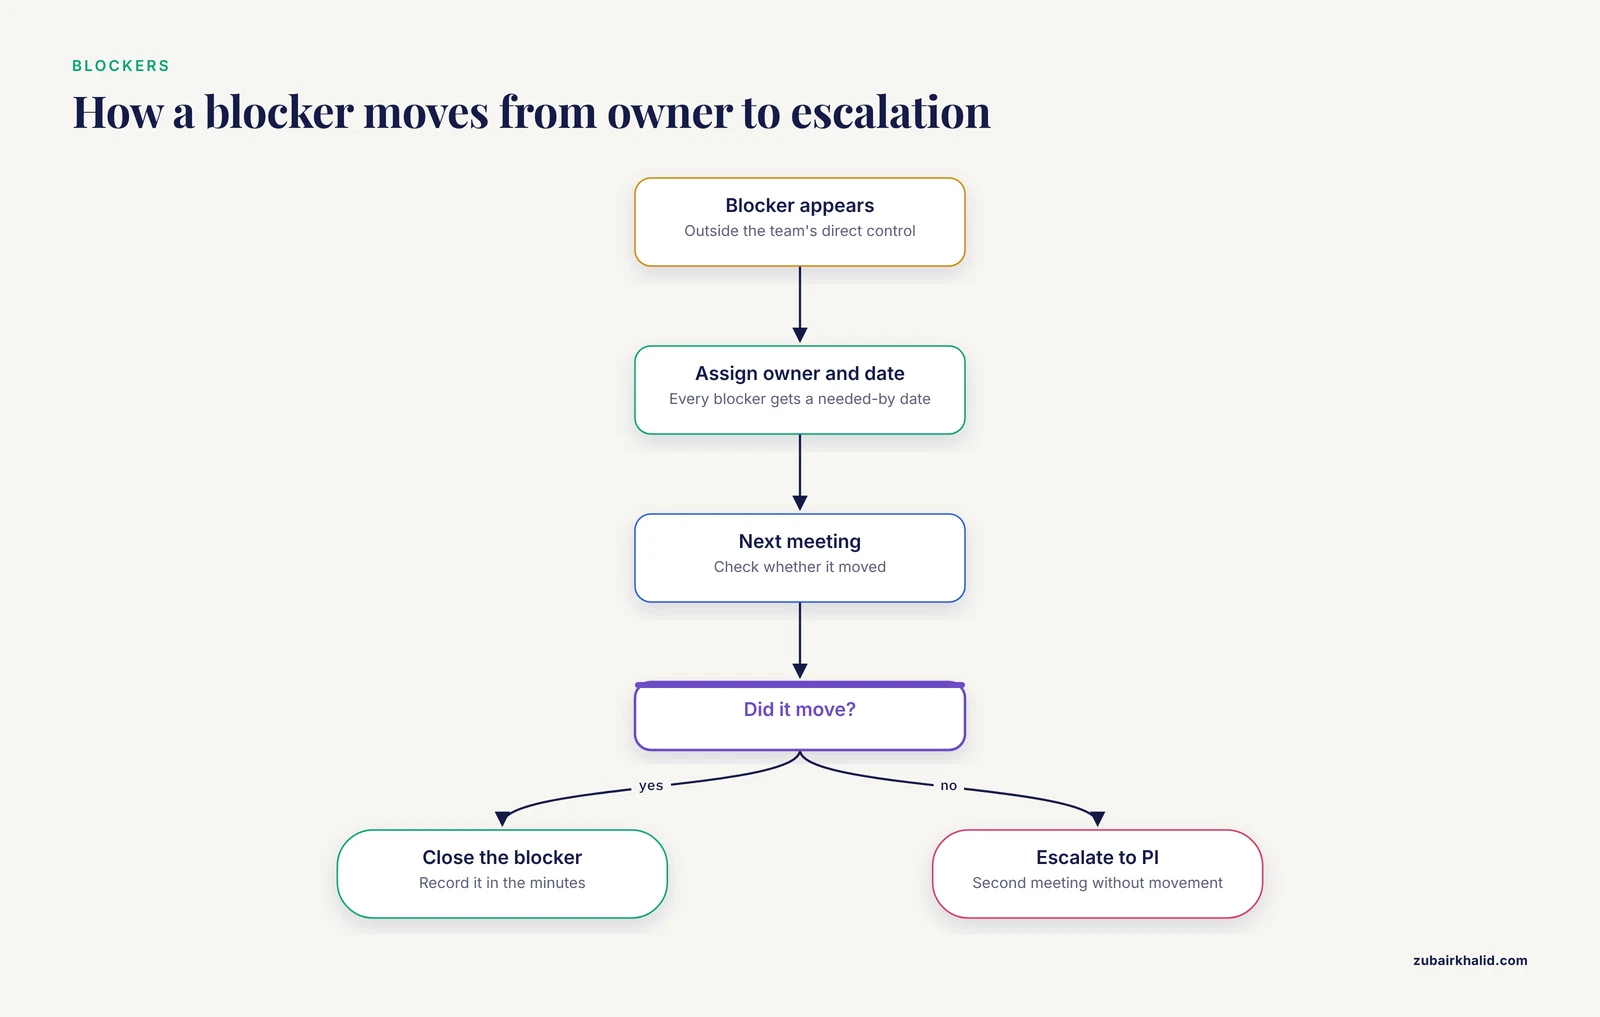
A blocker is anything outside the team's direct control that stops work, such as a pending order, an ethics amendment, an instrument booking, or a decision from a collaborator. Every blocker gets an owner and a needed-by date. A blocker that appears in two consecutive meetings without movement becomes an escalation item for the PI or the department, not a permanent fixture of the agenda.
Step 7. Apply the thresholds you set
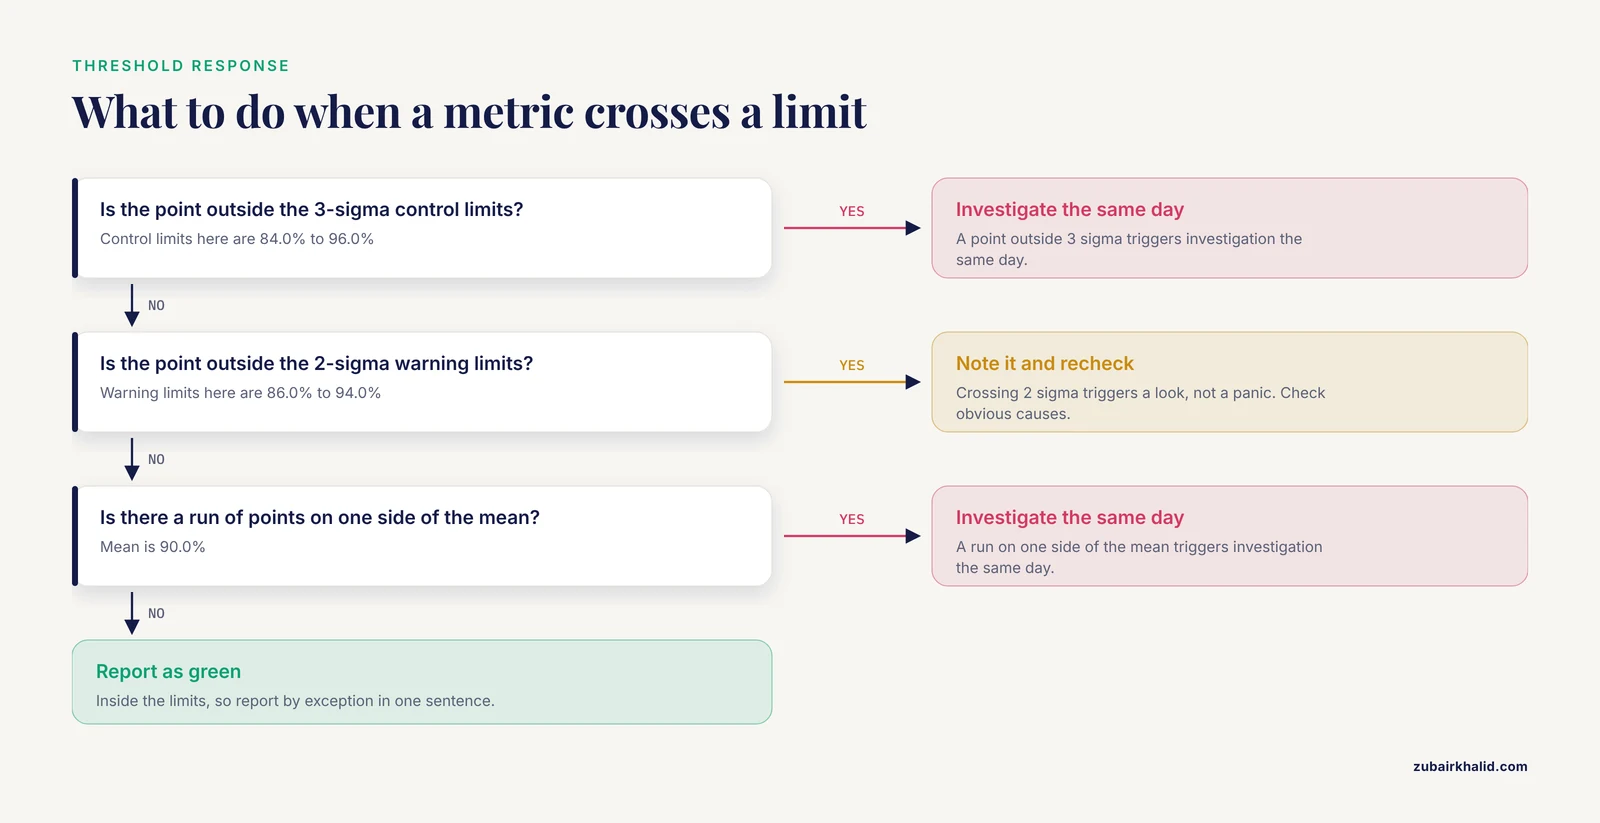
When a metric crosses a limit, the meeting executes the pre-agreed response instead of relitigating whether the deviation matters. This is the discipline that separates a status meeting from a discussion club. The threshold can be as simple as a fixed minimum percent progress, judged identically at every review.
Step 8. Close with decisions, owners, and dates
The notetaker reads back every action with its owner and due date, and every decision with its one-line rationale. Keep the close-out format identical from week to week so the minutes stay comparable over time. Standardization is the same principle behind the EU Quantum Flagship's KPI framework for quantum computing, where each benchmark ships with specified protocols and reporting standards so results remain comparable across platforms and across time [9]. Your minutes serve the same function at lab scale, same fields, every week.
STATUS MINUTES - <project name> - <date>
Status: AMBER (sequencing rate below warning limit)
Decisions: 1) Add a second miniprep day through week 12
Actions:
  A1 <owner> order reagents for the second miniprep day, due <date>
  A2 <owner> email collaborator about the construct 9 sequence, due <date>
  A3 <chair> update milestone 3 in the plan if the rate stays low, due <date>
Next meeting: <date>, pre-read deadline: <date> minus 24 hours
Step 9. Send the minutes within 24 hours
The notetaker sends the minutes to everyone who needs them, including stakeholders who did not attend. An action that appears in no minutes does not exist. Next week's chair starts from these minutes, which closes the loop.
The Dashboard Table to Keep Open During the Meeting
| Metric | Question it answers | How to compute | Warning sign |
|---|---|---|---|
| Percent complete | Are we where the plan says we should be? | completed units divided by planned units | actual percent below expected percent |
| Schedule gap | Ahead or behind, and by how much? | actual percent complete minus expected percent at today's date | a negative gap two meetings in a row |
| Required rate | Can we still hit the date? | remaining units divided by remaining weeks | required rate above the historical rate |
| Success or quality rate | Is the method holding? | usable outputs divided by attempts | a point outside the 2-sigma warning limits |
| Open blockers | What is stuck? | count of unresolved blockers, each with an owner | the same blocker appears twice in a row |
| Tracker activity | Is the team keeping pace between meetings? | updates, commits, or logbook entries per week | activity appears only near deadlines |
Scaling the Format for Consortia and Multi-Lab Programs
When several labs work on one program, keep the weekly team meeting small and add a periodic cross-team meeting that reviews the collaboration itself. The Human Brain Project's Partnering Projects meeting in September 2022 followed this pattern: independent research groups that partnered with the flagship presented their results, reflected on how the collaboration had gone, and discussed future interactions with the research infrastructure emerging from the project [10]. The transferable idea is alternation. Routine status lives in short meetings, and a longer periodic meeting handles results, collaboration quality, and forward planning.
Research Project Status Meeting Tips
These tips target the failure modes teams hit in their first months.
- Report by exception. Green items get one sentence each. The meeting earns its time on amber and red items only.
- Watch the space between meetings. Tracker activity is itself a metric. In an analysis of postgraduate students' interaction logs on a learning platform, activity peaked near task deadlines and gradual declines indicated academic fatigue [11]. The same pattern appears in commit histories, sample logbooks, and shared documents. A tracker that goes quiet on Tuesday is a cheaper warning than a missed milestone on Friday.
- Keep a decision log, not just an action log. Six months from now, the reasons behind decisions will matter more than the tasks.
- Separate status from science. If a dashboard number needs a technical deep dive, schedule a separate session with the right people. Protecting the status meeting's length is what keeps it alive.
- End early when everything is green. Do not invent problems to fill the slot. Finishing in 15 minutes teaches the team that the meeting is about signal, not duration.
- Re-baseline when scope changes. If the plan changes, recompute expected progress and the limits so the dashboard stays honest.
Common Mistakes and Limitations
The common mistakes in a research project status meeting are predictable, which makes them fixable. Each one below includes the exact phrase that signals it.
- Tracking too many metrics. A dashboard with 15 numbers guarantees that none get decisions. Fix: cut to three to six, and retire any metric that has not triggered a decision in two months.
- Accepting updates without dates. The phrase is "It's basically done." Fix: ask for the acceptance criterion and the date. "Basically done" is not a status.
- Letting the meeting become a data review. The phrase is "Can we look at the gel?" Fix: answer "yes, in the Thursday data session," and log it as an action.
- Debating thresholds in the meeting. The phrase is "Is 85 really that bad?" Fix: thresholds are set during planning, and the meeting only executes them. Renegotiate limits between meetings, with data.
- Actions without owners. The phrase is "Someone should email them." Fix: no name, no action. The notetaker reads owners back out loud.
- Using the meeting to assign blame. The phrase is "Why didn't you?" Fix: the chair redirects to "what would unblock this, and by when." A meeting that punishes honesty stops receiving honest status.
- Letting the plan go stale. The phrase is "The plan says week 6, but we all know that changed." Fix: when reality and the plan disagree, update the plan in the decision log and recompute the dashboard, in that order.
Limitations. The formats and calculations here are control tools. They do not replace scientific judgment about whether a result is credible or a protocol needs redesign, and they do not replace your institution's own rules on safety, ethics, and compliance. Teams differ in size, funding structure, and cadence, so treat the times, thresholds, and metric counts as starting points and adjust them to your project.
How to Tell the Meeting Is Working
Check the loop, not the mood:
- Minutes go out within 24 hours, every week.
- Every action has an owner and a due date, and last week's actions are done or explicitly rescheduled.
- The count of open blockers is flat or falling.
- No number in the meeting surprises anyone, because the tracker was current before the pre-read.
- The meeting ends on time at least four weeks out of five.
Next Steps
Once the weekly loop is stable, script the control-limit calculation so the dashboard updates itself, train a co-chair so the meeting survives absences, and move milestone-level reviews into a monthly deep dive. Add a new KPI only when a stakeholder asks a question the current list cannot answer.
Frequently Asked Questions
How often should a research team hold a project status meeting?
Weekly is the default for an active project. Biweekly can work during slow phases such as a long animal study or an instrument build, but tracker updates and the pre-read should still happen every week so the meeting never starts cold.
How long should the meeting last?
Thirty minutes for a team of four to eight, and forty-five if you carry more than four KPIs. If you regularly run over, the fix is a shorter metric list, not a longer meeting.
How is a status meeting different from a weekly lab meeting?
A status meeting compares progress against the plan and assigns actions, while a lab meeting analyzes data and plans experiments. Mixing the two makes both worse, so give each its own calendar slot.
How many KPIs should the meeting cover?
Three to six, each with a target, a warning limit, and a pre-agreed response. Retire any metric that has not triggered a decision in two months.
What should we do when a metric crosses its control limit?
Follow the response you agreed in advance, usually investigate the same day and report back before the next meeting. Do not renegotiate the limit in the meeting where it was crossed.
Who needs to attend?
The people who own the current milestones, plus the chair and the notetaker. Everyone else reads the minutes, and stakeholders join when a red status needs their decision.
What if someone has no progress to report?
A blank update is information. Ask what is blocking them, record it as a blocker with an owner and a date, and move on. Repeated blank updates from the same person point to a workload or design problem to solve outside the meeting.
How do we handle a project that is behind schedule?
Quantify the gap with the percent-complete math, list the options that close it, and take the decision to whoever owns the deadline. The meeting's job is to make the gap visible early and honestly.
Sources
- Identification of Key Performance Indicators in Project-Based Organisations through the Lean Approach
- From a Comprehensive Pool to a Project-Specific List of Key Performance Indicators for Monitoring the Positive Energy Transition of Smart Cities-An Experience-Based Approach
- Key Performance Indicators (KPI) to Measure Effectiveness of Lean Construction in Indonesian Project
- Tracking Key Performance Indicators within Educational Institutions: The Balanced Scorecard Approach
- Responsible research and innovation in practice an exploratory assessment of Key Performance Indicators (KPIs) in a Nanomedicine Project
- Evaluation of the implementation progress through key performance indicators in a new multimorbidity patient-centered care model in Chile
- Tracking quality: can embryology key performance indicators be used to identify clinically relevant shifts in pregnancy rate?
- Contributing Factors to Key Performance Indicators of Saudi Arabian Construction Project Success
- The EU Quantum Flagship's Key Performance Indicators for Quantum Computing
- Human Brain Project Partnering Projects Meeting: Status Quo and Outlook
- Key performance indicators for optimizing academic performance and course design in online educational platforms