How to Report Data Sharing Impact to Funders
By Dr. Zubair Khalid, DVM, MS, PhD ·

By the end of this guide, you will be able to write a data sharing impact report that a program officer can read in five minutes and defend to a review panel. You will know which numbers to collect, where to get them, how to calculate derived metrics, and how to phrase results honestly when a dataset has been reused less than you hoped.
To follow the walkthrough, you need four things on hand: your grant or award number, the persistent identifier (DOI or accession) for each dataset you deposited, access to the repository's usage statistics or request logs, and a spreadsheet tool or a Python installation (version 3.8 or later, no extra packages required for the example below). If your data are in a controlled-access repository, you also need the repository's data request log, because downloads are not visible for controlled datasets.
Why funders ask for data sharing impact
Funders invest in research data sharing because reuse multiplies the value of a single data collection. A symposium report on data sharing in nutritional science concluded that improved sharing practices can enhance research efficiency and impact, but that structural, cultural, and methodological barriers still constrain them, including fragmented datasets, heterogeneous formats, consent and privacy constraints, and academic incentive systems that reward publications over data stewardship [1]. That same report identified clear opportunities funders care about: new research questions answered with existing data, reduced duplication of data collection, and more robust and equitable science [1].
Funders also treat data sharing as a risk-management tool. An analysis of public clinical trial funders in Europe, drawing on practice at KCE Trials in Belgium, the National Institute for Health and Care Research (NIHR) in England, and ZonMw in the Netherlands, grouped funder practices with the collective aim of reducing risk and enhancing impact into ten categories [2]. In that framework, data sharing and results implementation sit alongside feasibility checks and milestone-based payment as ways a funder protects its investment [2]. When you report impact, you are showing the funder that this particular risk paid off.
Reporting culture itself is converging on structured standards. The CONSORT Statement, first published in 1996 and updated through CONSORT 2025, became the international standard for reporting randomized trials because a checklist and flow diagram make completeness auditable [3]. Your data sharing impact report benefits from the same logic. A fixed structure with a small number of verifiable numbers beats a narrative essay every time.
The baseline is low enough that modest sharing stands out. In a systematic review of 248 randomized trials of regional anesthesia for lower-extremity surgery published between 2014 and 2024, only 1.2 percent shared raw data, although pre-registration occurred in 39.9 percent and transparency scores correlated with clinical-utility scores (r = 0.32, p < 0.001) [4]. If you deposited anything usable and can show one instance of reuse, you are already ahead of most of your field, and saying so with data is legitimate.
What counts as impact
Break impact into four verifiable categories. Each category maps to a concrete artifact you can cite in the report.
- Availability. The dataset exists, has a persistent identifier, is described with metadata, and is findable. This is the floor. Report the DOI, the repository, the license, and the access model.
- Access. People or systems obtained the data. For open data this is downloads and unique users. For controlled data this is approved data access requests and the number of external teams granted access.
- Reuse. Someone analyzed the data and published, presented, or filed a regulatory result from it. Secondary publications are the strongest signal, and you classify them as internal (at least one original investigator is an author) or external [5].
- Downstream influence. Citations of secondary publications, policy or guideline citations, new grant proposals that cite the dataset, and training outcomes such as students who learned on the dataset.
Reuse metrics behave in ways that surprise people the first time. A cross-sectional study of the Yale University Open Data Access (YODA) Project platform, which shares individual participant data (IPD) from Johnson & Johnson sponsored trials, examined 336 eligible trials and found that 265 of them (79 percent) had at least one associated secondary publication, totaling 1,167 publications, of which 209 (17.9 percent) were external [5]. Among external publications with a reported data access mechanism, most (85 percent) obtained the data through a sharing platform rather than through ad hoc requests [5]. Two lessons follow. First, sharing infrastructure generates reuse at scale, and the platform itself is part of the impact story. Second, the timing lag between deposit and secondary publication means a first-year report with zero reuse is not a failed dataset, it is an early one.
Choosing a repository changes what you can report
Before you can report impact, your data have to live somewhere that generates measurable events. A quick data repository comparison across access models:
| Feature | Open repository (any requester) | Controlled-access repository | Secure enclave or commercial partner environment |
|---|---|---|---|
| Example in the literature | Open Science Framework registrations [6] | YODA Project for trial IPD [5], Cancer Imaging Archive for imaging [7] | Governance partnerships around commercial purchase data [8] |
| Usage metric available | Downloads, views, citations | Approved data access requests, user institutions | Contract-defined reports only |
| Strongest impact evidence | Download counts plus DOI citations | External secondary publications [5] | Documented policy or industry uptake [8] |
| Privacy control needed | Anonymization or defacing before deposit [5] | Data use agreement, committee review | Legal agreements, secure environment, sector champions [8] |
| Reporting burden on you | Low, metrics are public | Medium, request logs from repository | High, depends on partner |
Three practical points fall out of this comparison. First, depositing in a platform with a formal request process gives you a cleaner reuse trail than emailing files, because the platform log itself documents who used the data [5]. Second, the NIH Data Management and Sharing (DMS) policy and its controlled-access security requirements have increased attention to how human imaging data are protected, including facial anonymization before or instead of open release [7]. Third, some data cannot go into an open repository at all. Analyses of supermarket transaction and loyalty card data show that commercial sensitivity requires secure environments, transparent processes, and formal academic-industry partnerships, and that effective sharing in those settings depends on champions within both sectors [8]. If your project used such data, your impact report should describe the governance route rather than apologize for it.
A fillable report template
Most funders accept a two-page structured report. Use this format, which mirrors how funders already think about risk and return [2].
Section 1. Summary. Two sentences. Grant number, number of datasets, one headline number (for example, "4 external teams accessed the data, producing 3 secondary publications").
Section 2. Dataset inventory. One row per dataset: title, persistent identifier, repository, access model (open, controlled, enclave), format, size, license.
Section 3. Access and reuse metrics. Downloads or approved requests, unique users, secondary publications with citations, and the internal versus external split [5].
Section 4. Downstream outputs. Citations of secondary work, preprints, conference talks, theses, code derived from the data, and any new proposals that build on the dataset.
Section 5. Barriers and mitigations. Be candid. Common barriers named in the literature include consent restrictions, privacy processing that alters the data, and staff time [1]. Describe what you did about each one.
Section 6. Privacy and quality trade-offs. If you anonymized, defaced, or aggregated before sharing, state it and quantify or qualify the effect (more on this below).
Section 7. Costs and sustainability. Curation time, repository fees, and who pays after the grant ends.
Section 8. Next period plan. Two or three verifiable commitments, not aspirations.
Step-by-step walkthrough with worked calculations
Step 1. Build the dataset inventory
Create a spreadsheet or a small Python dictionary. Every dataset needs an unambiguous identifier so a funder can verify your claims independently.
datasets = [
    {
        "title": "Sleep and activity cohort, wave 1",
        "grant_id": "R01-EXAMPLE-001",
        "doi": "10.1234/example.dataset.001",
        "repository": "Domain repository X",
        "access_model": "open",
        "downloads_2025": 412,
        "unique_users_2025": 87,
    },
    {
        "title": "Clinical trial IPD, protocol A",
        "grant_id": "R01-EXAMPLE-001",
        "doi": "10.1234/example.dataset.002",
        "repository": "Controlled-access platform Y",
        "access_model": "controlled",
        "approved_requests_2025": 4,
        "external_teams_2025": 3,
    },
]
These numbers are illustrative. Pull yours from the repository statistics page for open data, and from the data access request log for controlled data.
Step 2. Pull repository metrics
For open repositories, the statistics page usually reports total downloads and sometimes unique users. Record the reporting window explicitly, because a funder comparing two reports needs matching periods. For controlled repositories, ask the platform administrator for a request log covering your grant period. If your data sit in a secure environment with a commercial partner, ask for the contractually defined report instead of estimating [8].
Step 3. Find secondary publications
Search for citations of your primary publication and check which citing works say they used your dataset. This is the same approach used in the YODA portfolio study, which identified secondary publications through Web of Science citation searches of primary publications [5]. Classify each secondary publication as internal or external based on whether an original investigator is an author [5]. External reuse is the metric funders weight most, because it demonstrates value to people you did not pay.
Step 4. Compute derived metrics
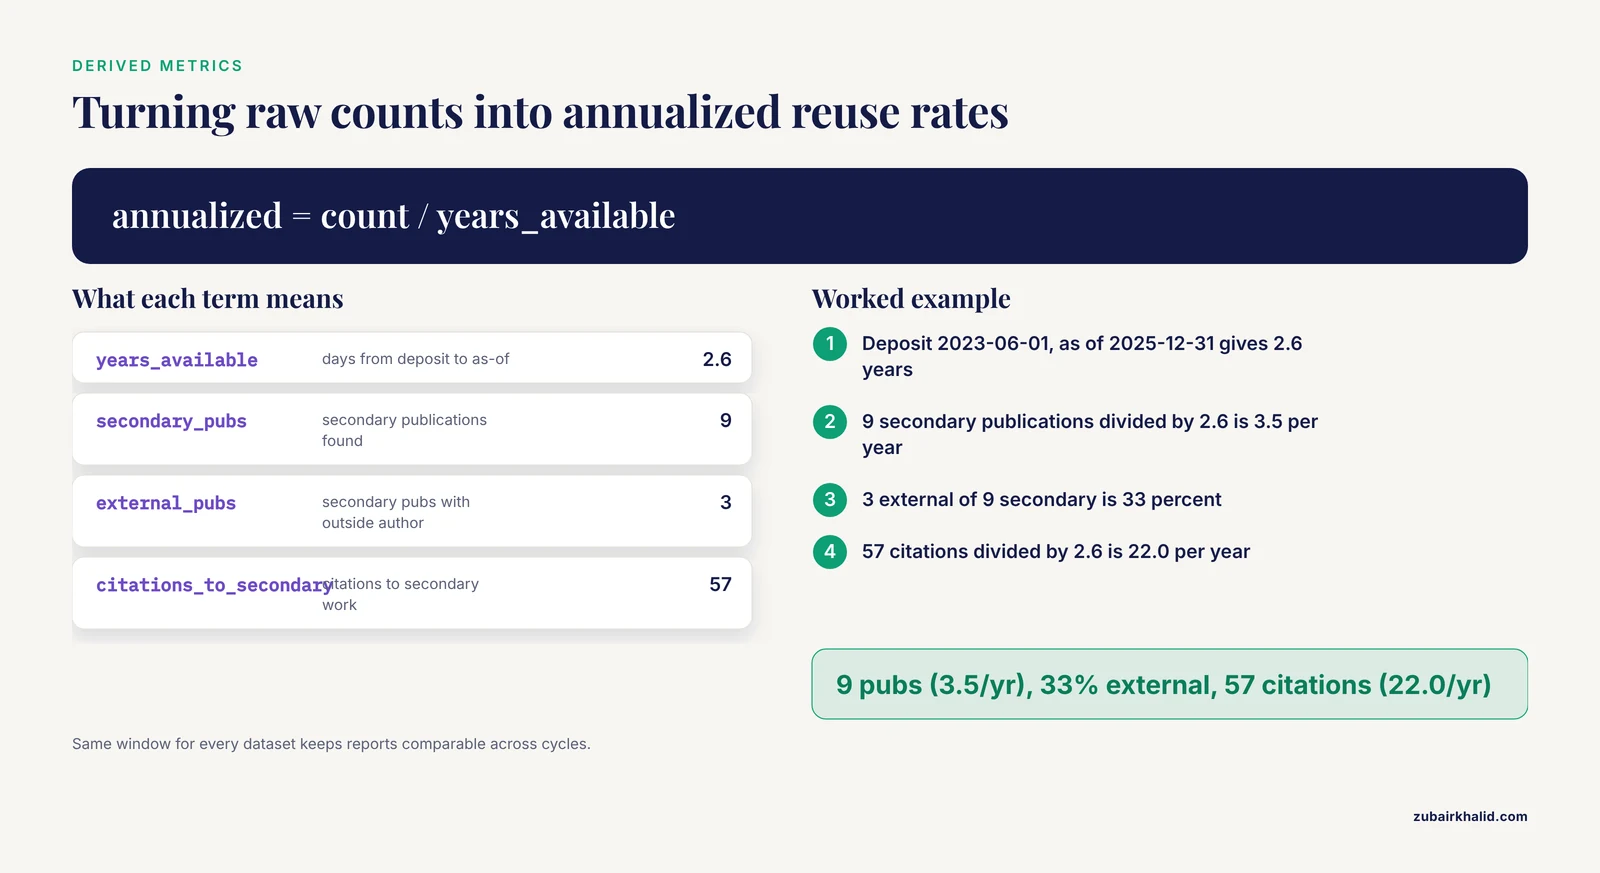
Annualized rates make datasets deposited at different times comparable. Here is a small script that produces report-ready lines.
from datetime import date

deposit_date = date(2023, 6, 1)
as_of = date(2025, 12, 31)
years_available = (as_of - deposit_date).days / 365.25

secondary_pubs = 9
external_pubs = 3
citations_to_secondary = 57

annualized_secondary = secondary_pubs / years_available
annualized_citations = citations_to_secondary / years_available
external_share = external_pubs / secondary_pubs

print(f"Dataset available for {years_available:.1f} years")
print(f"Secondary publications: {secondary_pubs} "
      f"({annualized_secondary:.1f} per year)")
print(f"External secondary publications: {external_pubs} "
      f"({external_share:.0%} of secondary output)")
print(f"Citations to secondary publications: {citations_to_secondary} "
      f"({annualized_citations:.1f} per year)")
Expected output:
Dataset available for 2.6 years
Secondary publications: 9 (3.5 per year)
External secondary publications: 3 (33% of secondary output)
Citations to secondary publications: 57 (22.0 per year)
Step 5. Add the reuse lag, because it reframes quiet datasets
Compute months from deposit to first secondary publication. The YODA study examined the timing of secondary publications and found substantial lag between primary publication and external reuse [5]. Reporting the lag protects you from the appearance of inactivity in early reports, and it gives the funder a realistic expectation for the next reporting cycle.
Step 6. Quantify privacy-related quality loss if you transformed the data
If you anonymized before sharing, your impact report should state the trade-off rather than hide it. Privacy researchers have shown that k-anonymity, a method that ensures each combination of quasi-identifying attributes appears in at least k records, can introduce distributional and inferential distortions that the anonymization tool itself does not report. One quantitative case study applied k-anonymity at k = 5, 10, and 15 to primary diagnosis codes and hospital length of stay across 719,387 inpatient encounters using the ARX tool, and asked whether diagnosis-specific length-of-stay patterns remained reproducible after anonymization [9]. In head imaging, systematic evaluation of three defacing algorithms across MRI and CT data from 600 subjects at three institutions found that facial anonymization can alter image statistics and potentially compromise AI model performance, framing the problem as a privacy-utility trade-off under the NIH DMS policy environment [7]. A single sentence in your report, such as "we applied k-anonymity at k = 5 and verified that the primary outcome distribution was preserved within X percent of the raw data," converts a hidden liability into evidence of methodological care. If you cannot compute a quantitative comparison, describe the transformation qualitatively and link to the tool and settings.
Step 7. Write the narrative around the numbers
Numbers alone do not persuade a panel that reads forty reports. Add three sentences of context: what became possible because the data were shared, which barrier you hit and how you handled it, and what you will do differently in the next period. Symposia on data sharing practice consistently report that time- and resource-intensive requirements and publication-focused incentives are the dominant barriers, so naming yours shows you understand the system rather than that your project failed [1].
Step 8. Check the report before submitting
Verify four things. Every persistent identifier resolves. Every number has a source (repository log, citation database, or your own script output) and a reporting window. The internal versus external split matches your authorship classification [5]. No claim appears twice with different values. Then have a colleague who is not on the grant read Section 1 and Section 8 alone. If they cannot say what the data enabled and what happens next, revise those two sections.
Common Mistakes and Limitations
Counting downloads as impact. A download is a proxy for interest, not for reuse. Pair it with at least one downstream signal, or label it explicitly as an availability metric.
Reporting raw counts without a denominator or time window. "5,000 downloads" means nothing without "in 2025, over 30 months of availability." Always attach the window and, where useful, annualize.
Ignoring the internal versus external distinction. Self-reuse inflates apparent impact. The internal versus external classification used in the YODA analysis exists for exactly this reason [5]. Report both counts.
Treating a quiet first year as failure. Secondary reuse lags deposit by years in documented portfolios [5]. Set expectations in the report itself.
Overclaiming causation. A citation to your paper that merely mentions the dataset is not reuse. Read the citing work or mark the claim as unverified.
Hiding privacy transformations. Anonymization and defacing change the data, sometimes measurably. A report that omits this invites a reviewer to find it.
Treating trust as optional context. Willingness to share data, and the willingness of communities to contribute data, depends on privacy experiences and trust. Commentators have proposed structured evaluation metrics for how privacy-related experiences shape consent behavior and participation in data sharing [10]. If your project involved human participants, one sentence on participant-facing protections belongs in the report.
Overstating economic impact. Practice-based evidence from digital health in low- and middle-income countries shows that benefits such as efficiency gains are frequently real but non-cashable, and that policymakers struggle to translate technical promise into fiscal narratives for funders and investors [11]. Describe efficiency and reuse benefits in kind, and resist converting them into dollar figures you cannot defend.
One limitation of the approach itself. Many funding practices, including how funders assess data sharing reports, remain under-studied, and assessment of the effectiveness of individual funding practices is an under-researched area [2]. Your report is evidence for the funder, not a formal evaluation of your own impact, and honest framing on that point strengthens rather than weakens it.
Individual research situations vary, and a program officer's specific instructions override any general template, including this one.
A filled example you can adapt
Here is Section 1 through Section 4 of a completed report, condensed. The values are illustrative and the structure is the reusable part.
Grant: R01-EXAMPLE-001. Reporting period: January 1 to December 31, 2025. Summary. Two datasets were deposited under this award. During the reporting period the open dataset recorded 412 downloads by 87 unique users, and the controlled-access IPD dataset received 4 approved data access requests from 3 external teams. Three secondary publications cite or use these datasets, two external. Reuse detail. External reuse included a reanalysis of the primary endpoint using a different statistical model and a methods paper validating a processing pipeline on our data. One external team obtained the data through the repository platform, consistent with the pattern that platforms, not ad hoc requests, carry most external reuse in documented IPD portfolios [5]. Privacy processing. The imaging component was defaced before deposit following current controlled-access practice expectations [7]. We verified that the defaced volumes retained the anatomical structures required for our primary analysis. Plan for next period. Deposit wave 2 with the same identifiers and metadata schema, respond to all data access requests within 10 business days, and publish a data descriptor to increase findability.
A short report like this answers every question a panel typically asks: does the data exist, can people get it, did anyone use it, and is the team managing the trade-offs responsibly.
Frequently Asked Questions
What does "data sharing impact" actually mean to a funder?
It means evidence that deposited data were found, accessed, and reused in ways that produced scientific outputs beyond the original study, plus evidence you managed privacy and quality trade-offs responsibly. Availability is the floor, reuse is the signal, and downstream influence is the multiplier.
Is there a standard report format for data sharing impact?
No single format is universal, but a structured two-page report with dataset inventory, access metrics, reuse metrics, barriers, and next-period plans matches how funders frame risk and impact [2]. Check your specific funder's reporting instructions first, then use the structure above within their form.
Where can I find a template I can adapt?
Use the eight-section template in this article as the base. The YODA-style fields to keep are persistent identifier, access model, downloads or approved requests, and the internal versus external split of secondary publications [5].
How do I report impact when my dataset has no downloads yet?
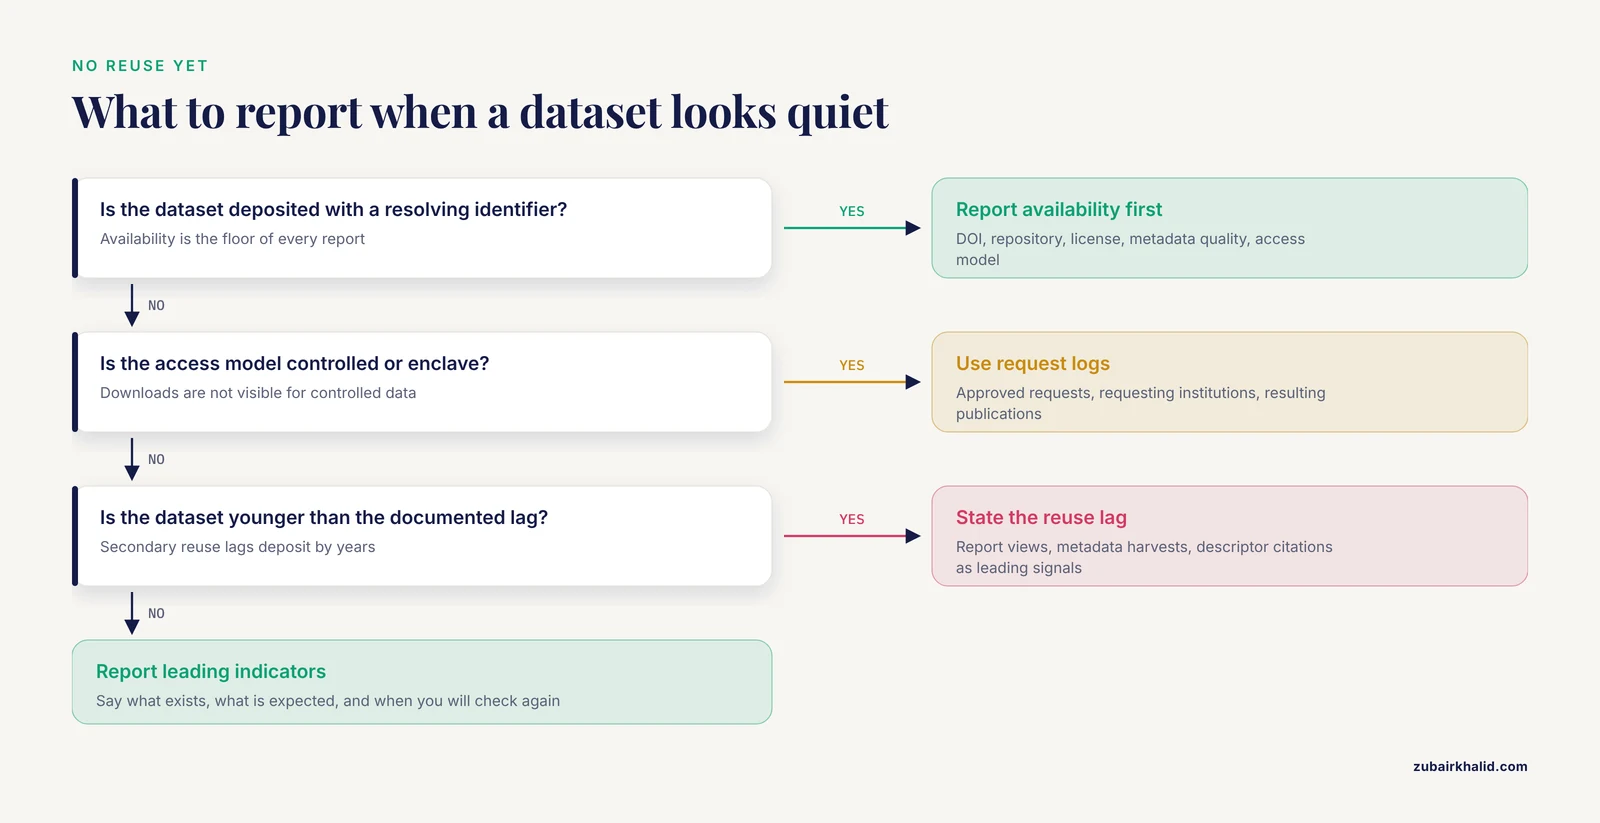
Report availability honestly (deposited, identifier, metadata quality), state the expected reuse lag based on documented IPD portfolios where reuse accumulated over years [5], and report leading indicators such as views, metadata harvests, or data descriptor citations instead of pretending reuse exists.
How should I handle controlled-access data in an impact report?
Report approved request counts, the number and type of requesting institutions, and resulting secondary publications, and explain why the access model is controlled, such as consent terms or identifiability risk. The NIH DMS policy environment explicitly contemplates controlled-access handling for sensitive imaging data [7].
Can I count citations of my own primary paper as data sharing impact?
No. Citations of the primary paper measure the study, not the shared data. Count citations to secondary publications that used the dataset, and classify those secondary publications as internal or external by authorship [5].
How often should I report data sharing impact?
Match your funder's reporting cycle, typically annually or at renewal, and always at closeout. Use the same reporting window each time so numbers are comparable across reports.
What if my data legally cannot be shared?
Report the governance route as the impact mechanism. Secure environments, formal data use agreements, and partnership governance are recognized sharing models, particularly for commercial or highly sensitive data [8], and describing who accessed the data under what agreement is a legitimate impact report even without public downloads.
Sources
- Improving data sharing in nutritional science: a symposium report of challenges, opportunities, and best practice recommendations.
- Good clinical trial funding practices: how can public funders reduce the risk of trial failure and improve health impact?
- CONSORT at 30 years: history, evolution, and impact of a reporting guideline for randomized controlled trials - Part 1.
- Clinical utility of randomized controlled trials of regional anesthesia for lower-extremity surgery: a systematic review.
- Secondary use and scholarly impact of a portfolio of clinical trials with shared individual participant level data: cross sectional study.
- Intervention impact of audiovisual arts in youth mental health promotion: a scoping review protocol.
- Balancing privacy and performance: the impact of facial defacing on AI in medical imaging.
- Conflict or interest? Using consumer purchase data to support food systems transformation.
- Quantifying the Impact of Anonymization-Induced Clinical Data Quality Loss: Methodological Quantitative Case Study Using Primary Diagnosis Codes and Hospital Length of Stay.
- Understanding Race as a Key Analytic Dimension in AI-Enabled, Health-Related Social Engagement Online and Its Role and Impact in Health Research.
- Digital Health and Fiscal Credibility in Low- and Middle-Income Countries: A Scoping Review of Practice-Based Evidence.