How to Write a README File for Your Research Dataset: A Template
By Dr. Zubair Khalid, DVM, MS, PhD ·

By the end of this guide you will be able to write a complete README file for your research dataset, adapt the free README file template for research data below to your own project, and run through a short reproducibility checklist before you deposit the dataset in a repository. You need only a plain text editor (Notepad on Windows, TextEdit set to plain text mode on macOS, or Visual Studio Code on any platform), the list of files in your dataset, and your lab notebook or protocol documents. No special software is required.
What a README Does for Your Dataset
A README file is a plain text or Markdown document that sits at the top level of a dataset folder and explains what the data are, how they were produced, how the files are organized, and how to reuse them. The name is an instruction to the reader: read me first.
Reproducibility is the cornerstone of science, and the FAIR principles (Findable, Accessible, Interoperable, Reusable) aim to maximize the reuse of research data [1]. Reuse depends on clear, detailed documentation of the data and its metadata [1]. A README carries much of that documentation because many archival platforms offer limited space for structured metadata, so the README is where the essential context and instructions for users actually live [1].
The broader data management literature reaches the same conclusion. Effective data management, including organization and documentation, is central to scientific integrity and reproducibility, and well documented data allow others to validate results and build on them [2]. Funding agencies increasingly expect rigorous documentation and sharing of data and code [2].
Published datasets show the pattern in practice. Repository records titled "Research data supporting" followed by the article title appear across disciplines, from plant science to physics, and their authors state plainly that further details are in the readme file and that data files for each figure sit in the corresponding folder. The README is the map. Without it, even a well organized archive is a pile of files with unexplained names.
Choosing the README Format
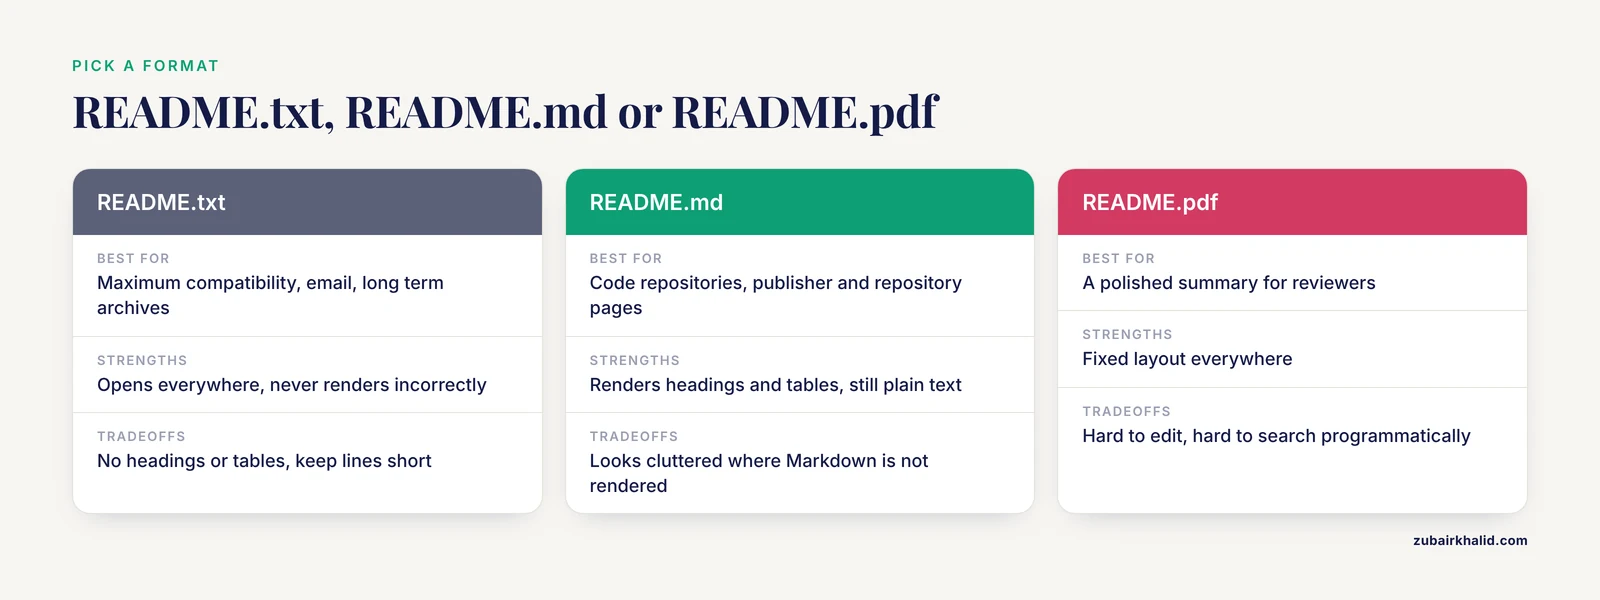
Save the file as README.md or README.txt. Both open in any editor on any operating system. Markdown (.md) adds light structure such as headings and tables that render on GitHub, GitLab, and most repository pages, while remaining readable as plain text. Work on ReadMe tooling notes that traditional text based ReadMe files are designed solely for human readability, which limits automated reuse, so a consistent, structured layout pays off twice [1]. Avoid PDF or Word formats for the README itself, because they hide the text inside a container that some repositories and scripts handle poorly.
| File name | Best for | Strengths | Tradeoffs |
|---|---|---|---|
| README.txt | Maximum compatibility, email, long term archives | Opens everywhere, never renders incorrectly | No headings or tables, keep lines short |
| README.md | Code repositories, publisher and repository pages | Renders headings and tables, still plain text | Looks cluttered in a viewer that does not render Markdown |
| README.pdf | A polished summary for reviewers | Fixed layout everywhere | Hard to edit, hard to search programmatically, some repositories reject it |
The README File Template for Research Data
Copy this free README file template for research data into a new file and replace every bracketed item. Delete any section that truly does not apply, and remove the bracketed guidance as you go. Traditional ReadMe templates embed instructions in parentheses that researchers must fill in and then strip out, which takes real time and effort [1], so clean as you write rather than at the end.
# [Dataset title: specific, under about 15 words]

## Creator(s) and Contact
- [Full name], [Department, Institution]
- Email: [an address you will still check in five years]
- ORCID: [your 16 digit researcher identifier, or delete this line]

## Dates and Version
- Data collected: [YYYY-MM-DD to YYYY-MM-DD]
- README last updated: [YYYY-MM-DD]
- Version: [1.0 first release, 1.1 corrections, 2.0 new data]

## Dataset Overview
[Two to four sentences: what was measured, on which samples or
subjects, under what conditions, where and when, and the question
the data support.]

## File Inventory
| Path | Description | Format |
|------|-------------|--------|
| data/raw/ | [Unmodified instrument output] | [CSV] |
| data/processed/ | [Cleaned tables derived from raw] | [CSV] |
| analysis/ | [Scripts that turn raw into processed] | [R or Python] |
| docs/ | [Protocol, instrument settings, session information] | [PDF, TXT] |

## Folder Structure
[data/raw/ holds files exactly as exported from the instrument and is
never edited. data/processed/ holds tables produced by the scripts in
analysis/. docs/ holds the protocol and instrument logs.]

## Variable Dictionary
| Column | Meaning | Units | Allowed values or range |
|--------|---------|-------|--------------------------|
| [sample_id] | [unique identifier per sample] | [none] | [pattern, e.g. P01 to P48] |
| [mass_mg] | [measurement name] | [mg] | [0.1 to 50] |

## Methods Summary
[Conditions, sample size, instrument model and key settings, sampling
schedule. Point to the full protocol in docs/.]

## Processing Steps
1. [Step one, in order.]
2. [Step two.]
[List every transformation between raw and processed data, including
exclusions and corrections.]

## Software and Versions
- [R 4.3.1 with package versions, or Python 3.11.4 with package list]
- [Operating system if the scripts depend on it]

## Missing Data Codes
- [Empty cell: measurement not taken]
- [-999: failed a quality check, describe the check]

## Sharing and Access
- License: [for example CC BY 4.0]
- [Any access restriction and the reason for it]

## Citation and Related Resources
- [Dataset DOI, added after deposit]
- [Associated article citation]
- [Links to protocol, code repository, preregistration]
Field-by-Field Notes
Title. Name the measured variable, the organism or system, and the condition. "Seedling growth under two nitrate supplies" beats "Plant data".
Creator and contact. List the person who can answer questions about the data, not only the principal investigator. An ORCID is a persistent 16 digit identifier that links the dataset to you regardless of name changes or institution moves.
Version. Start at 1.0. Increment the minor number for corrections and the major number for new data. Record the date of the last update so users can spot stale copies.
Overview. A stranger should learn in four sentences what was measured, on what, and why. Write this section last if it helps, but never skip it.
File inventory. One row per path or naming pattern. Mark which files are inputs and which are outputs so users know where to start and what they may regenerate.
Variable dictionary. This is a data dictionary, a table listing every column name with its meaning, units, and allowed values. Units belong here even when the column name hints at them, because abbreviations differ between labs. Define missing data codes explicitly so no one confuses "blank because not measured" with "blank because the sensor failed".
Methods summary. Include enough detail to interpret the data without reading the paper: sample size, conditions, instrument model, key settings, and the sampling schedule. Point to the full protocol file rather than duplicating it.
Processing steps. List transformations in order, including exclusions and corrections. The same raw data processed in different ways can produce different final outcomes, so the pipeline is part of the scientific result [3].
Software and versions. Exact version numbers, not "R" or "Python". Package versions matter when functions change between releases.
License and citation. Choose a license (CC BY 4.0 is a common choice for reusable data) and draft the citation so others know how to credit the work.
Step-by-Step Walkthrough with Commands
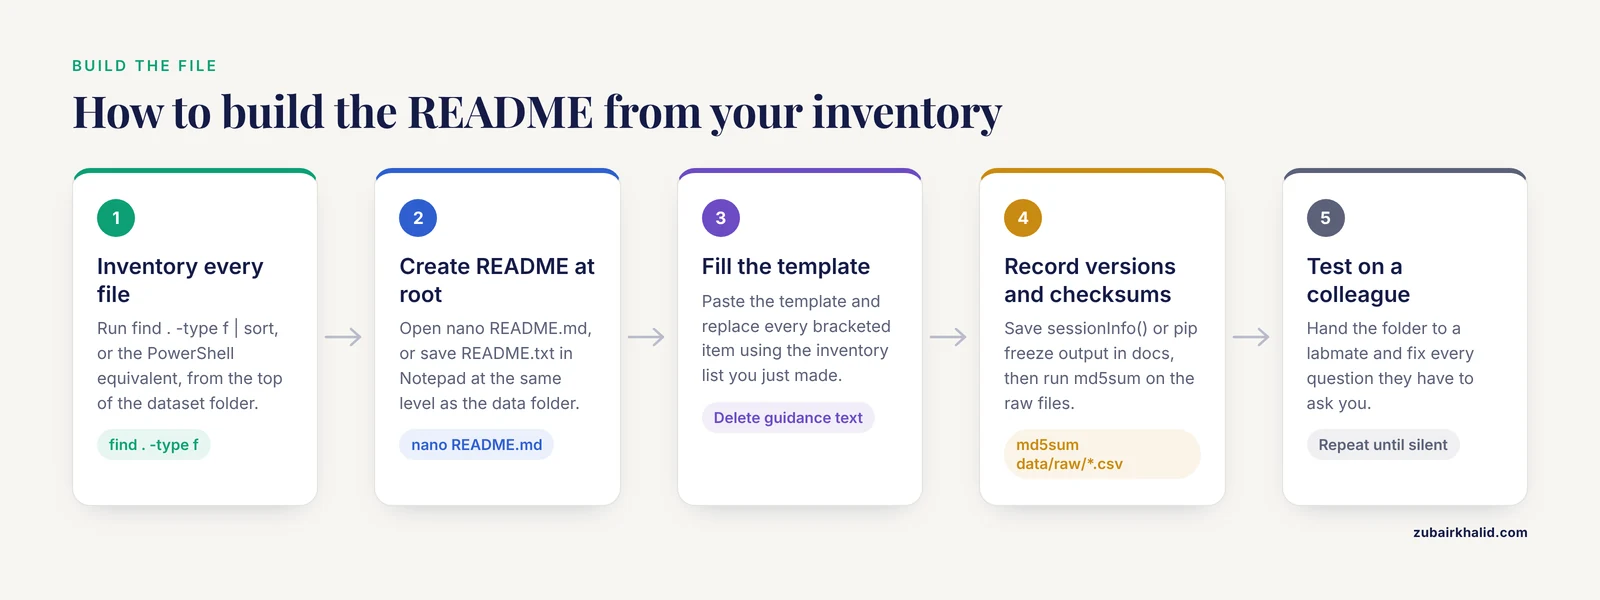
The worked example below builds a README for a small hypothetical plant experiment stored in a folder called seedling_growth_nitrate. The same steps work for any dataset.
1. Inventory every file
On Linux or macOS, from the top of the dataset folder, run:
find . -type f | sortExpected output:
./analysis/growth_analysis.R
./checksums.md5
./data/processed/growth_summary.csv
./data/raw/plateA_2025-03-14.csv
./data/raw/plateA_2025-03-21.csv
./data/raw/plateB_2025-03-14.csv
./data/raw/plateB_2025-03-21.csv
./docs/protocol_v2.pdf
On Windows, use PowerShell:
Get-ChildItem -Recurse -File | Resolve-Path -RelativeThis list becomes your file inventory. If anything here surprises you, investigate it before depositing, because stray files (temporary exports, personal notes) do not belong in a public dataset.
2. Create the README at the top level
nano README.mdOn Windows, open Notepad and save the file as README.txt in the dataset root. The root means the same level as the data folder, not inside it.
3. Fill the template using your inventory
Paste the template from the previous section and replace the brackets. Here is the completed readme file template for research data example for this dataset:
# Seedling growth under two nitrate supplies, greenhouse experiment 2025

## Creator and Contact
- J. Rivera, Plant Sciences, State University, [email protected]

## Dates and Version
- Data collected: 2025-03-14 to 2025-04-18
- README last updated: 2025-05-02
- Version: 1.0

## Dataset Overview
Shoot dry mass and root length were measured on 240 Arabidopsis
seedlings grown for five weeks under low or adequate nitrate supply.
The dataset includes raw scanner output, a cleaned summary table,
and the R script that produced the summary.

## File Inventory
| Path | Description | Format |
|------|-------------|--------|
| data/raw/ | One CSV per plate per week, exactly as exported | CSV |
| data/processed/growth_summary.csv | One row per seedling per week | CSV |
| analysis/growth_analysis.R | Reads data/raw, writes data/processed | R |
| docs/protocol_v2.pdf | Growth and sampling protocol | PDF |
| checksums.md5 | MD5 checksums for every raw file | TXT |

## Variable Dictionary (growth_summary.csv)
| Column | Meaning | Units | Values |
|--------|---------|-------|--------|
| seedling_id | Plate letter plus row and column | none | A01 to H12 |
| treatment | Nitrate supply in the medium | none | low, adequate |
| shoot_dry_mass | Dry mass after freeze drying | mg | 0.5 to 45 |
| root_length | Projected root length from images | mm | 2 to 180 |
| na_flag | Reason a value is missing | none | see Missing Data Codes |

## Methods Summary
Seeds were stratified at 4 degrees C for 48 hours, then grown on agar
plates under two nitrate treatments, 24 plates per treatment. Plates
were imaged weekly. Full details in docs/protocol_v2.pdf.

## Processing Steps
1. growth_analysis.R imports every CSV in data/raw.
2. Image positions are parsed into seedling_id.
3. Mass readings below 0.5 mg are set to -999 and flagged (below the
   balance detection limit).

## Software and Versions
- R 4.3.1 (full sessionInfo() output saved in docs/sessionInfo.txt)

## Missing Data Codes
- Empty cell: measurement not taken that week.
- -999: value excluded by the detection limit rule above.

## Sharing and Access
- License: CC BY 4.0

## Citation
- Dataset DOI will be added at deposit.
- Please cite the associated article once published.
4. Record exact software versions
In the R console, run:
sessionInfo()The first lines of the output look like this:
R version 4.3.1 (2023-06-16)
Running under: Ubuntu 22.04.3 LTS
Save the full output to docs/sessionInfo.txt and reference it in the README. For Python, run:
python -VExpected output:
Python 3.11.45. Generate checksums for the raw files
A checksum is a short digital fingerprint computed from a file's contents. If the file changes by even one byte, the checksum changes, which lets anyone verify a download. On Linux:
md5sum data/raw/*.csv > checksums.md5
cat checksums.md5
Expected output (your hashes will differ):
9a1c8e47f0b6a2d4c1e9f708353b5d2f data/raw/plateA_2025-03-14.csvOn macOS, the equivalent one file command is md5 -q data/raw/plateA_2025-03-14.csv. After the dataset is downloaded, anyone can verify integrity with:
md5sum -c checksums.md5Expected output:
data/raw/plateA_2025-03-14.csv: OK6. Save with UTF-8 encoding
UTF-8 is the standard character encoding that preserves accented letters and symbols across systems. Nano writes UTF-8 by default. In Notepad, choose "UTF-8" in the encoding dropdown of the Save As dialog.
7. Check the final layout
The top level of the dataset should now contain README.md, the data folder, the analysis folder, the docs folder, and checksums.md5. Anyone opening the archive sees the README first.
8. Test the README on a colleague
Hand the folder to a labmate who did not work on the project and ask two things: what does the dataset contain, and can you rerun the analysis. Every question they ask you is a sentence missing from the README. Fix and repeat.
Common errors and exact fixes
bash: python: command not found: on many systems the command ispython3 -Vinstead ofpython -V.md5sum: plateA_2025-03-14.csv: FAILED open or read: the file was renamed, moved, or modified after the checksum list was created. Restore the file or regenerate the list withmd5sum data/raw/*.csv > checksums.md5.- Accented characters display as strings like
éon another computer: the file was saved in a legacy encoding. Resave as UTF-8. - A Markdown table shows as raw pipes with broken columns: a pipe character was dropped, or the viewer does not render Markdown. Repair the row, and keep a
.txtcopy for plain text readers.
Naming Files and Folders
Repository records across disciplines use the pattern "Research data supporting" followed by the article title, which ties the archive to the publication unambiguously. Inside the dataset, group files so the structure answers questions by itself. One crystallography dataset puts the data files for each figure in the folder for that figure, with details in the readme. A field study workflow organized raw files by campaign, school, and instrument before any processing began [4], which makes the provenance of every file obvious.
Practical rules:
- Use lowercase letters, digits, underscores, and hyphens in file names. Avoid spaces and special characters, which some repositories and scripts reject.
- Write dates as YYYY-MM-DD (the ISO 8601 standard) so names sort chronologically and 03/04 stops being ambiguous.
- Keep raw data in
data/rawand never edit it. All corrections happen in scripts that write todata/processed. - In the file inventory, describe naming patterns rather than listing hundreds of files one by one.
Documenting Processing Steps and Data Levels
Most datasets pass through several layers between machine output and final result. In toxicology, for example, a new approach method (NAM) typically involves multiple data layers from machine generated output to the final hit definition, with several processing steps between layers, and the processing pipeline is considered an essential part of the method description precisely because different processing of the same raw data can change the final outcome [3]. Your README should name each layer and state what happens between them.
Reporting research offers a ready structure. Guidance for accelerometer based studies groups reporting into four themes: data collection, data management and initial processing, deriving movement behaviors from the raw signal, and summary metrics [5]. The same review found that the translation of raw acceleration into behavior estimates is reported inconsistently across the field [5]. Those four themes map cleanly onto the Methods Summary and Processing Steps sections of any README, whatever the instrument.
Two details deserve explicit mention. First, time. A reproducible environmental workflow standardized timestamps, including daylight saving changes, before aligning sensor readings with reported activities [4]. State the time zone, and state whether clocks changed during data collection. Second, missing data. Curating electronic health record data with validated variable definitions produced processed data with lower missingness and better representation before modeling [6], which shows why the README should say how missing values arise and how they were handled.
Scale changes the writing style, not the content. When a research consortium phenotyped thousands of rats for addiction like behaviors and produced over 100,000 data files, the pipeline converted raw instrument output into structured tables and standardized experimental, behavioral, and metadata spreadsheets with automated quality control [7]. At that scale, the README describes the pipeline and points to its documentation rather than narrating every conversion. Large longitudinal resources face the same reality, which is why the Swiss HIV Cohort Study built its viral sequencing database explicitly to address reproducibility alongside storage and analysis of raw and processed data [8].
One more habit: if your field has a standard format, name it and its version instead of re-describing the structure. Medical imaging datasets, for instance, commonly use DICOM, a format whose complexity and patient specific workflow exceptions demand careful handling to preserve data fidelity [9].
A Reproducibility Checklist Before You Deposit
Run this reproducibility checklist against your dataset folder. Every unchecked box is a fixable gap.
- [ ] Every file in the deposit appears in the file inventory, directly or as a naming pattern
- [ ] Every column in every shared table has a dictionary entry with units
- [ ] Missing data codes are defined and used consistently
- [ ] Raw and processed data are separated and labeled
- [ ] Processing steps are listed in order, including exclusions and corrections
- [ ] Software names and exact versions are recorded (save
sessionInfo()orpip freezeoutput in docs) - [ ] Time zone and any clock changes are documented for time series data
- [ ] A license is chosen and stated
- [ ] A contact person with a durable email is named
- [ ] A citation statement is drafted, with the DOI to be added after deposit
- [ ] A colleague has followed the README cold, without asking you questions
Next steps after the checklist: deposit the dataset in a repository that assigns a DOI, paste the DOI into the Citation section, and reference the dataset in the data availability statement of the associated manuscript. These steps turn a well documented folder into genuinely reproducible research that others can find, cite, and reuse.
Common Mistakes and Limitations
- Writing the README last, from memory. Instrument settings, exclusion rules, and unit conventions vanish within weeks. Draft the README when data collection starts and update it at each milestone.
- Leaving template guidance text in the submitted file. Bracketed instructions left in a deposited README force every reader to guess which parts are content and which are scaffolding. Delete guidance as you fill each field.
- Omitting units and missing data codes. A column of numbers without units cannot be reused, and an undefined
-999can silently corrupt someone's summary statistics. - Describing only the processed data. Users need the raw layer to check the processing. Keep raw files untouched and say so explicitly.
- Omitting software versions. Analyses behave differently across package releases. Record exact versions, not just language names.
- Ambiguous dates and messy file names. Use YYYY-MM-DD and avoid spaces so names survive every operating system and script.
- No license or contact. Without a license, technically no one may reuse the data. Without a contact, questions go nowhere.
- Updating the data without updating the README. Bump the version and the update date whenever contents change, so users can detect stale copies.
A README also has limits. It complements, and does not replace, column headers embedded in each file, persistent identifiers, and the structured metadata fields your repository provides. Funder and journal requirements may add mandatory sections beyond this template, and domain standards such as DICOM in medical imaging bring their own documentation conventions [9], so always check the specific repository's submission guidance before deposit.
Frequently Asked Questions
What is a README file in a research dataset?
A README file is a plain text or Markdown document at the top level of a dataset folder that explains what the data are, how they were produced, how the files are organized, and how to reuse them.
Should I use README.txt or README.md for my dataset?
Use README.md if the dataset will appear on GitHub, GitLab, or a repository that renders Markdown, and README.txt if you want maximum compatibility with every editor and archive. Both are plain text, so either is safe.
What belongs in a README file template for research data?
The essential sections are creator and contact details, dates and version, a dataset overview, a file inventory, a variable dictionary with units and missing data codes, a methods summary, processing steps, software versions, a license, and a preferred citation.
How long should a dataset README be?
Most dataset READMEs run one to three pages. Cover every section the data require and skip padding, because a reader should find any fact in seconds.
Where should the README file sit in my folder structure?
Place it at the root of the dataset folder, next to the top level data directory, so anyone opening the archive sees it first. Some repositories also let you paste the README text into a description field.
Do I need a data dictionary if my CSV files already have header rows?
Yes. Header rows give column names, while a data dictionary in the README gives the meaning, units, allowed values, and missing data codes for every column.
How do I write a README for a dataset with hundreds of files?
Describe folders and naming patterns rather than listing every file, for example one inventory row per folder plus the naming rule, and provide checksums so users can verify their downloads.
When should I write the README?
Write the first draft when data collection starts and update it at each milestone. A README written from memory months later omits exactly the details that matter most.
Sources
- URGE: The easiest way to create a great ReadMe file for your dataset
- Best practices for data management and sharing in experimental biomedical research.
- The long way from raw data to NAM-based information: Overview on data layers and processing steps.
- A reproducible R workflow for harmonizing indoor air quality sensor data and cleaning activity logs in school-based field campaigns.
- Reporting of Accelerometry in Health Research: A Scoping Review of Current Guidance.
- A roadmap to artificial intelligence (AI): Methods for designing and building AI ready data to promote fairness.
- Automated pipeline for operant behavior phenotyping for high-throughput data management, processing, and visualization.
- Addressing data management and analysis challenges in viral genomics: The Swiss HIV cohort study viral next generation sequencing database.
- MedicalDataHandler, a research-oriented graphical user interface for DICOM data management.