How to Write a Reproducible Report with Quarto: A Template
By Dr. Zubair Khalid, DVM, MS, PhD ·

By the end of this guide you will have built a complete, renderable report that loads data, runs the analysis, writes every number into the text automatically, and regenerates itself with one command. You will also walk away with a reusable skeleton, a reproducibility checklist, and exact fixes for the errors that trip up most first attempts.
To follow along you need about 30 minutes and three things on your machine: the Quarto command line tool, a computing language (R 4.2 or later, or Python 3.10 or later with Jupyter), and an editor such as RStudio or VS Code. No prior Quarto experience is required.
Reproducible research means that the results of a study can be reproduced from the original data, and it serves as a core quality assurance step for any analysis [1]. In practice that requires three ingredients: the data, the code, and documentation sufficient to repeat the data handling, analysis, and modeling [1]. A Quarto report bundles all three in one file, which is why dynamic documents built with tools such as Jupyter notebooks, R Markdown, and Quarto have become the standard way to produce an accessible account of an analysis [1]. This guide walks through how to write a reproducible report with Quarto, then hands you a free template to adapt.
Why a Reproducible Report Beats a Word Document
The research pipeline from conception to publication has many cracks, and those cracks mean it may not be possible to repeat and verify published results [1]. The cracks are not hypothetical.
A cross-sectional meta-research study sampled 100 systematic reviews indexed in MEDLINE and examined 453 database searches. Only 22 searches, 4.9 percent, reported all six key items of the PRISMA-S reporting guideline (the standard that specifies what must be disclosed about database searches, such as the full strategy and the search dates). Only 10.4 percent of searches could be reproduced within 10 percent of the original result count, and exactly one review in the sample provided enough detail for every search to be fully reproduced [2].
Missing detail shows up outside search reporting too. A workshop convened by the NIH Office of Research Infrastructure Programs on zebrafish and other aquatic models concluded that variation in husbandry and environmental conditions is often underreported, which makes reporting and reproducibility difficult even for a well-studied laboratory organism [3].
Dynamic documents attack the problem at the analysis layer. They weave together the input code, the software-generated output (text, tables, and figures), and the author's explanatory text into a single narrative [1]. Publishing infrastructure is moving the same direction: a review of 11 systems for executable papers found that 10 of them accept Jupyter Notebook or R Markdown documents, and all provide features that help readers study the underlying materials [4]. Quarto extends the same idea across languages, so one workflow covers R, Python, and Julia projects.
What Quarto Is, in Plain Terms
Quarto is an open-source scientific publishing system. You write a plain-text file with the extension .qmd that mixes three ingredients: a YAML header (a small block of metadata at the top of the file, written in a simple configuration syntax), Markdown text (lightweight formatting such as headings and bullets), and code cells. When you render the file, Quarto executes the code, captures the output, and typesets everything into HTML, PDF, or Word processor formats [1].
The approach is called literate programming, the practice of writing the narrative and the code that produces the evidence in the same document so the two cannot drift apart [5]. It solves a failure mode every analyst knows: the numbers in the final text quietly stop matching the numbers in the analysis after a round of revisions.
Because Quarto is language-agnostic, the same document structure works whether your code cells are R (executed by the knitr engine) or Python (executed through Jupyter). That matters in mixed lab settings where one person analyzes in R and a collaborator prototypes in Python, and it is a reason new life science tools build their reporting on Quarto rather than on single-language predecessors [1].
What You Need Installed
Install the following, in this order:
- Quarto. Download the command line tool from the official site, quarto.org, and verify it from a terminal:
quarto --versionYou should see a version number of the form 1.5.55. Any current 1.x release works for this template.
- A compute engine. For R, install R from CRAN, then run
install.packages("rmarkdown")in the R console so Quarto can use the knitr engine. For Python, install Jupyter into the environment you actually use, for examplepip install jupyter.
- An editor. RStudio Desktop offers a built-in Quarto document wizard (File, then New File, then Quarto Document). VS Code works well with the official Quarto extension.
- A health check. Run:
quarto checkThe output confirms the Quarto version, detects your R or Python installation, and verifies the rendering engines. If any line ends in an error, fix that before continuing, because every later step depends on it.
The Template Format: Anatomy of a .qmd File
Every quarto reproducible report template follows the same format, and knowing the parts makes any template readable. A minimal document looks like this:
---
title: "My report"
format: html
---

## Background

Some narrative text.
#| label: demo 1 + 1
Three zones matter. The YAML header between the two triple-dashed lines controls metadata, output formats, execution defaults, and parameters. The Markdown text carries the narrative. The code cells, marked with triple backticks and an engine tag such as {r} or {python}, hold the analysis. Options for each cell are written on lines that start with #|, which keeps them inside the cell where copy and paste cannot lose them.
The table below summarizes the chunk options you will actually use.
| Option | What it controls | Sensible value in a report |
|---|---|---|
| , - | , - | , - |
| label | Unique cell name used in error messages and cross-references | One per cell, for example setup |
| echo | Whether the code appears in the output | true, so readers see the analysis |
| eval | Whether the code runs | true, except for helper notes |
| include | Whether the cell output appears in the document | false for housekeeping cells |
| warning, message | Whether warnings and package messages print | false in the final draft, true while debugging |
| error | Whether the document halts when code fails | false, so a broken pipeline fails loudly |
| fig-width, fig-height | Figure dimensions in inches | 5 by 4 for a single-panel plot |
| cache | Whether results are stored and reused between renders | false unless rendering is slow |
| fig-cap | Figure caption text | One short sentence stating the result |
Instead of setting these cell by cell, you can set document-wide defaults under the execute: key in the YAML header. Cells then inherit the defaults, and you override only where needed.
A Free Quarto Reproducible Report Template You Can Copy
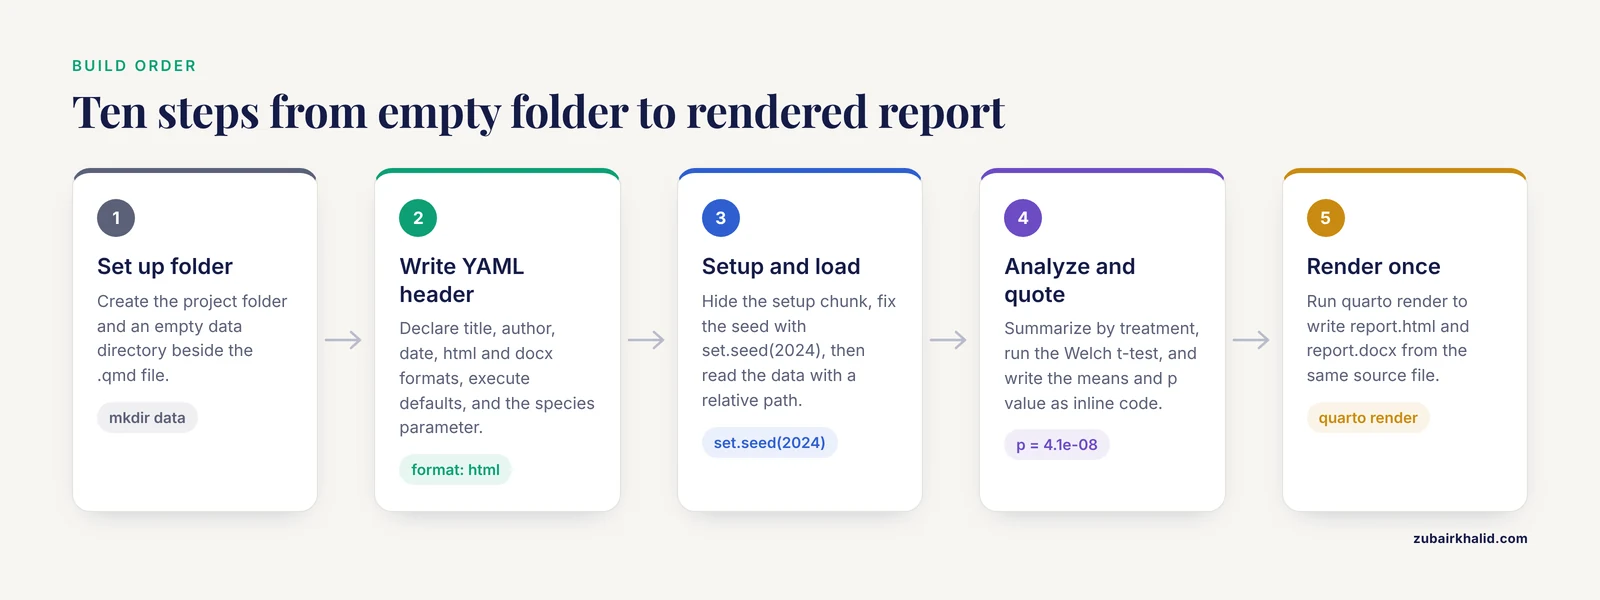
This walkthrough doubles as a quarto reproducible report template example. Follow the ten steps in order, and you will finish with a rendered HTML and Word report built from code.
Step 1: Set up the project folder
Open a terminal and run:
mkdir my-report
cd my-report
mkdir data
You now have a folder with an empty data directory, ready to hold raw files. Keeping raw data beside the report with relative paths is what lets the whole folder move between machines intact. Add a plain README.md later that tells a stranger how to render the project.
Step 2: Write the YAML header
Create a file named report.qmd and start it with this header:
---
title: "Fertilizer effects on seedling height"
subtitle: "A worked reproducible report"
author: "Your Name"
date: 2026-11-11
format:
  html:
    toc: true
  docx: default
execute:
  echo: true
  warning: false
  message: false
params:
  species: "Arabidopsis thaliana"
---
Each key does one job. title, author, and date feed the title block of every output format. format lists the outputs, here HTML with a table of contents and a default Word document. execute sets chunk defaults for the whole file. params declares values you can swap to reuse the same report for a different species, which turns one template into a small reporting system.
Step 3: Add a setup chunk
Below the header, add:
#| label: setup
#| include: false
library(ggplot2)
set.seed(2024)
set.seed(2024) fixes the starting point for random number generation, so any simulated or resampled values come out identical on every run. The include: false option keeps this housekeeping output out of the finished document.
Step 4: Load the data
In a real project, read your file with a relative path:
#| label: load-data
seedlings <- read.csv("data/seedlings.csv")
For this demo, generate deterministic data so the template runs with no downloads:
#| label: demo-data
seedlings <- data.frame(
  treatment = rep(c("control", "fertilizer"), each = 30),
  height_cm = c(rnorm(30, mean = 12.3, sd = 1.8),
                rnorm(30, mean = 15.1, sd = 2.0))
)
head(seedlings)
The output prints six rows shaped like this:
  treatment height_cm
1   control  11.73590
2   control  12.83613
3   control  12.91795
Exact values depend on your R build, but they will be identical on every rerun on the same machine because of the seed.
Step 5: Compute the summary statistics
#| label: summary
library(dplyr)
summary_table <- seedlings |>
  group_by(treatment) |>
  summarize(
    mean_height = mean(height_cm),
    sd_height   = sd(height_cm),
    n           = n()
  )
summary_table
Here dplyr is an R package for data manipulation, and the pipe operator |> passes the table on its left into the function on its right. The rendered output looks like this:
# A tibble: 2 × 4
  treatment  mean_height sd_height     n
  <chr>            <dbl>     <dbl> <int>
1 control           12.1      1.71    30
2 fertilizer        15.0      2.10    30
Step 6: Run the statistical test
#| label: test
welch <- t.test(height_cm ~ treatment, data = seedlings)
welch
This is a Welch two-sample t-test, which compares two group means without assuming equal variances. The document prints a result block of this shape:
        Welch Two Sample t-test

data:  height_cm by treatment
t = -6.4, df = 55.3, p-value = 4.1e-08
Step 7: Put live numbers into the text
First store the values you want to quote:
#| label: inline-values
m_ctl <- summary_table$mean_height[summary_table$treatment == "control"]
m_frt <- summary_table$mean_height[summary_table$treatment == "fertilizer"]
Then write a sentence that contains inline code: "Fertilizer-treated seedlings averaged ` r round(m_frt, 1) cm against r round(m_ctl, 1) cm for controls (Welch two-sample t-test, p = r signif(welch$p.value, 3) `)." When the file renders, Quarto evaluates the code between the backticks and prints the result. The sentence therefore cannot disagree with the analysis, which is the property that keeps a report honest through revision cycles.
Step 8: Add a figure with a caption
#| label: fig-heights
#| fig-cap: "Seedling height after four weeks under control and fertilizer treatments."
#| fig-width: 5
#| fig-height: 4
ggplot(seedlings, aes(x = treatment, y = height_cm, fill = treatment)) +
  geom_boxplot() +
  labs(x = "Treatment", y = "Height (cm)") +
  theme_classic() +
  theme(legend.position = "none")
The fig-cap option generates a numbered caption, and the label lets you cross-reference the figure in text with @fig-heights.
Step 9: Record the software environment
#| label: session
#| echo: false
sessionInfo()
sessionInfo() prints the R version, the operating system locale, and every attached package with its version number. For a Python document, write the equivalent pip freeze output into a requirements.txt file and commit it with the project. Either way, a reader learns exactly which software produced the results.
Step 10: Render
Run:
quarto renderConsole output similar to this appears:
Rendering report.qmd

processing file: report.qmd
  |.........  | 100%
output file: report.knit.md

pandoc report.knit.md -o report.html
Output created: report.html
Because the YAML header lists both html and docx, the same command also writes report.docx. Open report.html in a browser and confirm the table, the test output, the boxplot with its caption, and the sentence with live numbers are all present. That single command is the whole reproducibility promise: one action takes the project from raw data to finished document.
Parameters and Formats: Reusing the Template
A parameterized report is one source document that produces many outputs by swapping declared values. The species parameter in the header is available inside R code as params$species and inside Python code as params["species"], so you can title a figure or filter a dataset with it. To render a variant without editing the file, override the value on the command line:
quarto render report.qmd --execute-params species="Brassica rapa"Formats work the same declarative way. HTML suits internal sharing, Word suits journals that run Microsoft Word-based workflows, and PDF suits preprints. Erickson and colleagues published a Quarto template for the Journal of Fish and Wildlife Management and showed that the same template adapts to other Word-based journals and to products such as annual reports [6]. For PDF output, current Quarto renders through the typst engine by default, and a LaTeX toolchain such as TinyTeX covers journals that require it.
Common Errors and Their Exact Fixes
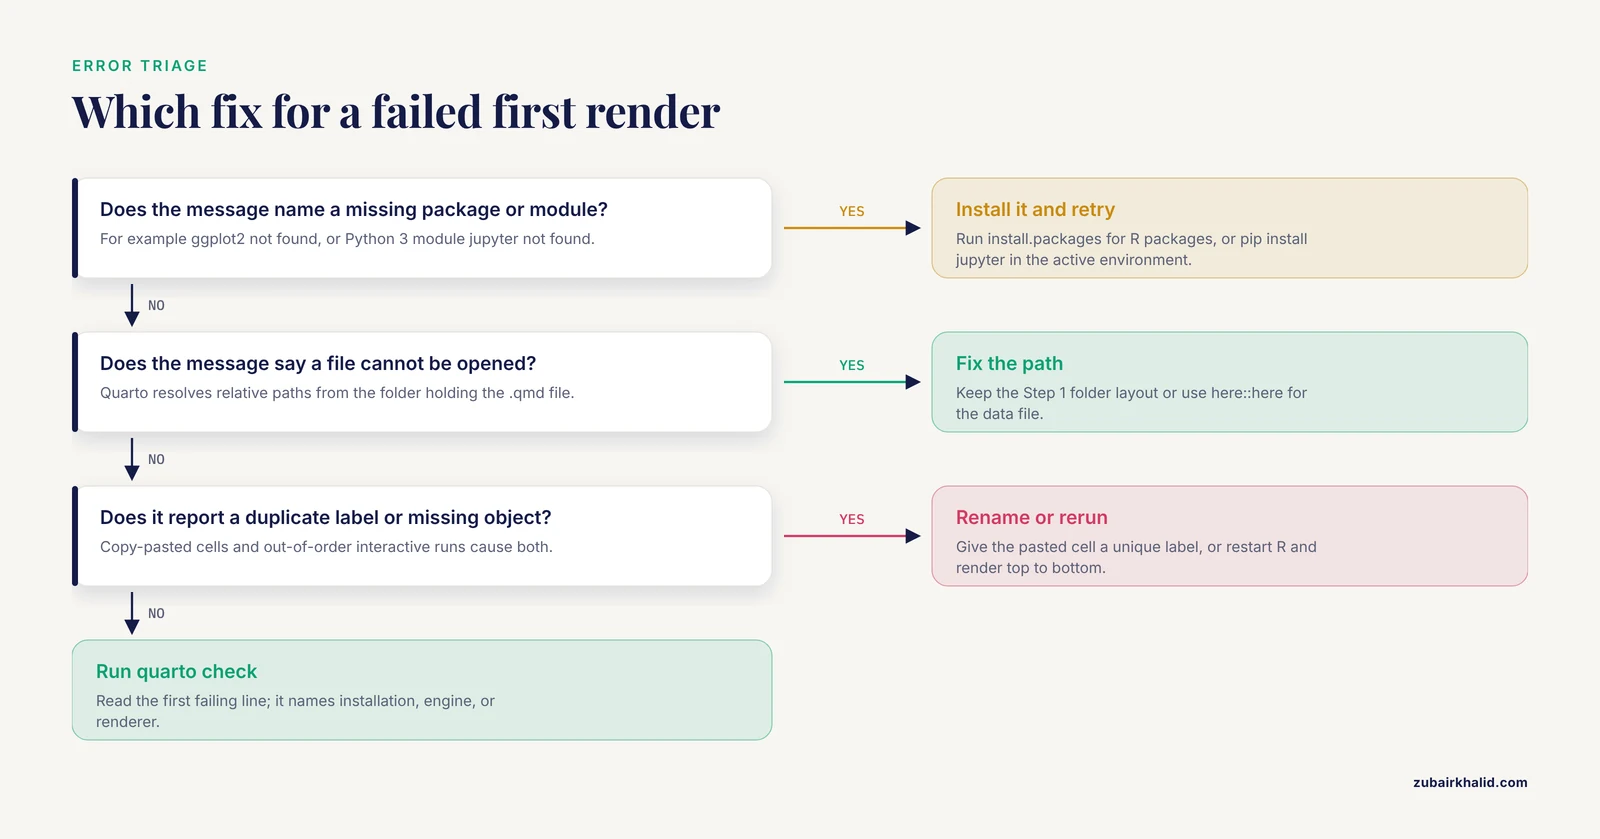
These five messages account for most failed first renders.
- Missing package. Message:
Error in library(ggplot2) : there is no package called 'ggplot2'. Fix: runinstall.packages("ggplot2")in the R console, then render again. Every package used in the document must be installed in the library that your R session uses.
- File not found. Message:
cannot open file 'data/seedlings.csv': No such file or directory. Cause: Quarto resolves relative paths from the folder containing the .qmd file, so the path breaks when the file sits elsewhere or the working folder moved. Fix: keep the folder structure from Step 1, or usehere::here("data", "seedlings.csv")from the here package, which locates the project root automatically.
- Python engine missing. Message from
quarto check:Python 3 module jupyter not found. Fix: activate the environment you intend to use, runpip install jupyterinside it, and runquarto checkagain to confirm the engine is detected.
- Duplicate label. Message:
Duplicate chunk label 'setup', which has been used for the chunk 'setup'. Fix: labels must be unique across the document. Copy-pasted cells are the usual culprit, so rename the label of the pasted cell.
- Object not found. Message:
object 'summary_table' not found. Cause: cells ran out of order during interactive editing, so a later cell referenced something an earlier cell had not yet created. Fix: restart the R session and run all cells top to bottom, or simply render, which always executes the document in order.
When diagnosis stalls, run quarto check and read the first failing line. It names the component (installation, engine, or renderer) that broke.
How to Check That Your Report Is Truly Reproducible
Passing these four tests separates a genuinely reproducible report from one that merely rendered once on your machine.
- The fresh-session test. Restart R (or open a fresh kernel), render, and confirm that no errors appear and the numbers match the previous run. Anything that depended on objects left in memory from earlier experimentation will surface here.
- The colleague test. Zip the project folder and ask someone to render it on their machine. Hardcoded paths, missing files, and undocumented package dependencies surface within minutes.
- The one-command rule. Everything from raw data to final figure should happen inside the render. If you resized an image by hand or pasted a number into the text, that step lives outside the pipeline and will be lost.
- The archive test. Push the folder to a public repository and mint a persistent identifier such as a Zenodo DOI, so the exact version you cite never moves. Depositing data, code, and documentation together follows the FAIR principles (Findable, Accessible, Interoperable, Reusable) that now guide research data and software practice [5].
For long analyses, Quarto offers freeze: true under execute, which stores cell results so later prose edits re-render without rerunning the code. Treat it as a convenience during writing, and do one full unfrozen render before submission.
A Reproducibility Checklist for Your Report
Run through this reproducibility checklist before you share anything:
- One command regenerates every number, table, and figure.
- All file paths are relative to the project folder.
- Every stochastic step has a fixed seed.
- No value in the text was typed by hand, all come from inline code.
- Warnings were reviewed, not just hidden.
- Software versions are recorded in the document or in a lockfile.
- Raw data are included or fetched by a script, and never modified in place.
- Parameters and their meanings are documented in the YAML header.
- Design, conduct, and analysis decisions are reported against the relevant community standard, with preregistration considered where the field supports it [7].
- Data, code, and documentation carry a license that permits reuse, and the released version is archived with a persistent identifier [5].
What Good Looks Like in the Life Sciences
The pattern is already standard practice across disciplines. DiaReport, an open-source R package for differential expression analysis in DIA-based proteomics, generates its interactive HTML reports through Quarto and ships multiple reporting templates plus configuration files to secure computational reproducibility across studies [8]. In fisheries and wildlife science, the published Quarto manuscript template demonstrates the journal-submission path end to end [6]. In metabolomics, the Metabonaut educational resource teaches script-based LC-MS/MS analysis through executable workflows built on literate programming, carrying FAIR practice from raw data through to the reported feature table [5].
Once your template renders cleanly, three next steps pay off quickly: put the folder under version control with git so every analysis change has a history, adapt the YAML header to a journal template rather than reformatting by hand, and publish the rendered HTML with quarto publish so collaborators can read it without installing anything.
Common Mistakes and Limitations
- Absolute paths. A path like
C:/Users/you/Desktop/project/data.csvdies on the next machine. Relative paths from the project root survive. - Hand-typed numbers. Any statistic pasted into prose will eventually disagree with the analysis. Use the inline code pattern from Step 7.
- Silenced warnings everywhere. Setting
warning: falseglobally hides real problems such as convergence failures. Debug with warnings visible, silence only for the final polish. - Stale caches. Leaving
cache: trueon after changing the data serves old results. Clear caches whenever inputs change. - Editing the rendered file. Changes made directly to the HTML or docx vanish on the next render. The .qmd source is the only place edits belong.
- Expecting the tool to fix the science. Quarto secures the computational layer, nothing more. Misuse of statistics remains a leading contributor to unreproducible findings, so design, randomization, and inference deserve the same rigor as the code [9]. Guidance on designing, conducting, and reporting experiments, including preregistration and open practices, applies no matter which tool writes the report [7].
- Assuming code replaces metadata. No template reminds you to record the biological context of an experiment, and gaps in exactly that kind of reporting are a documented weakness in organismal work [3].
- Machine learning blind spots. Validation procedure belongs in the report itself. A systematic evaluation of convolutional neural network studies for Alzheimer disease classification found that more than half of the surveyed papers may have suffered data leakage and reported biased performance, usually because selection and preprocessing steps went undocumented [10].
- Treating any checklist as final. Interventions meant to improve reproducible and replicable science are themselves being mapped for evidence through a registered scoping review, so expect best practice to keep evolving [11].
Frequently Asked Questions
Do I need to know R to use a Quarto reproducible report template?
No. Quarto executes R, Python, Julia, and Observable code cells within the same document format, so you can build the template in whichever language your lab already uses [1].
How is Quarto different from R Markdown?
Both produce dynamic documents that weave code, output, and narrative into one file [1]. Quarto is newer, works outside any single language ecosystem, and renders through its own engine rather than through an R package.
Can I submit a Quarto report to a journal that wants Word files?
Yes. Render to docx and attach a reference document to match the journal style. A published template demonstrates this workflow for a fish and wildlife management journal and adapts to other Word-based journals [6].
Where should data files live?
In a data folder beside the .qmd file, referenced with relative paths. Quarto resolves paths from the document location, which keeps the project portable between machines.
Why do my numbers change every time I render?
Some cell draws random values without a fixed seed. Call set.seed() with a constant in the setup chunk so every run starts from the same state.
Does a Quarto report make my study reproducible by itself?
No. It makes the computational layer reproducible. Experimental design, conduct, metadata, and reporting standards still decide whether others can repeat the work [7].
How do I share a finished report?
Run quarto publish to post the rendered HTML, and deposit the source folder with data and code in a public repository archived with a persistent identifier so readers can rerun the analysis [4].
Do I need extra software to render a PDF?
Yes. HTML and docx render without extra setup, while PDF requires the typst engine bundled with current Quarto or a LaTeX toolchain such as TinyTeX.
Sources
- Using dynamic documents to mend cracks in the reproducible research pipeline
- Systematic review search strategies are poorly described and not reproducible: a cross-sectional meta-research study
- Workshop Report: Zebrafish and Other Fish Models-Description of Extrinsic Environmental Factors for Rigorous Experiments and Reproducible Results
- Publishing computational research - a review of infrastructures for reproducible and transparent scholarly communication
- Metabonaut: an open educational resource for learning reproducible, script-based untargeted LC-MS/MS metabolomics.
- A reproducible manuscript workflow with a Quarto template
- Designing, conducting, and reporting reproducible animal experiments
- DiaReport: reproducible workflow for differential expression analysis and interactive reporting in DIA-based proteomics.
- Invited review: Reproducible research from noisy data: Revisiting key statistical principles for the animal sciences.
- Convolutional Neural Networks for Classification of Alzheimer's Disease: Overview and Reproducible Evaluation
- Scoping review and evidence mapping of interventions aimed at improving reproducible and replicable science: Protocol