Observational Study Design in Ecology
By Dr. Zubair Khalid, DVM, MS, PhD ·

An observational study measures plants, animals, or environments as they already are, while an experiment manipulates one factor and holds everything else constant. That single difference drives every design decision in field biology. The rule of thumb is simple. If you can realistically randomize, replicate, and control a manipulation at the scale your question demands, run an experiment. If manipulation is impossible, unethical, or would destroy the pattern you want to understand, choose an observational design and put your effort into sampling, standardization, and confounder control.
Ecology leans on observation more than most sciences. You cannot randomly assign continents to warming, rerun a species invasion from scratch, or ethically dose an endangered population with a pollutant. What you can do is choose among well-defined observational designs, each built to answer a different shape of question. This guide covers the main options in observational study design in ecology, compares them side by side, works through realistic scenarios, and lists the mistakes that most often sink field studies.
What an Observational Study Is (and Is Not)
An observational study is one in which the researcher measures exposure and outcome but does not assign either. Exposure arises on its own. A wetland is polluted or not, a forest is old growth or second growth, a population is infected or uninfected, and the researcher records what follows. The category spans everything from a one-morning vegetation survey to a fifty-year monitoring program.
Three points keep the definition honest. First, observational does not mean unplanned. A rigorous observational study pre-specifies its variables, sampling units, and protocols before anyone picks up a quadrat. Second, the contrast with experimentation is about assignment, not effort. A manipulative experiment assigns treatments at random, which is what licenses strong causal claims. Third, a natural experiment sits between the two. An event such as a flood, fire, or policy change manipulates the system, and the researcher supplies the experimental logic of controls and comparisons.
Ecology depends on observation because of scale, time, and ethics. Processes unfold across watersheds, decades, and whole life histories, and many systems are unique or protected. Observational designs trade some causal certainty for realism and reach. The strongest research programs use both modes, letting controlled experiments and naturalistic observation each answer the questions the other cannot [1].
Start With a Researchable Question
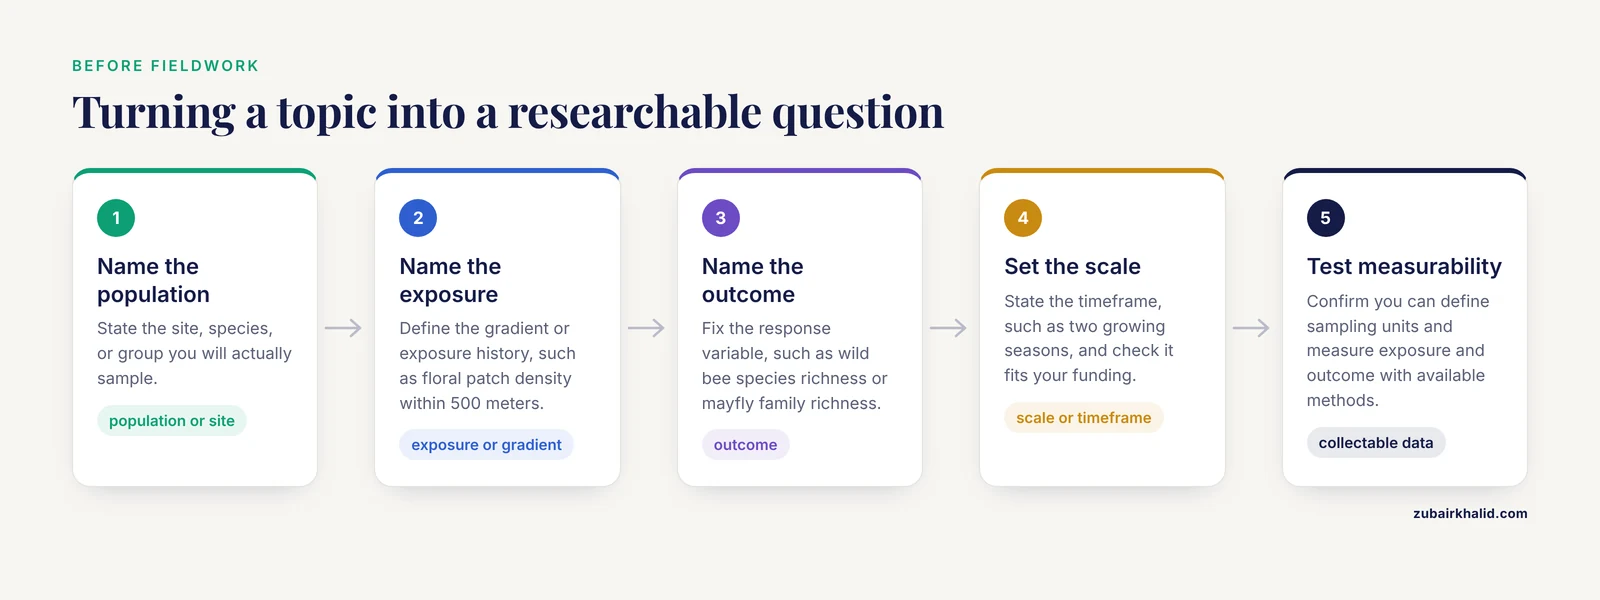
Learning how to write a research question is the highest-leverage skill in study design, because every later choice follows from it. A useful biology research question names four things: the population or site, the exposure or gradient, the outcome, and the scale or timeframe. Compare these pairs.
- Weak: What affects pollinators? Strong: Does floral patch density within 500 meters of field margins predict wild bee species richness in Mid-Atlantic grasslands across two growing seasons?
- Weak: Is the stream degraded? Strong: Does mayfly family richness differ between reaches upstream and downstream of the outfall, and does the difference grow with distance?
The strong versions can be answered with data you can actually collect, which is the final test of any research question. Ask whether you can define the sampling units, whether you can measure the exposure and the outcome with available methods, and whether the timeframe fits your funding or degree program.
Question shape points to design. A question about current status suggests a cross-sectional survey. A question about change suggests a longitudinal cohort. A question about a rare outcome suggests a case-control or test-negative approach. A question about an event that already happened suggests a natural experiment analyzed from records.
Whatever the shape, fix your variables before fieldwork. Many biomedical fields now standardize measured outcomes through formal consensus processes. A food allergy consortium recently used a two-round Delphi process with 778 participants from 52 countries to agree on 13 core outcomes for trials and observational studies [2]. The ecological equivalent is deciding your response variables, predictors, units, and quality-control rules on paper before the first transect is laid.
Observational Study Design Options in Ecology
The main observational study design options in ecology fall into eight families. The table compares them at a glance, and the sections that follow explain each on its own terms, with worked examples and the pros and cons that decide real choices.
| Design | Question shape | Time and cost | Main strength | Main weakness |
|---|---|---|---|---|
| Cross-sectional survey | Current status and gradients | Weeks to months, low | Fast, cheap, good for prevalence | No temporality, one season |
| Longitudinal cohort or panel | Change, trajectories, incidence | Years, high | Temporality, within-unit change | Attrition, cost, slow answers |
| Case-control | Rare outcomes and past exposure | Months, moderate | Efficient for rare outcomes | Selection and recall bias |
| Test-negative | Rare outcomes via routine sampling | Months, moderate | Cuts selection bias, uses existing programs | Needs strong routine data |
| Multicohort comparison | Groups with different exposure histories | Months to years, moderate to high | Built-in contrast | Cohorts differ in more than exposure |
| Natural experiment or BACI | Effects of events and policies | Event-dependent, moderate | Causal leverage at real scales | No control of timing, baseline gaps |
| Space-for-time substitution | Slow change compressed | Months, low to moderate | Decades in one season | Hidden site differences |
| Retrospective records analysis | Patterns in existing data | Months, low | Long series, large samples | Inherited definitions and gaps |
Cross-Sectional Surveys
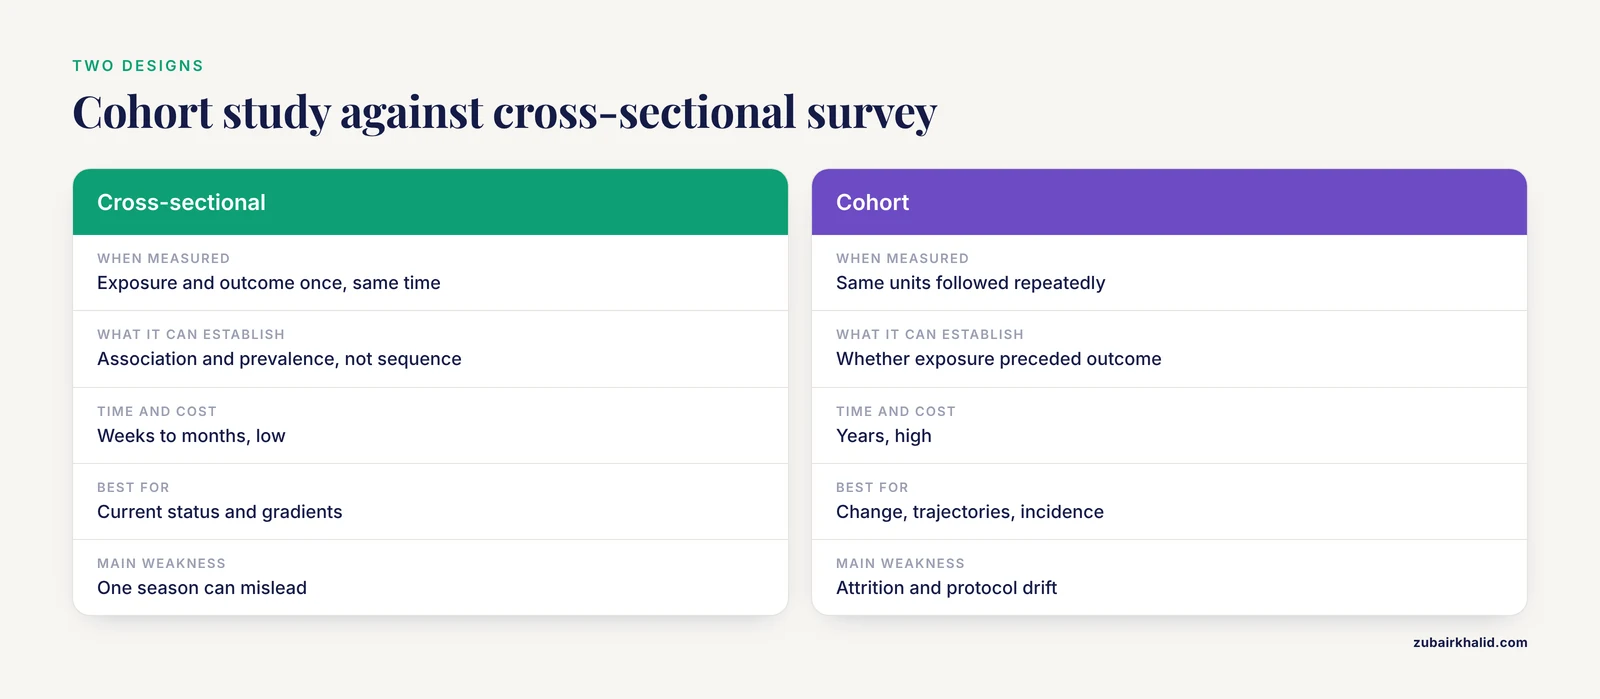
A cross-sectional survey measures exposure and outcome at the same time, once. It is the workhorse of field ecology. Vegetation transects, breeding bird point counts, benthic macroinvertebrate kicks, and soil core surveys are all cross-sectional designs.
A field parasitology study shows the template at full rigor. Researchers ran a cross-sectional survey of 49 households in rural Kenya and Uganda, collected 238 soil samples from indoor and outdoor living spaces, and used a low-cost Berlese-Tullgren funnel method, calibrated for bulb wattage and extraction time, to extract off-host stages of the sand flea Tunga penetrans. Generalized models then tested associations between environmental factors, household infection status, and the presence and abundance of flea stages in soil [3]. Small studies benefit from the same discipline. An occupational health survey in Surabaya sampled 30 workers using random sampling, explicit inclusion and exclusion criteria, and pre-specified variables analyzed with Pearson correlation [4].
Pros: fast, inexpensive, ideal for prevalence, gradients, and hypothesis generation. Cons: no information on whether exposure preceded outcome, a single season can mislead, and site differences beyond the exposure of interest can masquerade as effects.
Longitudinal Cohorts and Panel Studies
A longitudinal study follows the same units repeatedly through time. Two versions matter. A fixed panel revisits the same plots, nests, or individuals. An open cohort lets units enter and leave, which suits populations with recruitment, death, and dispersal.
The Dog Aging Project is the clearest recent template. It is a prospective, long-term, longitudinal, open cohort study begun in 2019 to investigate biological and environmental determinants of healthy aging. As of December 31, 2024, it had enrolled 50,188 companion dogs across all 50 US states and the District of Columbia, more than half had follow-up data spanning up to five years, and 14,978 deaths had been documented, with owners volunteering data through a community science model and datasets shared openly with the research community [5]. Every lesson transfers to field ecology: pre-specified repeated measures, an explicit retention plan, and open data that multiply the value of hard-won fieldwork.
Longitudinal data also support trajectory and mechanism modeling. A prospective study of 218 older cardiac patients used a latent growth mixture model to identify three frailty trajectories and then regressed trajectory membership on predictors, reporting to the STROBE checklist [6]. In immunology, 47 years of antibody titers against 21 influenza A(H3N2) strains, analyzed with Fourier spectrum methods, revealed a roughly 24-year cycle in individual responses, with simulations pointing to cross-reaction between antigenically similar strains as the likely driver [7].
Pros: establishes temporality, captures trajectories and incidence, supports within-unit comparisons. Cons: expensive, slow, vulnerable to attrition and protocol drift.
Case-Control and Test-Negative Designs
A case-control design starts from the outcome. You find units with the outcome (cases) and comparable units without it (controls), then reconstruct past exposures. It is the efficient choice when the outcome is rare, such as a disease outbreak at a handful of ponds or nest predation affecting a small fraction of monitored nests.
The test-negative design is a case-control variant built on routine sampling. You enroll only individuals already collected through an ongoing program, such as a trapping network, a clinic, or a monitoring scheme, and compare those that test positive against those that test negative. Because every subject entered through the same channel, selection differences shrink. Vaccine researchers highlight test-negative designs, alongside cohort studies framed as target trial emulation, as promising tools for estimating real-world malaria vaccine effectiveness, provided accurate individual-level records exist [8].
Pros: fast and efficient for rare outcomes, leverages existing surveillance. Cons: controls must come from the same sampling universe, past exposures are measured with error, and the design cannot estimate prevalence.
Multicohort Comparisons Along Gradients
A multicohort study defines several cohorts by exposure history and samples and analyzes them identically. A recent immunology example recruited four groups across the USA, Brazil, and Portugal, people vaccinated 40 to 80 years ago with a first-generation smallpox vaccine, people vaccinated within the past year, people who received both, and patients recovering from mpox, then ran the same assays on 378 samples from 262 participants recruited between July 2022 and August 2023 to compare the magnitude, longevity, and breadth of immune responses [9].
The ecological analog is comparing populations that differ in exposure history: herds with different parasite management histories, forests with different fire return intervals, streams along an urbanization gradient. Pros: the contrast is built into the design, and cohort-level replication strengthens inference. Cons: cohorts can differ in age, genetics, or history as well as exposure, so measure candidate confounders or match cohorts on them.
Natural Experiments and Before-After-Control-Impact Designs
A natural experiment exploits an event you did not cause, a flood, a spill, a fire, a dam removal, a policy change, as if it were a treatment. The before-after-control-impact (BACI) design is the standard template: measure impact and control sites before and after the event, then estimate the difference in differences.
Careful stratified observation can also map heterogeneity well enough to steer management. In western Kenya, researchers sampled 108 randomly selected clusters spanning irrigated farming, seasonal flooding, lowland dryland farming, and highland landscapes, measured clinical malaria incidence, asymptomatic infection, and vector abundance, and classified the region into four eco-epidemiological zones with distinct hot spots, cold spots, and vector species compositions, precisely so interventions could be adapted zone by zone [10].
Pros: causal leverage at real-world scales, ethical by construction, often the only option for large disturbances. Cons: you do not choose the timing, baseline data may be thin, and control sites must be genuinely comparable.
Space-for-Time Substitution
Space-for-time substitution replaces time with space. Instead of watching a forest grow old for 150 years, you sample stands of known age since disturbance and read the chronosequence as a trajectory. The approach compresses decades into one field season, which is why it remains popular for succession, soil development, and glacial retreat.
Its weakness is a strong assumption: that sites differing in age differ only in age. Soil legacies, historical land use, and dispersal differences violate that assumption quietly. Protect yourself by matching sites on elevation, soils, and land-use history, replicating the chronosequence across landscapes, and pairing it with whatever true long-term records exist. Pros: cheap and fast access to slow processes. Cons: hidden site differences can produce convincing but wrong trajectories.
Retrospective Studies From Existing Records
A retrospective design analyzes data collected for other purposes: monitoring programs, museum specimens, telemetry archives, or administrative records. Two recent studies show the range.
A perinatal study drew 29,408 singleton livebirths from electronic health records in Northern California between 2008 and 2013, grouped gestational weight gain into meaningful categories with adequate gain as the reference, and used modified Poisson regression stratified by obesity class, finding, for example, a risk ratio of 1.57 (95% CI 1.12 to 2.19) for small-for-gestational-age birth with weight loss in obesity class I [11]. The transferable lesson is how to handle exposure: categorize it meaningfully, state the reference, and stratify.
At the other end of the data-volume scale, a retrospective analysis of 1.44 billion deidentified mobility records from two 46-day periods in 2019 and 2020 built grid-level transition matrices and used spectral clustering to ask whether a city-boundary or fixed-radius rule better matched observed movement patterns [12]. A pure design question, which classification rule fits reality, was answered entirely from existing data.
Pros: long time series, large samples, low field cost. Cons: variables were not designed for your question, gaps and detection bias are common, and you inherit someone else's definitions.
Community Science and Participatory Designs
Community science (also called citizen science) enlists volunteers to collect data, and participatory designs go further by involving stakeholders in shaping the study itself. The Dog Aging Project runs on community science, with owners volunteering detailed longitudinal information about their dogs [5]. In clinical research, involving affected people as partners across the research cycle, from priority setting through design, delivery, and dissemination, is recognized as a marker of quality that improves relevance and feasibility [13].
Ecology has deep traditions here: breeding bird surveys, phenology networks, camera-trap grids maintained by landowners, and harvest reporting by hunters. Pros: spatial scale and local knowledge no single lab can match, plus community buy-in that sustains long monitoring. Cons: observer variability, uneven protocol adherence, and the need for training, validation, and data standards. Build verification subsamples into the design from the start.
Choosing Your Observational Study Design in Ecology: The Criteria That Decide
When two designs both look plausible, seven criteria break the tie.
- Temporality. If the question needs direction of cause, choose a longitudinal cohort, a BACI design, or a natural experiment. If a snapshot answers it, a cross-sectional survey is cheaper and faster.
- Outcome rarity. Rare outcomes starve cohort designs. Case-control and test-negative designs concentrate effort where the outcome actually occurs [8].
- Unit mobility. Sessile units suit fixed plots. Mobile animals push you toward capture-recapture, telemetry, or community reporting.
- Baseline availability. If an event already happened and no baseline exists, retrospective records may be the only route.
- Time and budget. Space-for-time substitution trades realism for speed, and that trade is sometimes correct.
- Confounding control. Handle confounding at the design stage, through stratification, matching, and control sites, before resorting to statistical adjustment. The Kenya malaria study stratified clusters by landscape setting and altitude for exactly this reason [10].
- Analysis-design match. The analysis must mirror the data structure. When the same questions are posed to multiple sources, the resulting observations are paired, and treating them as independent with procedures such as unpaired t-tests or the Kruskal-Wallis test reduces statistical power and distorts the type I error rate [14]. The ecological version is common: the same transect measured every year is a repeated measure, not fresh independent data.
Worked Scenarios
Scenario 1: A Fungicide Gradient and Amphibian Decline
Question: does fungicide concentration in pond sediments predict larval amphibian abundance and deformity rate? You cannot dose 40 ponds experimentally. Design: a stratified cross-sectional survey across a measured concentration gradient, with standardized dipnet transects and sediment cores, analyzed with generalized models that include land use, hydroperiod, and canopy cover as covariates. This mirrors the published soil survey that linked environmental factors to parasite stages across 238 samples using generalized models [3]. If a second field season is possible, convert it to a panel and you gain temporality.
Scenario 2: An Outbreak in a Hunted Deer Population
Question: which factors distinguish deer infected with a novel pathogen? Infection is rare, so a cohort would need thousands of animals. Design: a test-negative analysis inside the existing hunter-harvest surveillance program, comparing infected and uninfected animals sampled through the same channel, the same logic that makes test-negative designs attractive for real-world effectiveness questions [8].
Scenario 3: A Dam Removal
Question: does dam removal change fish community structure? Design: BACI. Electrofish impacted and control reaches for two years before removal and three years after, then estimate the difference in differences. The removal is the experiment, and your design supplies the controls.
Scenario 4: Post-Fire Succession Over 150 Years
Question: how does plant community composition change across a century and a half after fire? No living researcher can wait. Design: a space-for-time chronosequence of burns of known age, matched on elevation, soils, and pre-fire vegetation cover, replicated across at least two landscapes, supplemented with any long-term monitoring records that already exist.
The Pros and Cons of Going Observational
Weighing observational study design pros and cons at the level of the whole approach:
Strengths. Realism, because systems are measured under real conditions rather than in enclosures. Scale, because observation reaches watersheds, regions, and decades. Feasibility and ethics, because nothing is manipulated. Opportunity, because natural experiments and existing records turn events you did not plan into evidence.
Weaknesses. Confounding is the constant threat, because exposure was not assigned at random. Causal claims require triangulation across designs, demonstrated temporality, and mechanism. Bias channels, including selection, detection, and measurement bias, must be closed by design rather than by analysis. Analysis is also more demanding, because clustered, repeated, and matched data structures must be modeled as such [14].
The tradeoff is not observational versus experimental in the abstract. Controlled manipulations maximize internal validity, while naturalistic observation maximizes real-world relevance, and each answers questions the other cannot [1]. Methodologists add that quality comes from coherence, keeping question, design, methods, analysis, and inference aligned, rather than from integration alone [15]. Strong programs in ecology run both modes and let each design test the limits of the other.
Common Mistakes and Limitations
- Treating repeated measures as independent. The same site measured across years, or matched pairs of plots, are paired data. Analyzing them with independent-sample tests reduces power and inflates false positives [14].
- Pseudoreplication. Ten soil cores from one pond are subsamples, not ten independent ponds. The pond is the replicate. This distinction, a standard concept in field study design since Hurlbert's classic critique, remains one of the most common flaws in submitted manuscripts.
- Confounding by habitat or history. Sites differ in many ways at once. Measure candidate confounders, stratify or match at the design stage, and reserve statistical adjustment for what remains.
- Ignoring imperfect detection. You never detect every individual. Occupancy and distance-sampling methods exist for this reason and should be planned, not patched in later.
- Convenience sampling. Even a 30-person study can specify eligibility criteria and draw a random sample [4]. Do the same with sites, and write the rules down before the first visit.
- Deciding variables after data collection. Pre-specify response variables, predictors, and quality-control rules. Core outcome initiatives exist because inconsistent measures make studies impossible to compare [2].
- Uncalibrated methods. Pilot your protocol and define standard operating conditions before the field season. The sand flea soil study calibrated bulb wattage and extraction time until the method consistently recovered 75% (95% CI 63 to 85%) of off-host stages, then froze those conditions [3].
- Ignoring attrition. Longitudinal studies lose units. The Dog Aging Project kept more than half of 50,188 dogs under follow-up for up to five years, which required active retention work [5]. Budget sites and animals for the loss you expect.
- Overclaiming causation. Say "associated with" unless you have temporality, confounder control, and replication. Support causal readings with triangulation, natural experiments, or mechanism models built on the observational data [7].
- Designing the analysis last. Write the analysis plan alongside the sampling plan. A mismatch between how data are structured and how they are tested is a design failure, not a statistics failure [14].
For a specific project, bring a statistician in at the design stage, not after the data are collected. Individual sites and populations throw surprises that no design table anticipates, and local expert judgment is part of the method.
Frequently Asked Questions
What is an observational study in ecology?
A study in which the researcher measures exposure and outcome without assigning or manipulating either. Populations, plots, or environments are observed as they are, and design effort goes into sampling, standardization, and controlling confounding rather than into controlling treatments.
Which observational design is best for ecology?
There is no single best design. Longitudinal cohorts give the strongest evidence about change and cause, cross-sectional surveys win for prevalence and gradients, and case-control or test-negative designs win for rare outcomes. The best observational study design in ecology is the one that matches your question, timeframe, and budget.
How is a cohort study different from a cross-sectional survey?
A cohort follows the same units over time and can establish whether exposure preceded outcome. A cross-sectional survey measures everything once and can establish association and prevalence but not sequence.
Can observational studies show causation?
They can support causal conclusions when they establish temporality, control confounding through design and analysis, and replicate across settings, but a randomized experiment remains the stronger test. Natural experiments with true controls come closest to experimental certainty.
How many sites or samples do I need?
Enough to detect the smallest effect that would matter biologically, which depends on effect size, variability, and design. Run a power analysis or simulation before fieldwork, and build in extra sites for attrition and failed samples.
How do I write a good biology research question?
Name the population or site, the exposure or gradient, the outcome, and the scale or timeframe, then confirm you can measure all four with available methods. A question that cannot be answered with collectable data is a topic, not yet a question.
Sources
- Controlling the uncontrollable? navigating naturalistic and controlled dosing in cannabis research.
- Core Outcome Set for IgE-mediated food allergy clinical trials and observational studies of interventions: International Delphi consensus study 'COMFA'.
- Identification of tungiasis infection hotspots with a low-cost, high-throughput method for extracting Tunga penetrans (Siphonaptera) off-host stages from soil samples-An observational study.
- Relationship between benzene concentration, MDA levels and kidney function in car painting workshops in Surabaya: A cross-sectional observational study.
- Study design and rationale for the Dog Aging Project Pack: a prospective, long-term, longitudinal, observational study of biological and environmental determinants of healthy aging in US companion dogs.
- Frailty Trajectories and Determinants in Older Adults After PCI: A Longitudinal Study.
- Long term intrinsic cycling in human life course antibody responses to influenza A(H3N2): an observational and modeling study.
- Need for Real-World Evaluation of Malaria Vaccines and Reliable Vaccination Records in Africa.
- The impact of orthopoxvirus vaccination and Mpox infection on cross-protective immunity: a multicohort observational study.
- Malaria transmission heterogeneity in different eco-epidemiological areas of western Kenya: a region-wide observational and risk classification study for adaptive intervention planning.
- Weight Loss, Stability, and Low Weight Gain during Pregnancy among Individuals with Obesity: Associations with Adverse Perinatal Outcomes: An Observational Study.
- Evaluating City-Cut Geographic Risk Classification for a Pandemic Travel-Record System in Shanghai, China: Retrospective Observational Analysis.
- Supporting meaningful contributions of people affected by Parkinson's throughout the research process: Key considerations for inclusive patient and public involvement across the globe.
- Statistical Pitfalls in Large Language Model Evaluation: A Practical Guide to Study Design and Analysis.
- Beyond integration: a coherence and transparency framework for mixed methods research in the era of generative AI.