How to Measure the Reuse of Your Dataset
By Dr. Zubair Khalid, DVM, MS, PhD ·

You published the dataset, minted a DOI, and the download counter is climbing. None of that tells you whether anyone actually analyzed your data. This guide shows you how to measure the reuse of your dataset with methods that survive scrutiny from a funder, a journal, or a promotion committee.
By the end of this article you will be able to compute a reuse rate for your own deposit, pull repository statistics with a short script, run forward citation searches across three databases, classify every secondary publication as internal or external reuse, and log all of it over time. On hand you need your dataset DOI or accession number, Python 3 with the requests library, a spreadsheet, and, if possible, library access to Web of Science or Scopus. Google Scholar and Europe PMC are free alternatives that cover most of the same ground.
Funder policies on research data sharing increasingly ask whether anyone used the data, not whether you merely deposited it. Measuring reuse turns a deposit from a compliance chore into evidence of impact.
What Counts as Dataset Reuse
Dataset reuse means a person or team loads your data and produces an analysis, model, or publication that your original study did not plan. Three tiers of evidence separate attention from use.
- Attention. Views and downloads show that people found the deposit.
- Attribution. Citations to the dataset DOI show that authors acknowledged it.
- Use. Secondary publications, models, or reanalyses show that the data shaped new work.
Only the third tier is reuse in a strict sense, and that is the tier funders ask about by name.
The cleanest published template comes from a cross sectional study of clinical trials that shared individual participant level data (IPD, meaning de-identified data at the level of each enrolled participant) through the Yale University Open Data Access (YODA) Project platform. The investigators defined reuse as secondary publications, meaning full papers that analyzed the shared IPD rather than the original trial report, and they located each one through citation searches of the primary publications [1]. Their workflow, adapted below, is the backbone of any serious reuse measurement.
One caveat before you start counting. Some reuse never appears in public metrics. Federated frameworks let models train across decentralized clinical repositories while only aggregated local statistics move between sites, so no download occurs and no file transfer is logged [2]. If your community uses such approaches, public counters will undercount reuse by design.
Make Your Dataset Traceable Before You Measure
Reuse you cannot attribute is reuse you cannot count. Three practices make every later measurement easier.
Mint persistent identifiers and freeze versions. A dataset DOI points to one version, so give each release its own version DOI and keep a content fingerprint so anyone can verify which bytes they analyzed. A data-governance workflow built for tuberculosis chest radiographs sealed every data layer with SHA-256 hashes and ran three parallel hashes (MD5, pHash, and dHash) to catch duplicates at both the file and content level [3]. You can produce the same fingerprint in one line:
sha256sum cohort_v2.parquet
# a3f1c9e5... (64 hexadecimal characters)
Publish machine-actionable metadata. A multi-site rat brain MRI dataset was released in the FAIR² framework with machine-actionable metadata, responsible AI indicators, and structured documentation that names its intended reuse scenarios, including testing harmonization methods and training machine learning models [4]. Metadata that states intended reuse gives you a checklist for screening later hits.
Say what reuse should look like. Dataset descriptors that list potential applications make screening far easier. A mobile air quality dataset collected by a vehicle fleet in Benevento, Italy names benchmarking interpolation algorithms and validating mobile sensing strategies among its intended uses [5]. A quantitative sensory testing dataset ships both raw and transformed formats, with key pain data arranged as a 127 by 23 matrix, so reusers on different platforms can work from the same structure [6].
Measure Dataset Reuse Step by Step
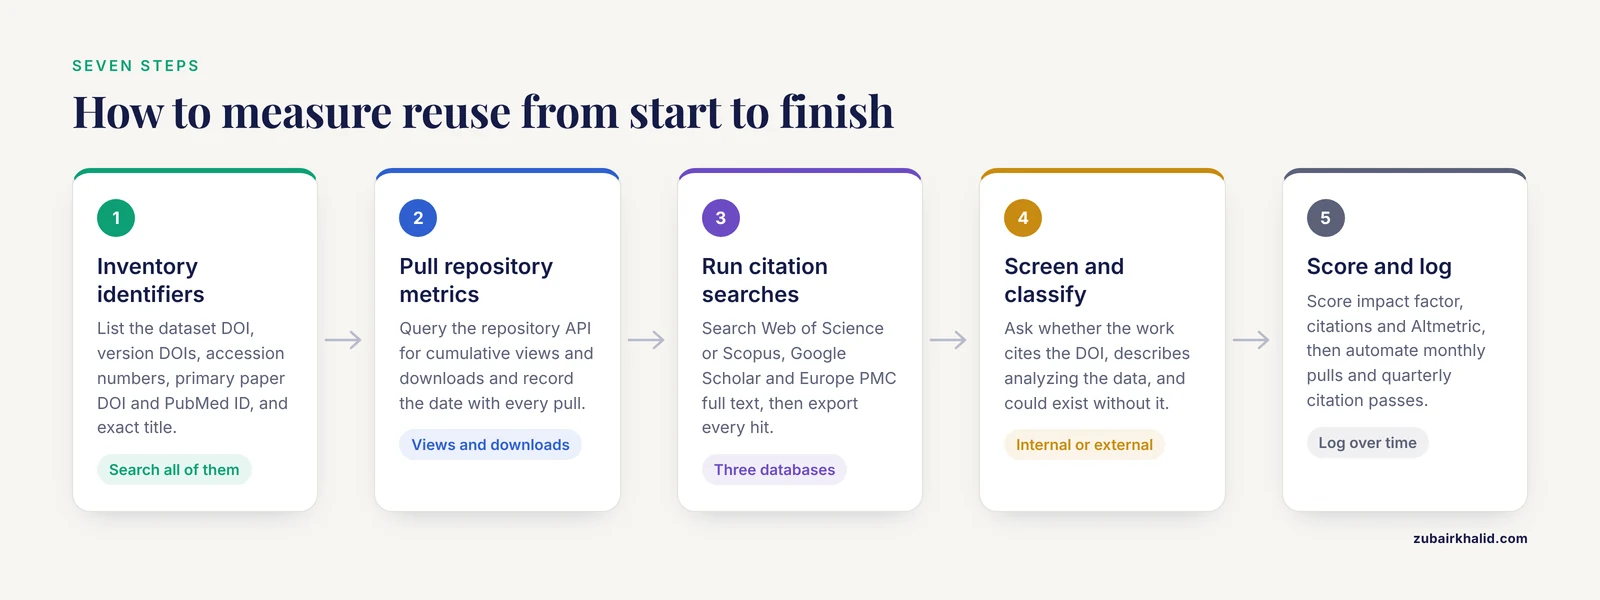
The walkthrough below assumes an open deposit with a DOI. Adapt the tools if your data sit in a controlled-access platform, which Step 6 covers.
Step 1. Inventory Your Identifiers
Open a spreadsheet and list every string a reuser might cite:
- The dataset DOI and each version DOI
- Accession numbers or identifiers issued by a domain archive
- The DOI and PubMed ID of the primary paper
- The exact dataset title as it appears in the deposit
You will search for all of these, because reusers cite inconsistently.
Step 2. Pull Repository Metrics Through the API
Most repositories expose cumulative views and downloads through a public API. For a Zenodo deposit:
import requests

doi = "10.5281/zenodo.XXXXXXX"  # replace with your DOI
r = requests.get(
    "https://zenodo.org/api/records",
    params={"q": f'doi:"{doi}"'},
)
rec = r.json()["hits"]["hits"]
print(rec["metadata"]["title"])
print("views:", rec["stats"]["views"])
print("downloads:", rec["stats"]["downloads"])
Expected output, with your own values:
My example dataset, version 2
views: 1240
downloads: 356
Figshare and Dryad offer similar endpoints, and every repository's statistics page shows the same numbers in a browser. Record the date with every pull, because these counters are cumulative and a single snapshot carries no trend information. If your repository issues a concept DOI that groups all versions, log it too so version-level and dataset-level counts stay distinct.
Step 3. Run Forward Citation Searches
A forward citation search starts from your published output and finds later works that cite it, rather than searching keywords. A meta-research protocol assessing the GRIPP2 reporting guidelines uses exactly this design, searching Web of Science, Scopus, and Google Scholar and applying structured de-duplication so each citing article counts once [7]. The same design transfers directly to datasets.
Run these searches and export every result into your spreadsheet:
- Web of Science or Scopus cited reference search on your primary paper.
- Google Scholar exact phrase search for the DOI in quotes, then repeat with your accession number and dataset title.
- Europe PMC full text search, which covers the full text of open access articles and catches DOIs sitting in reference lists and data availability statements:
import requests

doi = "10.5281/zenodo.XXXXXXX"
r = requests.get(
    "https://www.ebi.ac.uk/europepmc/webservices/rest/search",
    params={"query": f'"{doi}"', "format": "json"},
)
print("hits:", r.json()["hitCount"])
Expected output:
hits: 7A hit count of 7 means seven records contain that DOI string somewhere. Each one needs screening, which is the next step.
Step 4. Screen Every Hit and Classify the Reuse
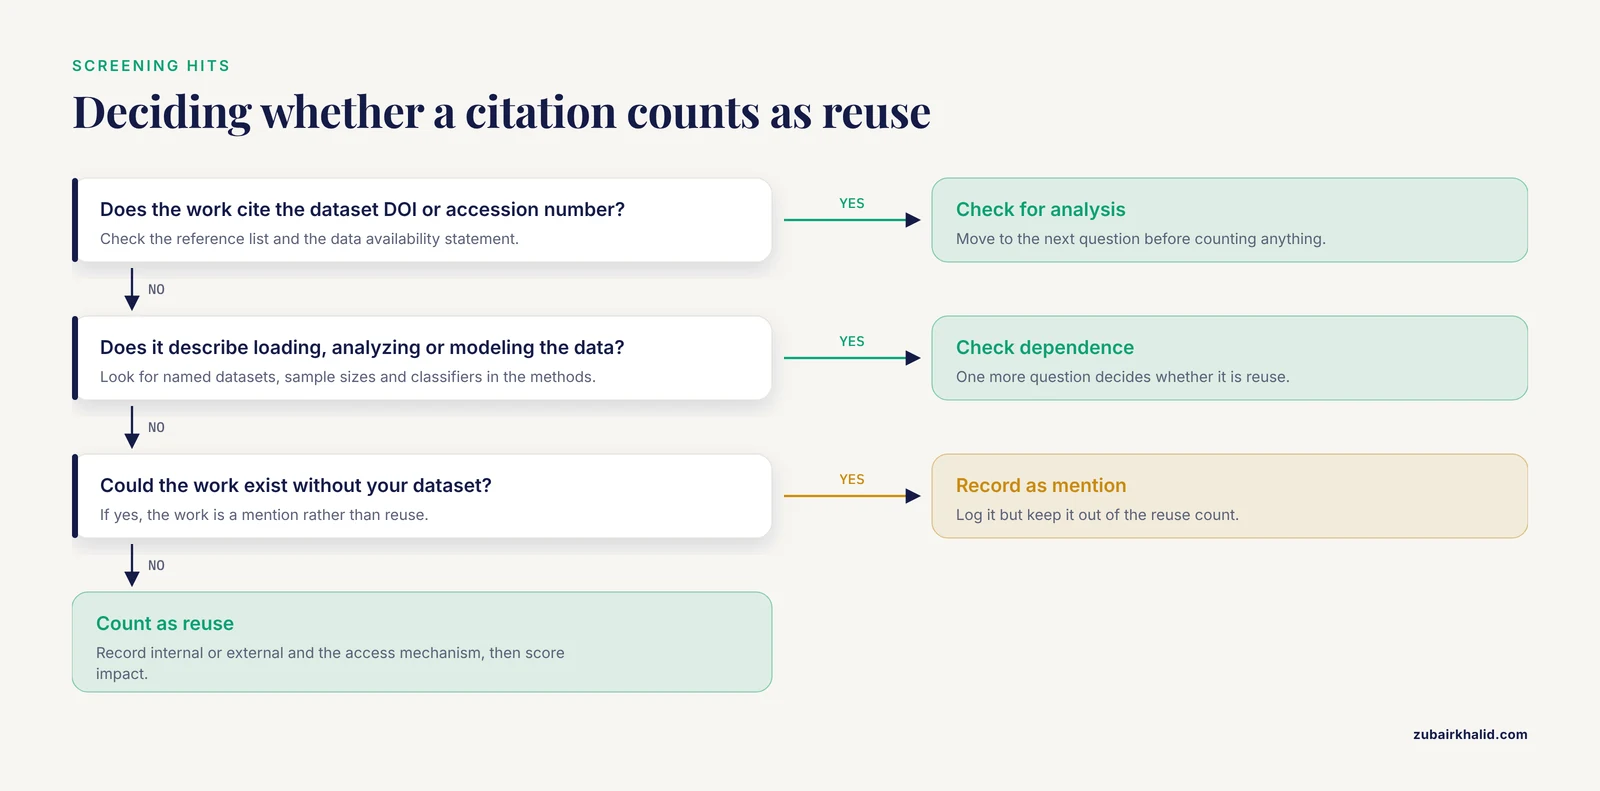
A citation is not automatically reuse. For each hit, ask three questions:
- Does the work cite the dataset DOI or accession number?
- Does it describe loading, analyzing, or modeling the data?
- Could the work exist without your dataset?
Hits that fail question 2 are mentions, not reuse. A clean positive hit reads like a benchmarking paper that reports eight data augmentation strategies evaluated on three named public datasets, with sample sizes and classifiers listed for each [8]. A methods section written that way is a reuse record you can count without ambiguity.
For genuine reuse, record two classifications. First, internal versus external: the YODA portfolio study classified a secondary publication as internal when at least one original trial investigator was an author, and external otherwise [1]. Second, access mechanism: how the team obtained the data, whether through a sharing platform, a direct request, or an informal transfer [1]. Both fields become the backbone of your reuse report.
Step 5. Score the Impact of Each Reuse
A raw reuse count says little on its own. The YODA study scored every secondary publication on journal impact factor, annual citation count, and annual Altmetric Attention Score, and also coded the research objective and analysis type of each paper [1]. Altmetrics are attention measures drawn from news, policy documents, and social media, so they complement citations rather than replace them. Adding objective and analysis type tells a funder whether reusers asked questions adjacent to your original study or opened entirely new ones.
Step 6. Capture Reuse in Controlled and Secure Settings
Open metrics miss a large share of research data sharing. For controlled-access data, count approved data use requests, approved projects, and outputs produced inside the platform. The YODA platform works this way, and most external teams that reported an access mechanism obtained the data through data sharing platforms rather than informal requests [1]. Imaging collections such as the Cancer Imaging Archive (TCIA) implement controlled-access handling for head imaging that may contain reconstructable facial anatomy, and recent NIH Data Management and Sharing policy updates have raised attention to these practices [9].
For commercially held data, such as supermarket transaction and loyalty card records used for nutrition research, reuse happens inside secure data environments with transparent governance processes, so the measurable units are approved projects and the publications that emerge from them [10].
Step 7. Automate the Workflow and Log Over Time
Repository statistics change daily, citation searches change monthly. Automate the first and schedule the second:
import csv, datetime, requests

DOI = "10.5281/zenodo.XXXXXXX"
FIELDS = ["date", "views", "downloads"]

r = requests.get(
    "https://zenodo.org/api/records",
    params={"q": f'doi:"{DOI}"'},
)
rec = r.json()["hits"]["hits"]
row = {
    "date": datetime.date.today().isoformat(),
    "views": rec["stats"]["views"],
    "downloads": rec["stats"]["downloads"],
}
with open("reuse_log.csv", "a", newline="") as f:
    writer = csv.DictWriter(f, fieldnames=FIELDS)
    if f.tell() == 0:
        writer.writeheader()
    writer.writerow(row)
print(row)
Expected output:
{'date': '2026-11-11', 'views': 1240, 'downloads': 356}A cron entry of 0 9 1 python3 /home/you/log_reuse.py runs the script at 09:00 on the first day of every month. For citation searches, set a quarterly calendar reminder and append new screened hits to the same spreadsheet.
The Metrics That Matter, Side by Side
| Metric | What it tells you | Where to get it | Main caveat |
|---|---|---|---|
| Views and downloads | Attention to the deposit | Repository API or statistics page | Bots and preview clicks inflate counts |
| Data citations | Attributed reuse | Web of Science, Scopus, Google Scholar, Europe PMC | Many reusers never cite the DOI |
| Secondary publications | Confirmed reuse outputs | Forward citation search plus screening | Screening is manual and slow |
| Internal versus external split | Community reach | Author list screening | Self-reuse inflates raw counts |
| Access mechanism | How reusers obtained the data | Platform logs, data use requests | Missing for informal transfers |
| Altmetric Attention Score | News, policy, and social attention | Altmetric badges on journal pages | Attention is not analysis |
| Version fingerprint | Which release was reused | SHA-256 hash in your metadata | Reusers rarely report it |
Pick the smallest set that answers your funder's question. For most deposits that is downloads, screened citations, and a secondary publication count.
Worked Example: A Reuse Rate From 336 Shared Trials
The YODA portfolio study shows what a mature measurement looks like. The team started from 336 eligible clinical trials with individual participant level data available for external sharing through 2021, ran Web of Science citation searches on each primary publication through June 2025, and screened every candidate [1]. The arithmetic compresses to a few lines:
trials = 336
trials_with_reuse = 265
secondary_pubs = 1167
external_pubs = 209
external_with_mechanism = 190
via_platforms = 161

print(f"reuse rate:     {trials_with_reuse / trials:.1%}")                # 78.9%
print(f"external share: {external_pubs / secondary_pubs:.1%}")          # 17.9%
print(f"platform share: {via_platforms / external_with_mechanism:.1%}")  # 84.7%
Expected output:
reuse rate:     78.9%
external share: 17.9%
platform share: 84.7%
In words, 79 percent of the trials had at least one secondary publication, external teams produced about 18 percent of the 1167 secondary publications, and roughly 85 percent of external teams that reported an access mechanism obtained the data through data sharing platforms, primarily the YODA platform itself [1]. A rate this high reflects curated, high-demand trial data. A lower rate for your deposit is normal and still reportable, especially in the first years after release.
A Practical Data Repository Comparison
Where you deposit determines which reuse signals you can measure. Four models dominate research data sharing.
| Repository model | Example | Reuse signal you can measure |
|---|---|---|
| Open generalist repository | Zenodo, Figshare | Views, downloads, citations to the DOI |
| Controlled-access platform | YODA Project | Approved data use requests, secondary publications |
| Secure data environment | Industry data enclaves | Approved projects, outputs inside the enclave |
| Federated network | Decentralized clinical repositories | Aggregated statistics, no public downloads |
Open generalist repositories give the richest public metrics and the simplest APIs, which makes them the default choice for measuring reuse. Controlled-access platforms trade public counters for governance, so your reuse evidence comes from request logs and follow-up citation searches [1]. Secure environments built around commercial data require formal partnerships and transparent processes before any measurement is possible [10]. Federated designs leave the data in place entirely, so reuse shows up only in the methods sections of papers that describe the federation [2]. Many researchers combine models, for example an open code repository plus a controlled-access data layer.
Practical Tips for Measuring Dataset Reuse
- Ship a ready-to-cite citation. Put the full citation with DOI in your README and data availability statement so reusers have no excuse.
- Ask reusers to name their inputs. A methods section that lists exactly which public datasets were analyzed, with sample sizes, is a reuse record you can count without contacting anyone.
- State intended reuse scenarios in the descriptor. Screeners can then check each hit against your stated intent, and a tooth preparation image dataset that names dental education research and machine learning as intended uses gives them a concrete test [11].
- Provide raw and transformed formats. When both layers exist, you can count reuse of each separately and see which one the community prefers.
- Search synonyms. Reusers cite accession numbers, dataset titles, and author names, not just DOIs.
- De-duplicate before you count. The same paper often surfaces in all three databases at once.
- Report zeros honestly. A year with no detected reuse is a baseline, not a failure.
Common Mistakes and Limitations
- Treating downloads as reuse. Download counters rise with bots, syllabus browsing, and preview clicks. Use them as an attention signal and pair them with screened citations.
- Counting reference-list mentions as reuse. A DOI in a bibliography is attribution, not use. Screen for described analyses before anything enters your count.
- Ignoring version drift. The file a reuser downloads may not match the file you analyzed. Anonymization can distort data in ways the tool's internal loss metrics never flag, as shown for k-anonymity at k values of 5, 10, and 15 applied to diagnosis codes and hospital length of stay [12]. Facial defacing of shared head imaging changes image statistics and can shift model performance on downstream tasks [9]. Record which version each reuser accessed, or your reuse rate will describe a dataset you never analyzed.
- Assuming all reuse is visible. Federated training across decentralized repositories moves aggregated statistics, not files, so no download is ever logged [2]. Secure environments for commercial data behave the same way [10].
- Double counting across databases. The same citing paper appears in Web of Science, Scopus, and Google Scholar. De-duplicate on DOI first, then on title plus first author.
- Over-reading short time windows. Secondary publications accumulate over years. The YODA analysis searched through June 2025 for trials whose data had been available for sharing through 2021 [1]. Monthly changes in your counts carry almost no signal.
- Blaming the dataset for low reuse. Willingness to share and reuse health data depends on trust, privacy experiences, and consent behavior, factors that sit outside data quality [13]. A low count can reflect community trust barriers as easily as dataset problems.
- Lumping self-reuse with community reuse. Internal publications count, but log them in a separate column so external reach stays visible.
Frequently Asked Questions
How do I measure the reuse of my dataset?
Combine three measurements: repository statistics for attention, forward citation searches for attribution, and a screened count of secondary publications for confirmed use. Report them together, because each one alone overstates or understates what happened.
Are download counts a good measure of dataset reuse?
No. Downloads measure attention, and bots, syllabus browsing, and preview clicks inflate them. Treat downloads as a supporting signal and rest the reuse claim on screened secondary publications.
How do I find papers that used my dataset without citing it?
Search your accession number, dataset title, and author names in Google Scholar and Europe PMC full text. Reusers often cite the primary paper or mention the accession number without ever citing the dataset DOI.
What is a good reuse rate for a dataset?
There is no universal benchmark. Compare your rate against datasets of the same type, age, and access model, and report the trend over time rather than a single number.
How soon after publication does dataset reuse appear?
Usually years. Secondary publications accumulate slowly, so set a quarterly or annual measurement cycle instead of checking weekly.
How do I measure reuse of controlled-access data?
Count approved data use requests, approved projects, and the publications that emerge from the platform, then run citation searches on those outputs. Public download counters do not apply in controlled settings.
Should self-reuse count when I measure dataset reuse?
Yes, but log it in a separate internal column. External reuse is the stronger evidence of community impact and the number funders usually want.
Can I automate dataset reuse tracking?
Partly. Repository statistics can be pulled on a schedule with a short script, while citation searches need a periodic manual pass because screening each hit is a judgment call.
Sources
- Secondary use and scholarly impact of a portfolio of clinical trials with shared individual participant level data: cross sectional study.
- Clifti-GPT: privacy-preserving federated fine-tuning and transferable inference of foundation models on clinical single-cell data.
- Building and Validating a Data-Governance Workflow for Artificial Intelligence-Based Tuberculosis Detection from Chest Radiographs, and Quantifying the Impact of Data Leakage.
- Multi-site, in vivo MRI dataset of brain diffusivity measures before and after harmonization, and atrophy measures following controlled cortical impact in male and female adult rats.
- Geo-temporal vehicular environmental sensing dataset.
- Quantitative sensory testing and classical pain model dataset in 127 healthy volunteers.
- Assessing the impact, uptake and use of reporting guidelines for patient and public involvement in research: GRIPP2 - study protocol for a meta-research project.
- Beyond classification metrics: a psychometric-aware benchmark for data augmentation in imbalanced student mental health surveys.
- Balancing privacy and performance: the impact of facial defacing on AI in medical imaging.
- Conflict or interest? Using consumer purchase data to support food systems transformation.
- A dataset of preclinical tooth preparation images.
- Quantifying the Impact of Anonymization-Induced Clinical Data Quality Loss: Methodological Quantitative Case Study Using Primary Diagnosis Codes and Hospital Length of Stay.
- Understanding Race as a Key Analytic Dimension in AI-Enabled, Health-Related Social Engagement Online and Its Role and Impact in Health Research.