How to Use a Literature Review Matrix for a Scoping Review
By Dr. Zubair Khalid, DVM, MS, PhD ·

By the end of this article you will be able to plan a systematic literature search, deduplicate and screen the results, design a literature review matrix with the right columns, chart every included source into that matrix, turn the grid into counts and cross-tabulations, and report the whole process in a way that satisfies PRISMA-ScR reviewers. You will need four tools, all free for academic use: a reference manager such as Zotero, a screening tool such as Rayyan, a spreadsheet program such as Excel or Google Sheets, and optionally Python or R for counting. Nothing else is required.
A literature review matrix is a grid in which each row is one source of evidence and each column is one piece of information you extract from that source, such as population, method, intervention, and outcome. In a scoping review, this grid is usually called a data charting form, and it is the central working document of the entire project. Published scoping reviews rely on it constantly. A neonatal transport review charted data from 39 sources using a predefined matrix [1]. A review of healthcare access for older Indigenous women in Latin America used a standardized matrix worked by seven reviewers [2]. An advanced cancer decision-making review built an explicit two-axis matrix, crossed three decision domains against three evaluative dimensions, and reported how many of its 82 records fell into each cell [3]. The matrix is not paperwork on the side of the review. The matrix is the review.
Why a Literature Review Matrix Fits a Scoping Review
A scoping review maps the extent, range, and nature of evidence on a topic rather than pooling effect sizes into a single estimate. Because the included studies usually differ in design, population, and outcome, a meta-analysis is often impossible, and the synthesis is descriptive instead [1]. That descriptive synthesis has to live somewhere, and the matrix is where it lives.
Scoping reviews follow the Joanna Briggs Institute (JBI) methodology for evidence synthesis and are reported against the PRISMA-ScR checklist, the scoping review extension of the Preferred Reporting Items for Systematic Reviews and Meta-Analyses [4], [5]. Both frameworks expect transparent documentation of what you searched, what you included, and what you extracted. A well-built matrix answers all three at once: the row count gives your number of included sources, the columns show what you charted, and the raw grid can go straight into a supplementary file.
The matrix also protects you from the most common failure of narrative literature review writing, which is drifting from study to study in prose and losing track of who did what. When a dental pulp DNA extraction review needed to compare sampling procedures, storage conditions, contamination control, lysis methods, and sequencing platforms across 30 studies, the only manageable way to hold all of that was a structured charting table [4]. Human working memory does not scale to 30 studies by 10 fields. A grid does.
What You Need on Hand
- A reference manager. Zotero is free and was used for deduplication in a published scoping review pipeline [4].
- A screening tool. Rayyan supports independent title and abstract screening by two reviewers with disagreement resolution [4].
- Access to at least two or three bibliographic databases through your institution. The recurring set in published scoping reviews is PubMed/MEDLINE, Scopus, Web of Science, and Embase, often with Cochrane, CINAHL, LILACS, or Google Scholar added [4], [6], [7].
- A spreadsheet for the matrix itself, plus optional Python with pandas or R for counting.
Step-by-Step: Building and Using a Literature Review Matrix
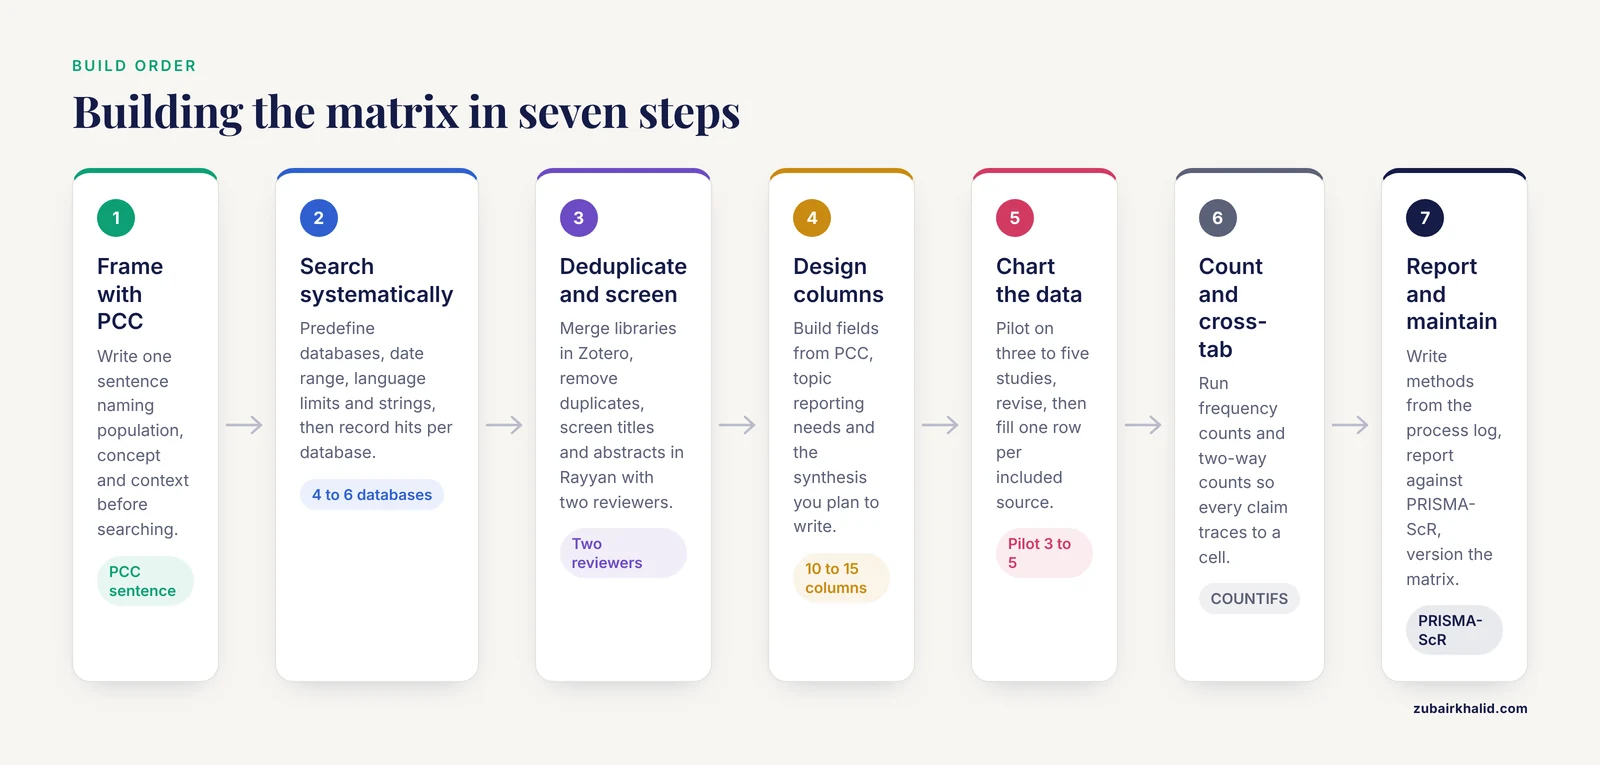
Step 1. Frame the question with the PCC structure
JBI scoping review methodology frames eligibility with the Population, Concept, Context (PCC) framework: who or what you study, the main concept of interest, and the setting [8], [9]. Write one sentence of the form "For this population, what is known about this concept in this context?"
A tree nut aflatoxin review phrased its guiding question as which physical, chemical, and biological methods are most effective for aflatoxin decontamination in tree nuts, and how feasible they are for quality preservation and industrial use [5]. A hand therapy protocol defined its population as adults aged 18 or older who used a relative motion orthosis, its concept as patient-perspective evidence on acceptability, usability, and everyday impact, and its context as any adult hand rehabilitation setting [7]. Notice how each PCC element later becomes a column in the matrix. Write the PCC sentence down before you search. It will discipline both the search strings and the extraction fields.
Step 2. Run a systematic literature search
A systematic literature search means predefining your databases, your date range, your language limits, and your search strings before you run them, then documenting everything. Published scoping reviews searched four to six databases as standard [4], [7], and supplemented them with gray literature sources such as Google Scholar, trial registries, and reference-list screening [4], [1], [8].
For each database, build your search from PCC concept blocks joined with AND, and synonyms within each block joined with OR. A simplified PubMed-style query for a scoping review of microfluidic diagnostics in periodontology would look like this:
("periodontitis"[Title/Abstract] OR "peri-implantitis"[Title/Abstract])
AND
("microfluidic"[Title/Abstract] OR "lab-on-a-chip"[Title/Abstract]
 OR "biosensor"[Title/Abstract] OR "point-of-care"[Title/Abstract])
Record, for every database, the exact string, the date run, and the number of hits. One periodontology review ran this type of search across PubMed, Scopus, Web of Science, and Google Scholar for studies published from January 2015 to March 2026 and identified 1,764 records, of which 20 met its inclusion criteria [10]. A micronutrient status review in anorexia nervosa searched from database inception and found 621 records [8]. The range is wide and normal. Search sensitivity, not a tidy hit count, is the goal.
Set your date range by the logic of the topic, not by convenience. A review of next-generation sequencing workflows started at 2011, when modern short-read platforms entered routine use [4]. A review of neonatal transport restricted to reports from 2020 onward to capture contemporary practice [1]. Justify your window in your methods text the same way.
Step 3. Deduplicate and screen
Export every database result into your reference manager, merge the libraries, and remove duplicates. In the published pipeline used by the dental pulp review, records were deduplicated in Zotero, then screened in Rayyan by two independent reviewers, with disagreements resolved by discussion or a third reviewer [4]. Screen in two passes:
- Title and abstract screening against your PCC eligibility criteria. Both reviewers judge every record.
- Full-text screening of everything that passed, with a logged reason for every exclusion.
Track the counts at each stage, because PRISMA-ScR requires a flow diagram with these exact numbers. Real examples of the arithmetic: a sequencing methods review started with 389 records, kept 219 after duplicate removal, assessed 44 full texts, and included 30 studies [4]. A dental pulp bioprinting review screened 143 records, assessed 23 full texts, and included 13 studies [11]. A lab-on-a-chip review went from 1,764 records down to 20 studies [10]. Record each exclusion reason at the full-text stage so the flow diagram writes itself later.
Step 4. Design the matrix columns
Now design the literature review matrix itself. The columns come from three places: your PCC framework, the reporting requirements of your topic, and the synthesis you plan to write. A practical starter set of columns:
| Column group | Example fields | Why it matters |
|---|---|---|
| Bibliographic | Author, year, journal, country, DOI | Identifies the row, enables mapping by region |
| Evidence type | Study design, direct, indirect, or mechanistic | Lets you grade how close each source sits to your question [12] |
| Population | Species, sample size, age, setting | Connects to the P in PCC |
| Concept | Intervention, exposure, biomarker, or framework studied | Connects to the C in PCC |
| Context | Setting, country, time span | Connects to the CT in PCC |
| Methods detail | Key reagents, platforms, parameters | Enables comparability across rows [4] |
| Results | Main findings in the authors' own units | Raw material for your synthesis |
| Gaps and notes | Limitations noted, unanswered questions | Feeds your knowledge-gap section [2], [13] |
Match column depth to your synthesis plan. The neonatal transport review grouped its matrix around system organization, clinical stabilization, medication use, adverse events, and communication, because those were the categories its mapping question demanded [1]. The micronutrient review charted each study by design, population, biological matrix, timing, and nutrient outcome [8]. The lab-on-a-chip review extracted technology type, target biomarkers, sample analyte, diagnostic performance, and technology readiness level [10]. In each case the columns were chosen backwards from the summary the authors intended to write.
Two design rules prevent most later pain. First, one fact per cell, never a paragraph. Second, define an allowed vocabulary for each categorical column before charting starts, for example "direct", "indirect", "mechanistic" for evidence type, so that two charters cannot invent different labels for the same finding. The gut-liver axis review used exactly that three-level evidence classification to separate studies that tested its food intervention directly from studies that only supported the underlying biology [12].
Step 5. Chart the data
Charting means filling one row per included source. Use a controlled pilot: chart three to five studies first, review whether the columns capture what you need, revise, then proceed. JBI methodology treats charting as an iterative process, and published teams did exactly this, refining a standardized matrix as extraction proceeded [2].
A filled section of a matrix for a hypothetical scoping review of probiotic interventions might look like this in CSV form:
id,author_year,country,design,evidence_type,population,n,concept,outcome_reported,gap_note
01,Shin 2021,Korea,RCT,direct,adults with IBS,124,multi-strain probiotic,bloating score improved,no follow-up past 8 weeks
02,Ortega 2022,Spain,cross-over trial,direct,healthy adults,32,single-strain probiotic,no change in transit time,small sample
03,Larsen 2023,Denmark,mechanistic study,mechanistic,mouse model,24,probiotic metabolite,barrier protein expression up,not tested in humans
Spreadsheet rules that keep the grid analyzable:
- Keep dates in ISO format (2023-04-15) so sorting works.
- Never merge cells. Every cell holds one atomic value.
- Add a numeric ID column so you can reference rows unambiguously in team meetings.
- Record the page number or table number where each fact came from, in a citation column, because your discussion section will need to point back to evidence.
Step 6. Analyze the matrix with counts and cross-tabs
Once every row is charted, the matrix becomes a dataset. The simplest analysis is a frequency count per column. The traditional Chinese medicine review counted 155 syndrome-element occurrences across its 59 included sources and reported the share of each element, with deficiency at 23.9 percent, dampness at 21.3 percent, heat at 20.6 percent, stasis at 16.8 percent, and toxin at 14.8 percent [14]. The orthodontic appliance review counted its 109 studies by evidence type, 96 in vitro, 8 in vivo animal, and 5 clinical trials, which exposed at a glance how thin the clinical layer of the literature was [15].
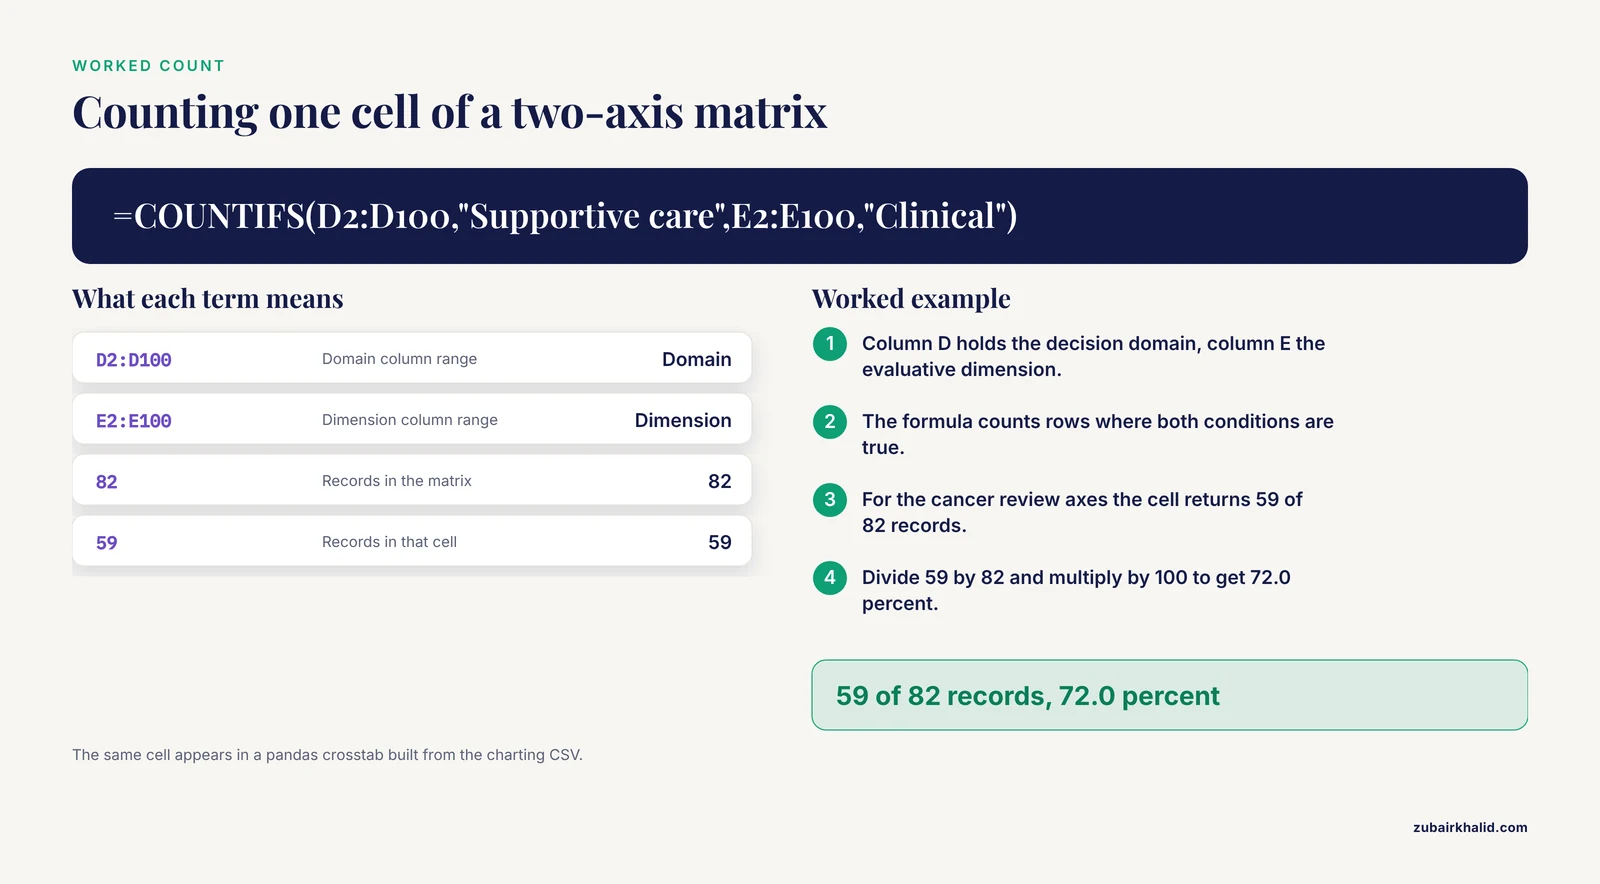
The more powerful analysis is the cross-tabulation, a two-way count of how often two categorical columns coincide. This is where a two-axis matrix earns its name. The advanced cancer review crossed three decision domains (Diagnosis, Supportive care, Therapy) against three evaluative dimensions (Biological, Clinical, Existential) and counted records per cell, finding supportive care paired with the clinical dimension in 59 of 82 records (72.0 percent) while the two diagnosis cells sat at 13 of 82 each (15.9 percent) [3]. The RDoC psychiatry review crossed somatic symptoms, Research Domain Criteria constructs, and psychiatric disorders, and identified the most frequent three-way combination, pain with perception in borderline personality disorder, in 11 of its 73 articles [13].
You can produce these counts in a spreadsheet with COUNTIFS. Suppose your matrix has a column D named Domain and a column E named Dimension:
=COUNTIFS(D2:D100,"Supportive care",E2:E100,"Clinical")For a matrix of 82 rows charted with the cancer review's axes, the expected output in the supportive care and clinical cell is 59.
In Python with pandas, the same computation is a crosstab:
import pandas as pd

df = pd.read_csv("charting_matrix.csv")
cells = pd.crosstab(df["Domain"], df["Dimension"], margins=True)
pct = pd.crosstab(df["Domain"], df["Dimension"], normalize="all") * 100
print(cells)
print(pct.round(1))
For an 82-row matrix mirroring the published axes, the output would show a table of raw counts per cell, with the Supportive care row and Clinical column intersecting at 59, and a matching percentage table showing 72.0 in that same cell [3]. Either tool works. The point is that your synthesis paragraphs should never assert a pattern you cannot trace to a count in the matrix. "Most evidence is indirect" is only defensible if your evidence-type column says so, as it did for 24 of 39 sources in the neonatal transport review [1].
Descriptive synthesis then writes itself column by column. The healthcare access review distilled its matrix into eight accessibility dimensions, geographic, economic, cultural, organizational, linguistic, functional, administrative, and social, and listed barriers within each [2]. The enamel formation review converted its charted rows into a thematic synthesis of cellular and molecular mechanisms [16]. An empty or sparse column is a finding. The UV-C milk pasteurization review concluded that research was limited by the narrow range of milk components evaluated, which is exactly the kind of gap a charting column with many empty cells reveals [17].
Step 7. Report against PRISMA-ScR and keep the matrix alive
Write your methods section directly from your process log: databases and platforms searched, exact strings, date ranges, deduplication tool, screening tool and reviewer setup, charting fields, and any revisions to the matrix. The results section then follows the structure of the matrix itself. Finally, decide whether your review needs a protocol and preregistration. A tobacco regulation protocol followed JBI methodology, structured eligibility with PCC, and preregistered the plan before searching [9], and an orthosis protocol published its intended charting approach before any data were extracted [7]. Preregistering your matrix columns is strong protection against the accusation that you shaped extraction fields around favored results.
Practical Tips for the Literature Review Matrix
- Build the matrix before screening ends. If the columns do not exist until charting starts, you will invent them while biased by the first few studies you read.
- Give every column a data dictionary: allowed values, definition, and an example. When seven reviewers share one matrix, as in the Latin American healthcare access review, an undefined column collapses into inconsistency fast [2].
- Screen and chart in parallel passes only after the pilot. Charting studies that later get excluded at full text is wasted effort, so finalize eligibility first.
- Keep excluded full texts with reasons in a separate sheet. PRISMA-ScR wants the reasons, and co-authors will ask.
- Use a two-axis or three-axis matrix when your mapping question has independent dimensions. Crossing intervention type against outcome type, as the cancer review crossed decision domains against evaluative dimensions, turns a flat table into a gap-finding instrument [3].
- Classify evidence proximity deliberately. Labeling each row as direct, indirect, or mechanistic evidence, as one nutrition review did, prevents you from presenting mechanistic inference as clinical proof in your synthesis [12].
- Version the matrix. Save dated copies so a revised column definition never silently rewrites charted cells.
Common Mistakes and Limitations
Inventing columns after seeing the results. Post hoc columns invite cherry-picking. Define fields from PCC and your planned synthesis, pilot them, and preregister when feasible [7],.
Free-text soup in categorical cells. If one charter writes "RCT" and another writes "randomized trial" and a third writes "randomised", every count downstream breaks. Controlled vocabularies are not optional.
Treating the matrix as the synthesis. A grid full of rows is not a narrative. After counting, you still have to interpret, as the TCM review did when it cautioned that syndrome-element frequencies reflect literature-level reporting patterns rather than patient-level prevalence [14]. Say what the counts mean and what they cannot mean.
Overcharting. Twenty-five columns per row sounds thorough and produces a matrix no one finishes. Charted fields you never analyze are pure labor. Cut anything that does not feed a planned table, figure, or paragraph.
Ignoring heterogeneity warnings. Scoping reviews synthesize descriptively because their included studies are non-comparable in design and outcomes [1]. The matrix makes rows look uniform and can tempt you into informal vote counting. Resist it. A count of 20 positive studies against 10 negative studies means little when the studies measure different things.
Skipping gray literature and citation chaining. Backward reference-list screening added 27 studies, a fifth of the final evidence set, to one micronutrient review [8]. Database-only searches undercount.
Losing the reviewer-independent structure. Single-reviewer screening and charting is the norm in student projects and the first thing reviewers of your manuscript question. Two independent screeners with a disagreement rule is the published standard [4].
Confusing charting with appraisal. Scoping reviews often map evidence without formal quality scoring. If you chart study limitations in a column, keep them descriptive rather than converting them into quality grades unless your protocol says otherwise.
Frequently Asked Questions
What is the difference between a literature review matrix and a data extraction form?
They are the same artifact under two names. Data extraction form is the term used in JBI and PRISMA-ScR documentation, while literature review matrix is the term common in coursework and research training. Both mean a grid of one row per source and one column per extraction field.
How many columns should my matrix have?
Enough to answer your mapping question, usually between 10 and 15. Every column should map to a specific planned output, and anything that does not should be cut before charting begins.
Do I need a matrix for a narrative literature review?
You can use one and it will improve your organization, but a narrative review does not require the documented, reproducible extraction process that a scoping review does. The matrix is most valuable when transparency and completeness are graded.
How is a scoping review different from a systematic review?
A scoping review maps the extent and nature of evidence and describes it, while a systematic review typically asks a focused question and may pool effect estimates. A scoping review often precedes a systematic review by identifying where the evidence is thick or thin.
Can I build the matrix in Excel or Google Sheets?
Yes. A spreadsheet is the standard tool, supports COUNTIFS and filtering, and can be exported as CSV for analysis in Python or R. Dedicated extraction software exists but is not required.
How do I handle a study with missing information in a key column?
Record "not reported" as the cell value rather than leaving it blank, so that later counts distinguish genuinely missing data from data you forgot to extract. Persistent "not reported" values in a column are themselves a gap worth reporting.
When can I revise matrix columns after charting has started?
During the pilot phase, freely. After full charting begins, only add columns forward for new rows or return to every existing row systematically, and document the change in your methods. Never revise definitions for some rows only.
How does the matrix relate to my PRISMA-ScR report?
The matrix supplies the included-studies table, the flow diagram numbers come from your screening log, and your results narrative should follow the structure of your charting columns. Reviewers can check your transparency by comparing the reported fields against the actual matrix in your supplementary files.
Sources
- Contemporary Evidence on Interhospital Neonatal Transport as a Potentially Sepsis-Relevant Care Interval: A Scoping Review.
- Healthcare Access for Older Indigenous Women in Latin America: A Scoping Review of Barriers, Facilitators, and Knowledge Gaps.
- Mapping Integrative Decision-Making Frameworks in Advanced Cancer Care: A Scoping Review of Diagnostic, Supportive-Care, and Therapeutic Integration.
- DNA extraction methods and pre-analytical workflows for next-generation sequencing in infected dental pulp and endodontic infections: A scoping review.
- Aflatoxin decontamination in tree nuts: a scoping review of physical, chemical, and biological methods.
- Cancer-associated dermatomyositis: A scoping review of the literature.
- Patient-perspective evidence on the acceptability, usability, and everyday impact of relative motion orthoses in adult hand rehabilitation: A scoping review protocol.
- Beyond Body Weight: Mapping Vitamin, Mineral, and Trace-Element Status in Anorexia Nervosa-Scoping Review.
- Strategies used by tobacco companies to circumvent tobacco-control regulations across regulatory environments - a scoping review protocol.
- Transforming Diagnostic Precision in Periodontology Through Lab-on-a-Chip Technology: A Scoping Review.
- 3D Bioprinting Approaches for Dental Pulp Regeneration: A Scoping Review.
- Gut-Liver Axis Dysfunction in Alcohol-Associated Liver Disease and the Potential Role of Sheep Yogurt: A Scoping Review and Mechanistic Framework.
- RDoC Mechanisms Underlying Bodily Symptoms in Psychiatry: A Scoping Review.
- Traditional Chinese medicine in non-muscle-invasive bladder cancer: a scoping review of syndrome characteristics and critical synthesis of pharmacological and mechanistic evidence.
- Antibacterial Interventions for Orthodontic Appliances; Surface Modifications, Coatings and Bulk-Incorporated Antibacterial Agents: Materials, Mechanisms and Clinical Application-A Scoping Review.
- Human Enamel Formation: A Scoping Review for Oral Health Professionals.
- Treating donor human milk with alternative pasteurization methods, high-pressure processing and ultraviolet-C irradiation, and their impact on pathogen inactivation, nutrient content and protein bioactivity: a scoping review.