Lean Laboratory Management: Step-by-Step Guide
By Dr. Zubair Khalid, DVM, MS, PhD ·
Lean laboratory management applies lean thinking, the improvement system that grew out of the Toyota Production System, to the daily work of a laboratory. The premise is simple. The person waiting on a result, whether a patient, a clinician, or a principal investigator, cares about one thing: an accurate result delivered when needed. Every activity that does not serve that goal is waste, and waste can be seen, measured, and removed.
This guide walks through one complete improvement cycle. By the end you will be able to write a focused problem statement, collect baseline turnaround data in a spreadsheet or Python, map a workflow at the bench, find the true bottleneck, design and pilot countermeasures, verify the change with before-and-after numbers, and lock the gains into standard work.
Before you start, gather a process worth studying, two to four weeks of timestamp data from your laboratory information system (LIS) or a manual log, spreadsheet software such as Excel or Google Sheets, or Python with pandas if you prefer code. Add a stopwatch, a wall or whiteboard for the process map, sticky notes, and two to five colleagues who actually perform the work.
What Lean Laboratory Management Means
Lean starts from the customer's definition of value. In a clinical laboratory, value is a correct result inside the clinically useful window. In a research laboratory, value is a reliable dataset produced when the experiment needs it. Lean sorts every task into three buckets: value-added work the customer would pay for, necessary non-value-added work such as quality control and calibration that quality systems require, and pure waste (what lean calls muda). The method attacks the third bucket and shrinks the time trapped in queues between the first bucket's steps.
The Eight Wastes in a Laboratory
Lean practitioners scan for eight waste types, each with a direct laboratory translation.
- Defects. Rejected samples, repeat runs, mislabeled specimens, transcription errors.
- Waiting. Specimens queued for a batch, results waiting for sign-out, staff waiting for a free centrifuge.
- Transport. Samples carried between floors or buildings, printouts walked to benches.
- Motion. Searching drawers for reagents, walking to a shared printer, reaching across a crowded bench.
- Inventory. Overstocked kits expiring on the shelf, hidden stockpiles in bench drawers.
- Overproduction. Cutting extra sections nobody ordered, printing duplicate reports.
- Overprocessing. Duplicate data entry, redundant checks, paperwork nobody reads.
- Underused skills. Technologists who can see the fix but have no channel to propose it.
These wastes travel together. A Lean Six Sigma project, which pairs lean's waste removal with Six Sigma's statistical defect reduction, was run in an immunohematology laboratory at a tertiary care blood center and traced its inefficiencies to extended turnaround time, high sample rejection rates, frequent telephone interruptions, and disorganized staff movement [1]. Those four findings are defects, waiting, overprocessing, and motion wearing lab coats.
The Metrics That Matter
Turnaround time (TAT), the elapsed time from specimen receipt to result release, is usually the headline metric. These formulas cover the rest.
| Metric | Formula | What it tells you | Common trap |
|---|---|---|---|
| Turnaround time (TAT) | Release timestamp minus receipt timestamp | End-to-end speed the customer feels | Reporting the mean instead of the median and 90th percentile |
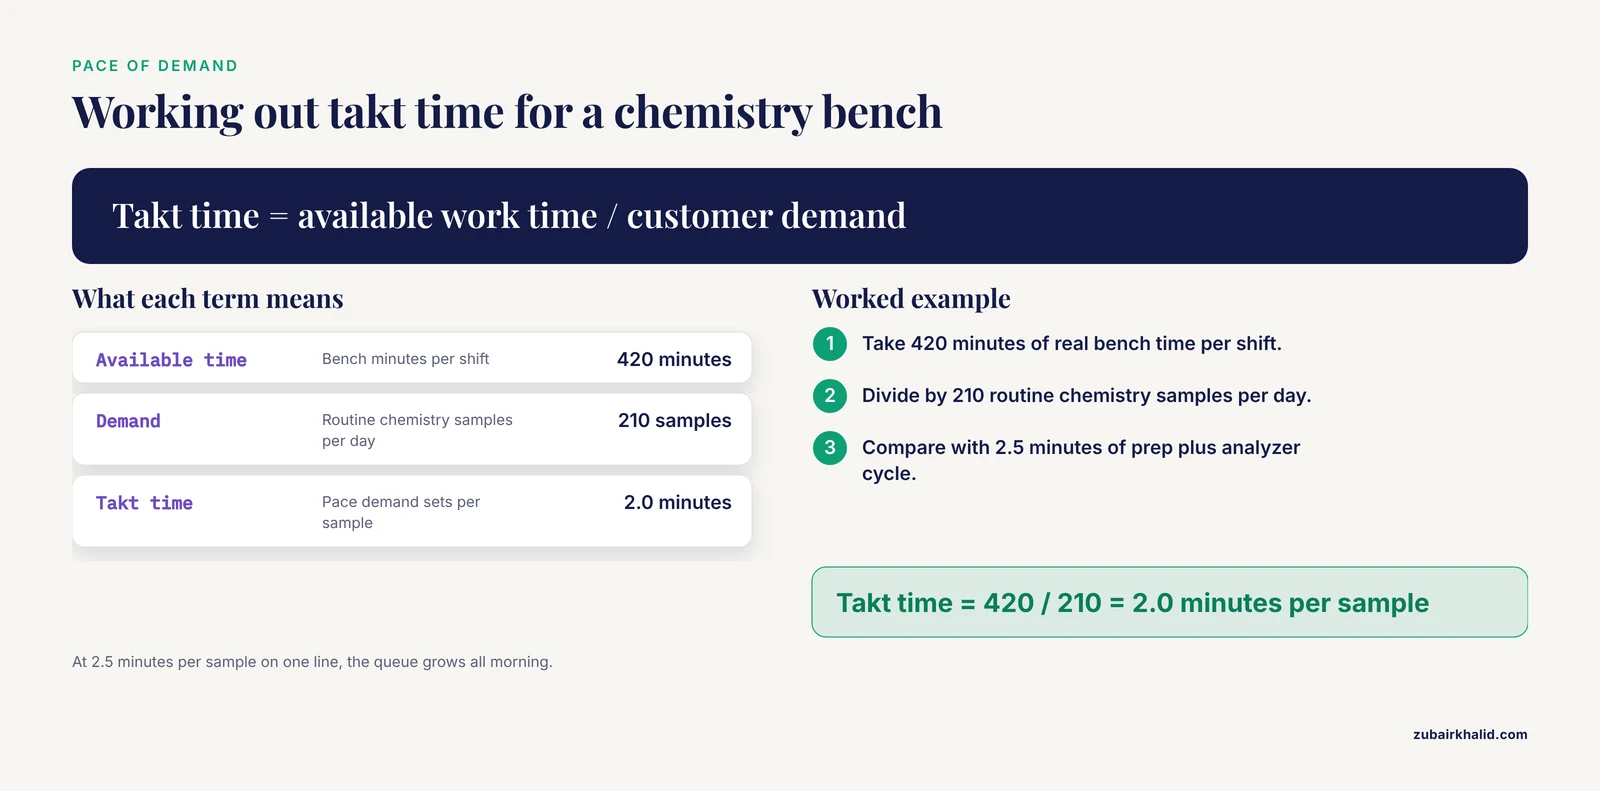
| Takt time | Available work time divided by customer demand | The pace demand sets for each step | Using scheduled hours instead of real bench time |
| Cycle time | Time to finish one unit at one step | The capacity of each step | Timing a single best-case cycle |
| First-pass yield | Units accepted the first time divided by units started | The size of your rework burden | Forgetting rejected samples and repeat runs |
| Process cycle efficiency (PCE) | Value-added time divided by total lead time | How much delay is actual work versus waiting | Counting required checks, such as QC, as waste |
| Little's Law | Work in process equals throughput times lead time | Why queues, not hand speed, drive delay | Adding staff when the real fix is less work in process |
Two worked examples show how to use the table.
Available bench time per shift:   420 minutes
  (8-hour shift minus breaks, huddles, and cleanup)
Average daily demand:             210 routine chemistry samples

Takt time = 420 / 210 = 2.0 minutes per sample
If manual prep plus the analyzer cycle takes 2.5 minutes per sample on one line, the line cannot keep pace with demand and the queue grows all morning. Your options are to level the arrival of samples, shrink batch sizes, or add capacity at that step.
Hands-on (value-added) time per specimen:  90 minutes
Total lead time per specimen:              3,240 minutes (2.25 days)

PCE = 90 / 3,240 = 0.028, or 2.8%
A PCE of 2.8 percent means 97 percent of elapsed time is waiting, transport, or queueing. That ratio tells you where to hunt: the largest payoffs usually come from queues and handoffs, not from faster bench technique.
Before You Start: Write a One-Page Project Plan
A lean project fails most often at the start, from a vague problem and an unfixed metric. Write a one-page charter before touching anything. The same document doubles as a research project plan template for an academic lab, which makes it a useful bridge between lean daily management and formal research project management. Swap TAT for experiment cycle time or assay failure rate and the structure holds.
LEAN LABORATORY PROJECT CHARTER (one page)

Problem statement: Routine chemistry samples exceed the 4-hour
  turnaround target for roughly 1 in 5 weekday specimens.
Primary metric: 90th-percentile TAT, receipt to release, in hours.
Baseline: 4.9 hours. Target: 3.5 hours by Week 12.
Scope in: receipt, centrifugation, analysis, validation, release.
Scope out: phlebotomy collection, add-on testing, STAT workflow.
Team: lab director (sponsor), senior technologist (lead),
  two bench technologists, LIS analyst, phlebotomy supervisor.
Milestones:
  Weeks 1 to 2: baseline data pull and bench time study.
  Week 3: current-state map built at the bench.
  Week 4: root-cause analysis and countermeasure selection.
  Weeks 5 to 8: pilot on one bench, daily 10-minute review.
  Weeks 9 to 12: rollout, standard work, control chart review.
Decision rule: continue the pilot if median TAT drops at least
  20 percent with no increase in rejects or errors.
The Step-by-Step Lean Laboratory Workflow
Step 1: Define One Problem and One Metric
Write one sentence with a number in it. Weak: turnaround time is too slow. Workable: the 90th-percentile TAT for routine chemistry exceeded the 4-hour target on 20 percent of weekdays in January. The statement names the metric, the population, the gap, and the period, and it contains no solution. Pick one primary metric and two or three balancing metrics, such as rejection rate and overtime, so speed is never bought with quality.
Step 2: Assemble a Small Cross-Functional Team
Keep the team small and put the people who do the work on it. A workable core is a sponsor with authority to approve changes, a lead who owns the metric, two or three bench staff, and someone with data access. For larger programs, healthcare teams often use a Rapid Process Improvement Workshop (RPIW), a structured multi-day lean event in which a selected cross-functional team maps the process, brainstorms countermeasures, and standardizes workflows. A provincial point-of-care testing (POCT) program in Canada, which performs diagnostic testing at or near the patient site, used exactly this approach to harmonize verification and installation strategies across 23 sites [2].
Step 3: Collect Baseline Data
Pull timestamps from the LIS for at least two weeks, one row per specimen. In Python with pandas:
import pandas as pd

# One row per specimen, two timestamps from the LIS export
df = pd.read_csv("chemistry_tat.csv", parse_dates=["received", "released"])

df["tat_hours"] = (df["released"] - df["received"]).dt.total_seconds() / 3600

print(df["tat_hours"].describe(percentiles=[0.50, 0.90]).round(2))
Expected output:
count    240.00
mean       3.42
std        1.05
min        0.80
50%        3.20
90%        4.90
max        7.10
Name: tat_hours, dtype: float64
Half of specimens are released within 3.2 hours and 9 in 10 within 4.9 hours. Manage the 90th percentile, because the slow tail is what users notice.
Two errors appear constantly. If you skip parse_dates, you get TypeError: unsupported operand type(s) for -: 'str' and 'str' because the timestamps loaded as text. Fix it with pd.to_datetime(df["received"], errors="coerce") on each column, then drop rows with missing values. If the export header reads "Received Date" instead of "received", you get KeyError: 'received'. Run print(df.columns.tolist()) and rename the columns to match.
Check the result before trusting it. Run df.loc[df["tat_hours"] < 0], which should return nothing, since negative TAT means a clock, timezone, or column-order problem. Then recompute three rows by hand from the raw timestamps. In Excel, put =(E2-D2)*24 in F2 for TAT in hours, fill down, and use =MEDIAN(F2:F241) and =PERCENTILE.INC(F2:F241, 0.9).
Timestamp discipline pays beyond TAT. A retrospective analysis of 7,986 ICSI cycles (intracytoplasmic sperm injection, a fertilization technique) used an electronic witnessing system to test whether laboratory management affected embryo development. Neither the total number of procedures nor the workload per operator affected the mean blastulation rate, the share of embryos reaching the blastocyst stage. What mattered was timing: each additional hour in the interval from ovulation trigger to oocyte denudation, which ranged from 36 to 44 hours, was associated with a measurable decline, especially beyond the 40-hour mark [3]. Without clean timestamps, that relationship would have been invisible.
Step 4: Map the Current State
A value stream map is a one-page drawing of every step between order and reported result, with a data box under each step for cycle time, wait time before the step, and first-pass quality. Draw it at the bench with a stopwatch, not in a conference room. Add a spaghetti diagram, a floor sketch tracing one specimen's physical path, to expose transport and motion. Count the handoffs. Every handoff is a queue with a name and a number once you have timestamps.
Step 5: Find the Bottleneck and Root Causes
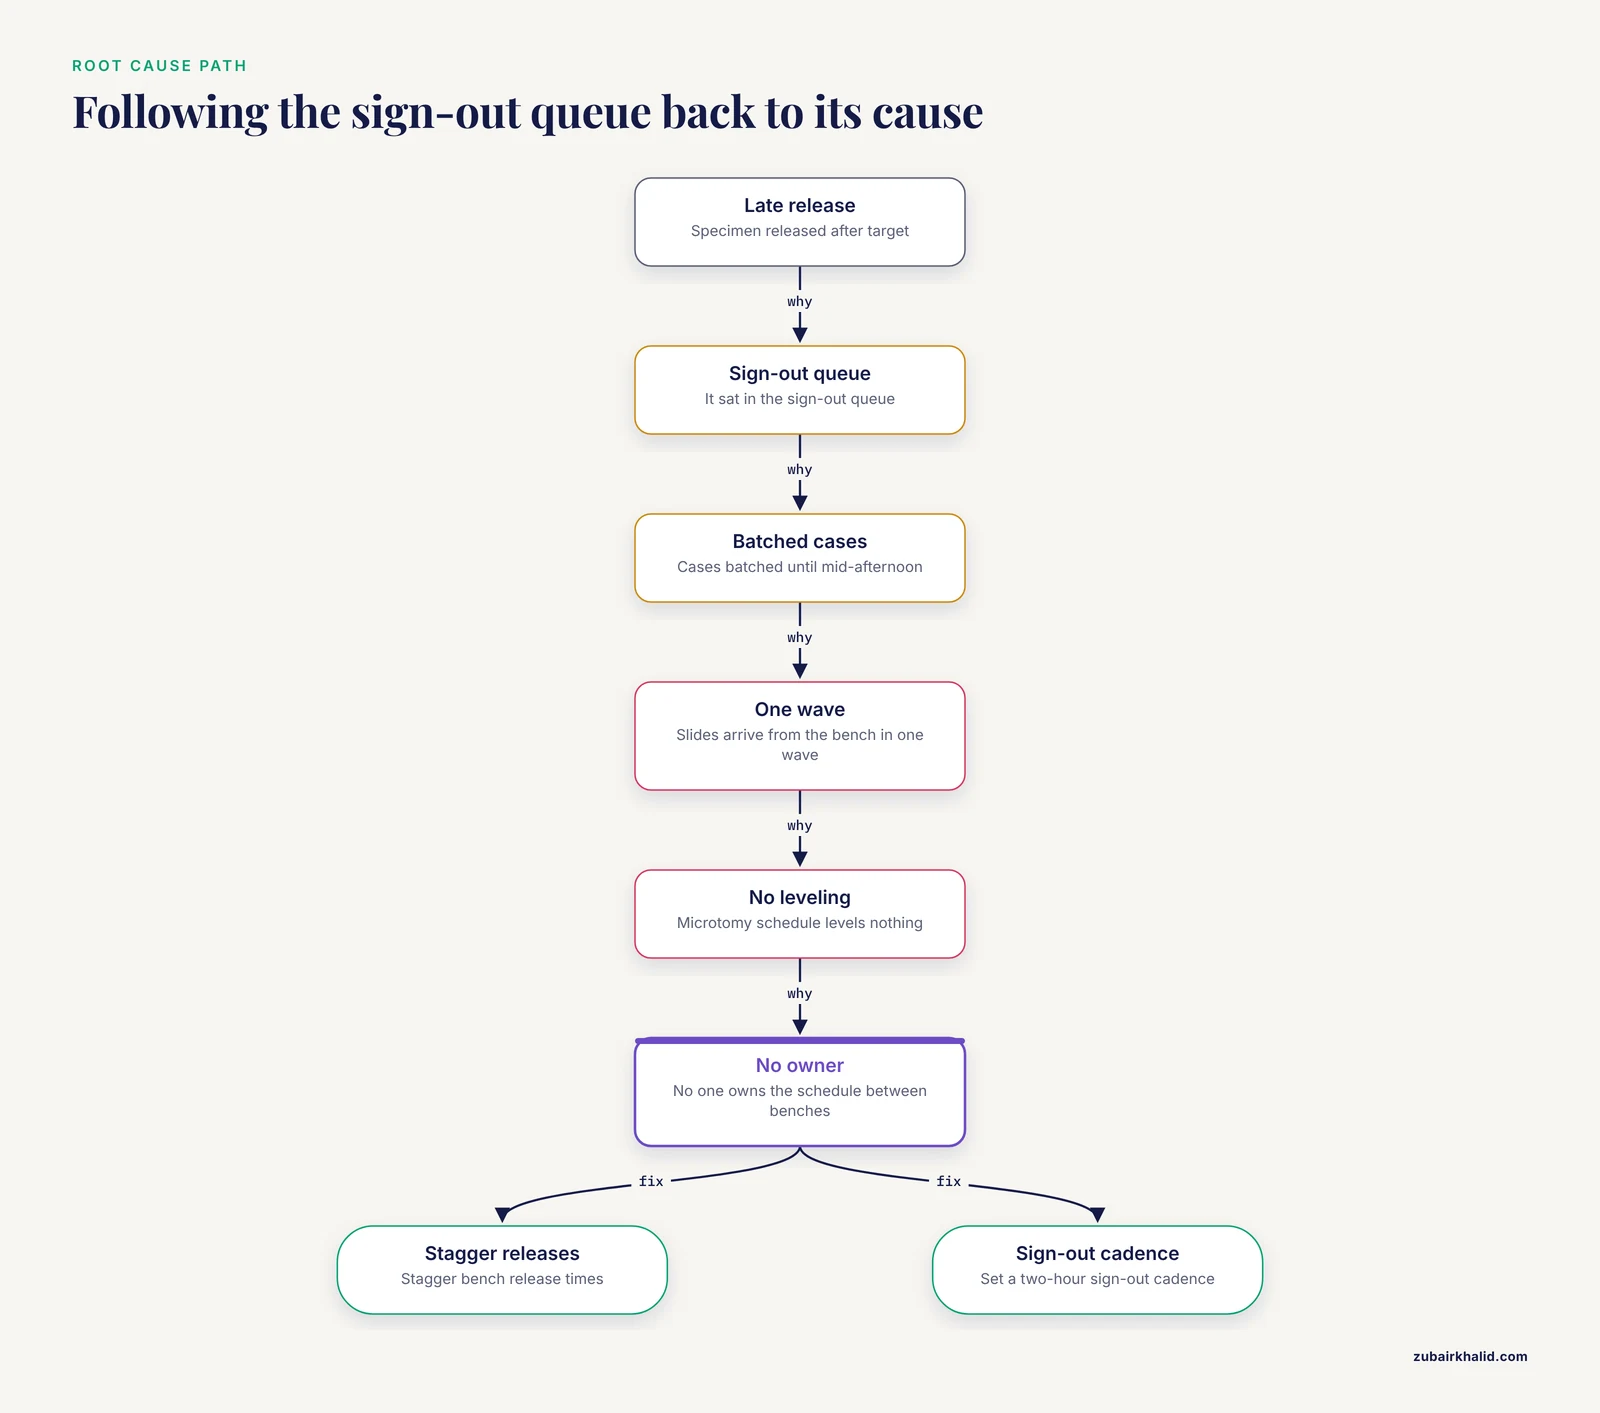
The bottleneck is the step with the highest utilization or the longest queue. Little's Law explains why it dominates: at a given throughput, more work in process means longer lead times, so the deepest queue sets the pace for everything downstream. Interrogate it with 5 Whys, asking why repeatedly until you reach a cause you can act on.
Why was the specimen released late?   It sat in the sign-out queue.
Why did it sit there?                 Cases batched until mid-afternoon.
Why batched until mid-afternoon?      Slides arrive from the bench in one wave.
Why one wave?                         The microtomy schedule levels nothing.
Why is nothing leveled?               No one owns the schedule between benches.
Countermeasure: stagger bench release times and set a two-hour sign-out cadence.
A multi-site histopathology study shows the payoff of this discipline. From one month of receipts, researchers sampled 97 cases and 556 tissue blocks. Overall, 87.5 percent of diagnostic biopsies met a two-day benchmark and 81.3 percent of routine surgical cases met the five-day target, with average TAT of 1.6 and 3.3 days. The pathologist sign-out stage was the largest single contributor at 1.7 days, and ancillary testing stretched cases further [4]. A team that spent its energy speeding tissue processing would have missed the real constraint.
Step 6: Design and Pilot Countermeasures
Match the countermeasure to the waste you found.
- 5S. Sort out unneeded items, set a labeled point-of-use place for everything, clean to reveal leaks and wear, standardize the layout, and sustain with audits. A bench that passes a 5S audit cuts motion waste immediately.
- Kanban. A visual signal that caps inventory. In a two-bin system you work from the front bin, and when it empties, its card travels to stores while the backup bin slides forward. Stock arrives before the backup runs out.
- Standard work. The current best known method, documented at the bench with cycle times and key checks. It is the baseline every future improvement is measured against.
- Leveled, smaller batches. Stagger collection rounds and bench releases so work arrives as a stream rather than a wave.
- Visual management and tracking. A university hospital replaced a paper-based clinic-to-laboratory handoff log with a digital tracking system that records time-stamped scans at fixed checkpoints, syncs them to a cloud dashboard, and triggers automated overdue alerts. Delayed episodes fell from 52.9 to 17.9 percent, and mean delayed days per episode fell from 5.83 to 3.12 [5]. In an intensive care unit, a touchscreen bedside dashboard that pulls laboratory results, blood gases, lactate, and fluid balance from the existing electronic health record in real time, without a computer login, drew predominantly positive staff survey responses on workflow and care quality, with reviewers noting that display formats should be customized for each professional role [6].
- Standardized communication. A six-week, nurse-driven telephone reminder protocol for scheduled laboratory appointments cut no-show rates from 33 to 19 percent, and 83 percent of surveyed patients reported satisfaction with the process [7].
- Standardized tools and inventory. A tertiary cancer hospital applied multidisciplinary lean management to surgical instruments, streamlining instrument set varieties by 32.7 percent and cutting the average number of instruments per set by 21.3 percent. Labor time fell across roles, with reductions of 27.2, 12.8, and 14.5 percent in different task domains, alongside cumulative instrument configuration savings of about 4.97 million CNY [8]. Traceability supports the same discipline: the Canadian POCT program assigned every analyzer a provincial equipment identification number and harmonized identical devices across its 23 sites so verification and installation follow one standard [2].
Pilot on one bench for two weeks under the decision rule written in your charter. Change one coherent set of things at a time so you can attribute the result.
Step 7: Verify the Improvement With Numbers
Rerun the Step 3 code on post-pilot data and compare like with like: similar weekdays, similar assay mix, similar staffing. The immunohematology project followed this pattern, analyzing outcomes before and after corrective actions targeting workflow design, inventory management, staff communication, and standardized procedures. Blood grouping TAT fell 66.7 percent, turnaround compliance for Coombs tests and crossmatching reached 100 percent, telephone interruptions and their lost time fell 70 percent, and sample rejections dropped from 78 to 11 per month [1].
Check the balancing metrics before declaring victory: rejection rates, error reports, overtime, and add-on requests. A laboratory that gets faster by skipping checks has not improved. If volume changed between periods, compare percentiles rather than raw counts.
Step 8: Standardize, Visualize, and Sustain
Write the one-page standard work for each changed task and post it at the bench. Hold a daily 10-minute huddle at a visual board showing yesterday's primary metric, today's plan, and one open problem. Layer the audits: the lead checks daily for the first two weeks, the supervisor weekly, the sponsor monthly. Re-measure at 60 and 90 days, because gains that survive 90 days are the ones that count. Feed any drift back into the charter as a new problem statement. That loop is how a one-off project becomes a management system.
Lean Laboratory Management Tips
- Go to the gemba. Gemba is the Japanese term for the actual place where work happens. Watch one full shift before proposing anything.
- Attack the constraint first. An hour saved at a non-bottleneck is an hour the customer never sees.
- Shrink batches. Small batches cut waiting far more than they cost in setup, especially for specimen transport and sign-out.
- Make queues visible. A whiteboard row or a dashboard tile beats a queue hiding in a rack.
- Store at point of use. Daily reagents live at the bench, backup stock lives in one labeled place.
- Timebox improvement. Fifteen minutes at the daily huddle, one countermeasure at a time.
- Freeze the metric definition. Write down what counts as receipt and release, and which cases are excluded.
- Count defects and speed together. A faster laboratory that rejects more samples is a worse laboratory.
- Keep timestamp data clean, because it compounds. Deep learning models trained on timestamped workflow phases predicted the end time of cardiac catheterization laboratory procedures with mean absolute errors below 5 minutes [9]. Clean data is the entry ticket to that kind of scheduling.
Common Mistakes and Limitations
- Mapping from memory. Recalled processes are averages of what people believe. The gaps between belief and stopwatch observation are where the waste hides.
- Optimizing a step that is not the constraint. The histopathology study in Step 5 found sign-out, not tissue processing, consumed the largest share of TAT. Speeding a non-constraint changes nothing the customer feels.
- Running lean as a staffing cut. If staff believe mapping leads to layoffs, they will hide waste rather than expose it. State explicitly what happens with freed time.
- One-and-done events. An improvement week without audits, huddles, and a re-measurement date drifts back. Schedule the 60- and 90-day re-audits before the project closes.
- Metric sprawl. Twelve dashboards nobody reads. Keep one primary metric and two or three balancing metrics.
- Batching for equipment efficiency. Running the analyzer at full batches maximizes machine utilization and doubles specimen waiting. Level the load instead.
- Copying another laboratory's solution. Their constraint is not yours. Borrow the method, not the countermeasure.
- Inventory creep. Kanban cards get ignored during busy weeks and stockpiles return. Audit bin counts weekly.
- Bypassing the quality system. Changed workflows, forms, and standard work are controlled documents in an accredited medical laboratory under standards such as ISO 15189 and CLSI guidance. Route them through document control like any other change.
- Changing the metric mid-project. If the definition of turnaround shifts after baseline, the before-and-after comparison is dead. Freeze the definition in the charter.
On limitations: lean improves flow and reliability. It does not repair a failing assay, replace analytical validation, or substitute for the laboratory's quality management system. Published results come from specific settings, including blood centers, histopathology services, and instrument pools, so treat their numbers as evidence the method works rather than targets your laboratory is guaranteed to hit. Results depend on local data, and where patient care decisions depend on the workflow, keep your laboratory director and quality manager involved throughout.
Frequently Asked Questions
What is lean laboratory management?
Lean laboratory management is the application of lean thinking to laboratory work. It defines value from the customer's perspective, maps and measures the workflow, removes waste such as waiting, motion, excess inventory, and defects, and holds the gains with standard work.
How is Lean different from Six Sigma?
Lean removes waste and improves flow, while Six Sigma reduces variation and defects using statistical tools. Lean Six Sigma combines the two, which is why many laboratory improvement projects run under that combined name.
Which metric should a laboratory track first?
Start with 90th-percentile turnaround time and first-pass yield. The first captures the slow tail that users feel, and the second captures rework such as rejected samples and repeat runs.
How long does a lean laboratory project take?
A focused project runs about 8 to 12 weeks from baseline data to verified results. A Rapid Process Improvement Workshop compresses the analysis and initial testing into roughly one week, with follow-up afterward.
Do I need special software to start lean laboratory management?
No. A spreadsheet, clean timestamps, and a wall for the process map are enough to start. Dashboards, digital tracking, and predictive scheduling become useful once the basic measurement discipline exists.
How do I get bench staff on board with a lean project?
Involve the people who do the work in mapping and countermeasure design, show the baseline data before proposing anything, and make the first win visible on a board everyone sees.
Does lean work in research laboratories, not just clinical ones?
Yes. The same mapping and waste analysis apply to assay batches, sample logistics, and equipment scheduling. Swap turnaround time for experiment cycle time or assay failure rate and the method transfers.
What is a Rapid Process Improvement Workshop?
It is a structured, multi-day lean event in which a cross-functional team maps a process, tests countermeasures at the bench, and leaves with implemented changes and a follow-up plan. Healthcare programs use it to standardize workflows across many sites.
Sources
- "Waste Minimization and Workflow Optimization in Immunohematology Laboratory: A Prospective Interventional Study Using Lean Six Sigma Methodology in a Tertiary Care Blood centre".
- Development of a Robust Point of Care Testing Program in Newfoundland and Labrador Using Lean Method of Rapid Process Improvement Workshop (RPIW).
- Optimizing IVF lab workflows through data-driven insights: associations between lab management, procedural timings, and workload with blastulation rates.
- Histopathology turnaround time analysis: identifying bottlenecks and implementing mitigation strategies in a multi-site laboratory.
- Development of a prosthodontic workflow tracking system to improve delivery efficiency in clinic-laboratory transfers.
- Optimising intensive care unit efficiency: A touchscreen-based bedside dashboard for real-time data management.
- Ring, Remind, Report: A telephone-based intervention to optimize laboratory monitoring adherence among psychoactive medication users.
- Lean Management of Surgical Instruments in Multidisciplinary Collaboration: Practice Research With Multidimensional Evaluation of Cost and Quality.
- Deep learning methods for clinical workflow phase-based prediction of procedure duration: a benchmark study.