How to Create a Lab Workflow Diagram: A Step-by-Step Guide
By Dr. Zubair Khalid, DVM, MS, PhD ·

By the end of this guide you will be able to build a lab workflow diagram that reflects what actually happens at your bench, attach realistic timing data to each step, use the diagram to locate bottlenecks, and keep it updated as protocols change. You will need a way to interview the people who do the work, a diagramming tool such as draw.io, Lucidchart, Visio, or a text-based option like Mermaid or PlantUML, and access to timestamps from your laboratory information management system (LIMS) if you want quantitative metrics.
A lab workflow diagram is a visual map of the sequence of tasks, decisions, handoffs, and actors in a laboratory process, from sample receipt to final report or archived result. Done well, it becomes the backbone of research project management for your team. It feeds directly into scheduling, training, quality documentation, and any research project plan template you maintain, because every planned experiment is really a set of workflow steps with owners and deadlines.
Why Bother Mapping the Workflow
Laboratory work is full of invisible steps. Reagents get aliquoted, samples wait in queues, results wait for sign-off. When these steps live only in people's heads, onboarding takes months, protocols drift between operators, and managers cannot see where time is lost.
Process modeling research in laboratory automation shows why the diagram itself matters. Work on model-driven laboratory automation found that easy-to-read graphical process models, written in the Business Process Model and Notation (BPMN) standard, standardize laboratory workflows and allow processes to be changed quickly as requirements shift, while also supporting process-controlled documentation for quality assurance [1]. BPMN, which is a graphical notation for business processes using standardized symbols for tasks, events, and gateways, gives lab teams a shared language that survives personnel turnover.
Workflow diagrams also have a measurable connection to outcomes. A retrospective analysis of 7,986 ICSI cycles at a private IVF center found that neither total procedure count nor workload per operator affected blastulation rates. Instead, each additional hour in the interval from ovulation trigger to oocyte denudation, within a 36 to 44 hour window, was associated with a measurable decline in outcomes, especially beyond the 40 hour threshold [2]. The lesson generalizes. Timing structure, not just workload, drives quality. You cannot manage timing structure you have not mapped.
Before You Draw Anything: Collect Ground Truth
The single biggest cause of useless workflow diagrams is drawing the workflow as it is written in the standard operating procedure (SOP) rather than as it is performed. Documentation researchers solved this problem with a method called contextual inquiry, a qualitative, user-centered technique for collecting detailed data about work practices through structured interviews and observation.
In a workflow assessment done before a digital pathology implementation for the US Air Force Medical Service, a pathology-centered observer team conducted 1.5 hour interviews with 24 pathologists and histology laboratory personnel across four sites. They recorded over 1,200 notes and grouped them into an affinity diagram, which is a hierarchical clustering of observations into common themes, and then consolidated those themes into graphic models of work practices, structure, and requirements [3]. That diagram captured the real process, including the workarounds that never appear in any SOP.
Adopt the same discipline for your lab:
- Interview each person who touches the process. Ask them to walk you through their last shift, not their ideal shift.
- Shadow the bench where practical. Note interruptions, waiting periods, and handoffs between people or instruments.
- Write one observation per sticky note or index card, then cluster them into themes. This is the affinity diagram step. Clusters that collect many notes are usually the steps that matter most.
- Reconcile the observed process against the written SOP. Every mismatch is either a compliance problem or a documentation problem. Flag it either way.
Only after this step should you open a drawing tool.
Choosing a Notation
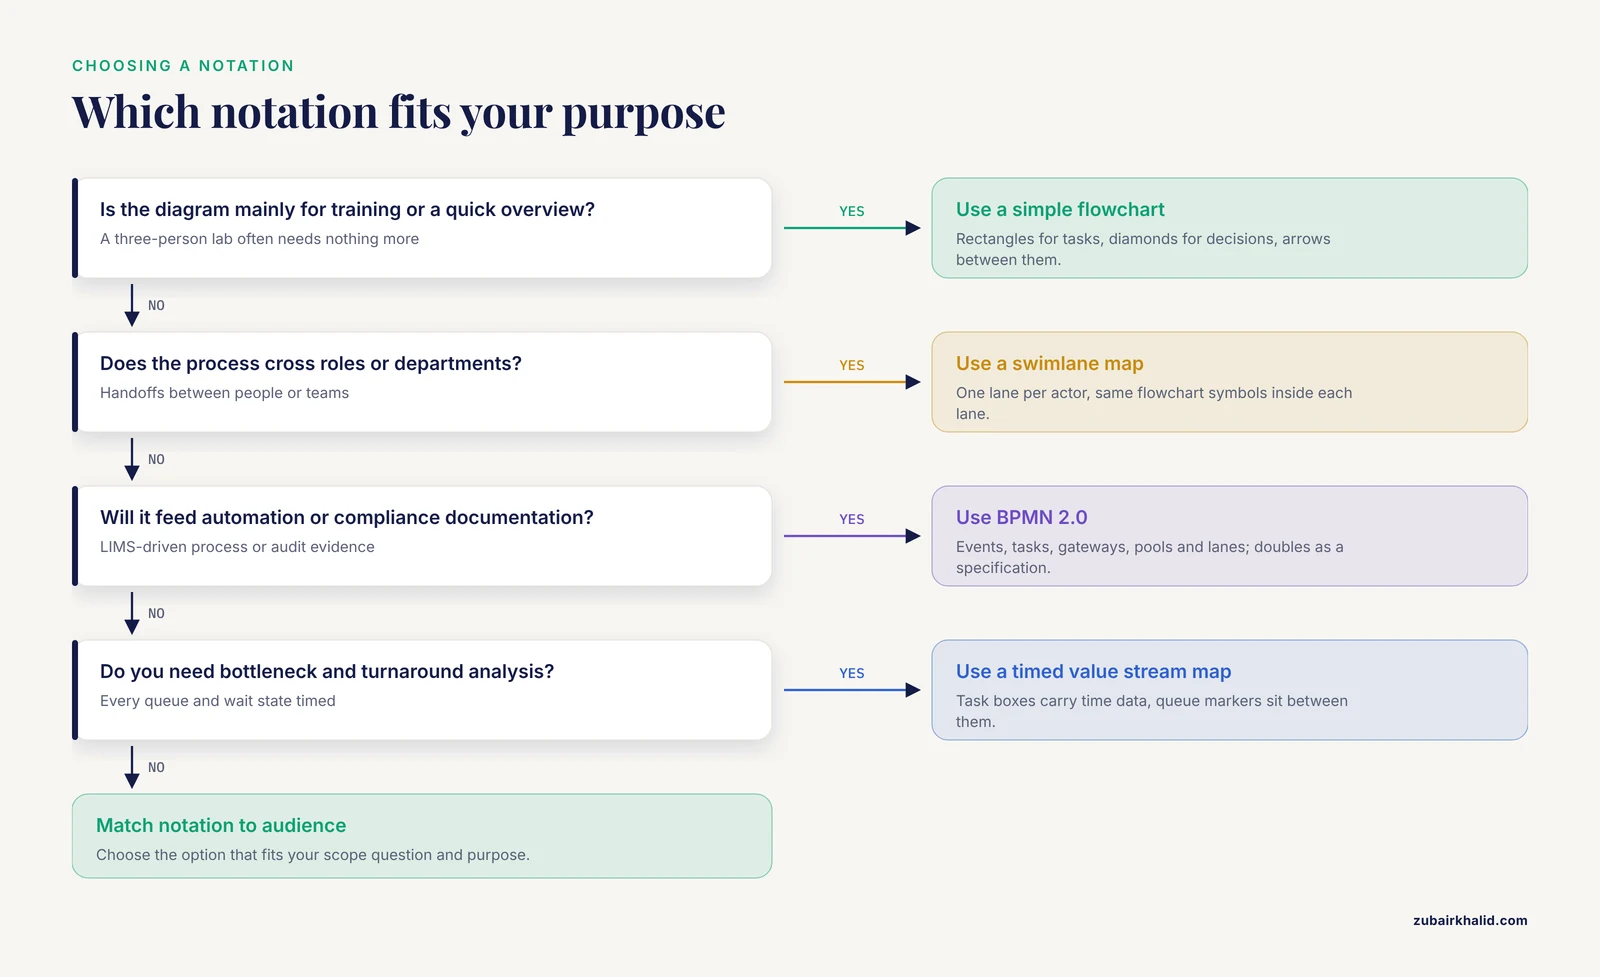
You have four practical options, and the right choice depends on audience and purpose.
| Notation | Best for | Symbols you need | Relative effort |
|---|---|---|---|
| Simple flowchart | Training new staff, quick overviews | Rectangles (tasks), diamonds (decisions), arrows | Low |
| Swimlane (cross-functional) map | Processes crossing roles or departments | Lanes for each actor, same flowchart symbols | Low to medium |
| BPMN 2.0 | Automation, compliance documentation, complex end-to-end processes | Events (circles), tasks (rounded rectangles), gateways (diamonds), pools and lanes | Medium to high |
| Value stream style map with timing | Bottleneck and turnaround analysis | Task boxes with time data, queue markers between them | Medium |
BPMN 2.0 deserves special mention because it doubles as an executable specification. Experience applying BPMN to laboratory automation shows it works as a system-independent, cross-disciplinary graphical language for documenting laboratory methods such as screening procedures and analytical processes, and that process models can host work procedures and their scheduling in compliance with predefined guidelines and policies [1]. If your lab intends to connect the diagram to automation software or a LIMS-driven process later, start with BPMN. If you just need clarity for a three-person lab, a swimlane flowchart is enough.
The Step-by-Step Walkthrough
This walkthrough builds a worked example for a clinical molecular diagnostics lab processing samples for quantitative PCR (qPCR), but the steps apply to any wet lab, core facility, or analytical process.
Step 1: Define the Scope and the Question
Write one sentence stating what the diagram must answer. Examples:
- "Where does sample turnaround time go, and can we cut it by one day?"
- "Which steps must a new technician master in week one?"
- "Which steps need dual sign-off for our accreditation audit?"
Scope decisions follow from the question. A bottleneck analysis needs every queue and every wait state. A training diagram can collapse repetitive steps into one box. Draw nothing outside the scope, and state the boundary explicitly, for example, "specimen receipt through report release, weekdays only."
Step 2: Build a Task Inventory
List every step with its actor, typical duration, inputs, outputs, and whether it is a decision point. A plain spreadsheet works, and it doubles as source material for a research project plan template later. Here is a worked inventory in CSV form:
step_id,step_name,actor,typical_duration_min,input,output,is_decision
1,Specimen accessioning,Lab technician,10,Specimen + requisition,LIMS record,N
2,Nucleic acid extraction,Lab technician,90,Specimen,Extracted DNA,N
3,Extraction QC check,Senior technologist,15,Extracted DNA,Pass or fail,Y
4,[qPCR plate setup](/knowledge/diagnostics/molecular/qpcr-plate-setup-best-practices-reproducible-results),Lab technician,60,Extracted DNA + reagents,Loaded plate,N
5,qPCR run,Thermal cycler,120,Loaded plate,Amplification data,N
6,Data analysis and review,Analyst,30,Amplification data,Reviewed result,Y
7,Report release,Pathologist or director,20,Reviewed result,Signed report,N
Realistic durations matter more than precise ones at this stage. A time estimate gathered by watching two runs beats a guess gathered from memory.
Step 3: Draft the Diagram
Open your tool and lay the main path left to right or top to bottom. Add decision diamonds wherever the inventory shows an is_decision row of Y. Add off-path branches for failures and rework, because rework loops are where time quietly disappears.
If you use a text-based tool like Mermaid, the draft for the example looks like this:
flowchart TD
    A[Specimen accessioning] --> B[Nucleic acid extraction]
    B --> C{Extraction QC pass?}
    C -- Yes --> D[qPCR plate setup]
    C -- No --> B2[Re-extract specimen]
    B2 --> C
    D --> E[qPCR run]
    E --> F{Analysis reviewed and accepted?}
    F -- Yes --> G[Report release]
    F -- No --> D
A text-based diagram like this has one large advantage in research settings. It lives in version control alongside your protocols, so every protocol change can come with a reviewed diagram change in the same pull request.
Step 4: Mark Queues, Handoffs, and Wait States
Queues are intervals where nothing happens to the sample. They rarely appear in SOPs and they dominate total turnaround. Walk the bench and mark every place a sample waits for a person, an instrument, a batch to fill, or a signature. Add these as annotated nodes between tasks.
Step 5: Attach Timing Data
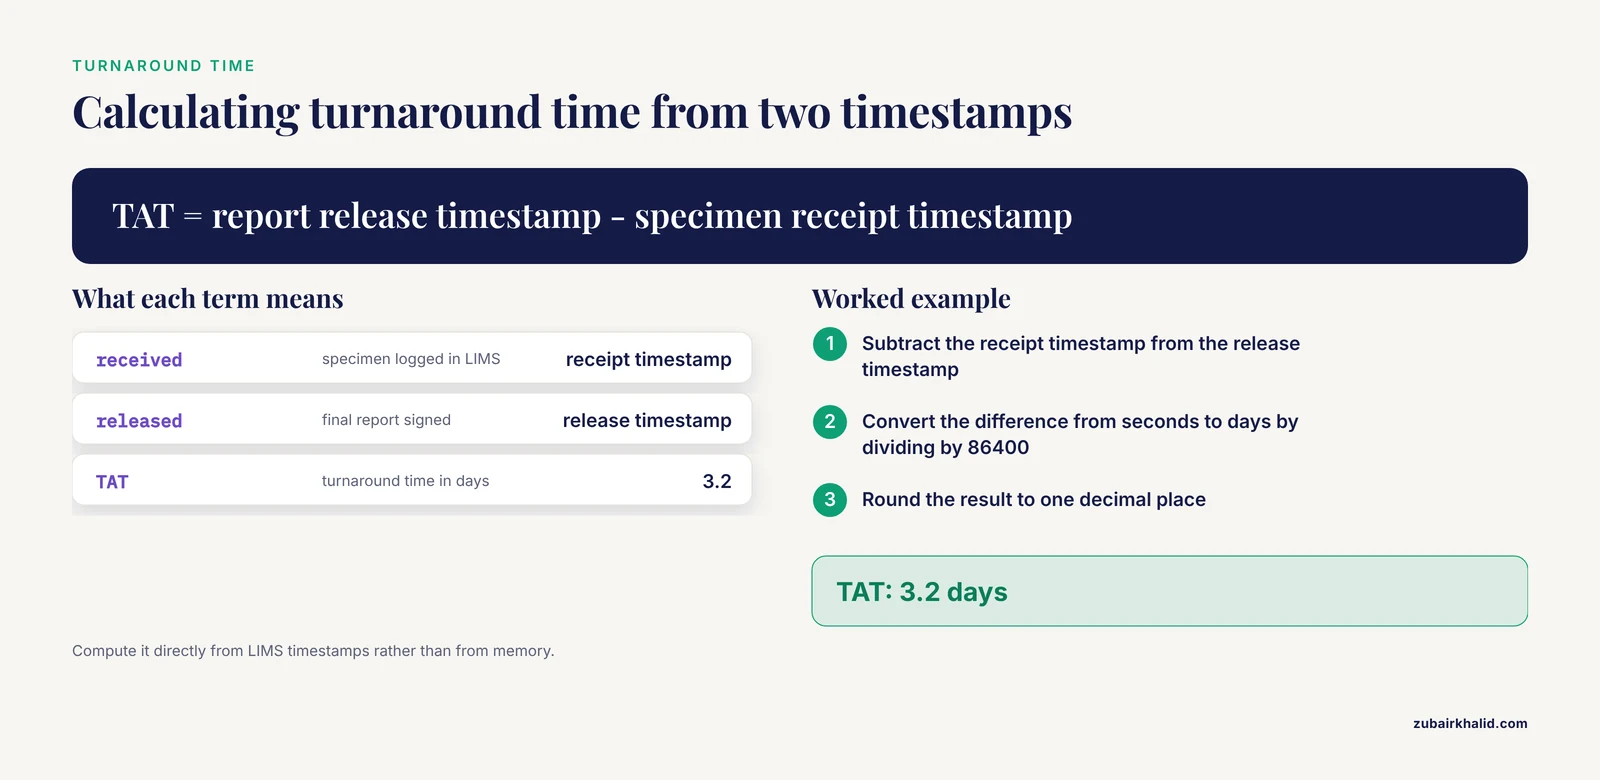
Now connect the diagram to measurements. The standard end-to-end metric in clinical and analytical laboratories is turnaround time (TAT), defined as the interval between specimen receipt and final report release. Studies of laboratory performance compute it directly from timestamps in the laboratory information system.
You can reproduce the calculation from two timestamps with a few lines of Python:
from datetime import datetime

received = datetime(2026, 1, 12, 9, 30)   # specimen logged in LIMS
released = datetime(2026, 1, 15, 14, 0)   # final report signed

tat_days = (released - received).total_seconds() / 86400
print(f"TAT: {tat_days:.1f} days")
Expected output:
TAT: 3.2 daysOnce you have per-step timestamps, the key formulas fit in one table.
| Metric | Formula | Interpretation |
|---|---|---|
| Total TAT | Report release timestamp minus specimen receipt timestamp | End-to-end speed for a case type |
| Stage share of TAT | Duration of one stage divided by total TAT, times 100 | Where the delay lives |
| Delay incidence | Delayed episodes divided by total episodes, times 100 | Reliability of the schedule |
| Mean delay per delayed episode | Sum of delayed days divided by number of delayed episodes | Severity when things slip |
Published data shows what these metrics reveal. A turnaround time analysis at a multi-site histopathology laboratory, using a random sample of 97 cases and 556 tissue blocks, found that 87.5 percent of diagnostic biopsy cases met a two day benchmark and 81.3 percent of routine surgical cases met a five day target, with average TAT of 1.6 days for biopsies and 3.3 days for surgical specimens. The largest single contributor was the pathologist sign-out stage at 1.7 days, and ancillary testing added further delay [4]. A diagram without timing data would have shown a flat sequence of tasks. The timing data exposed a specific, targetable stage.
Timing analysis can matter even more directly for sample quality. In the IVF laboratory study cited earlier, the workflow interval from trigger to denudation, not operator workload, was what tracked with outcomes, which is exactly the kind of relationship a timed workflow diagram is designed to surface [2].
Step 6: Validate With the People Who Do the Work
Walk the draft diagram back through the technicians, analysts, and supervising scientists who perform the process. Ask three questions at each node:
- Does this happen every time, or only sometimes?
- What happens when this step fails?
- Who covers this step when you are out?
Revise until the people on the bench agree the diagram describes a typical week, including its exceptions. Unvalidated diagrams decay into wall decoration.
Step 7: Put the Diagram to Work
A validated, timed diagram supports several concrete uses:
- Bottleneck targeting. Rank stages by their share of total TAT and attack the largest one first. In the histopathology example, the sign-out stage pointed directly at pathologist scheduling and case batching as the highest-value interventions [4].
- Checkpoint tracking. Convert each diagram node into a checkpoint with a timestamp. A digital workflow tracking system built for prosthodontic clinic-laboratory transfers did exactly this, recording time-stamped scans at predefined checkpoints with automated overdue alerts. Delay incidence fell from 52.9 percent under a paper-based workflow to 17.9 percent under the digital system, and mean delayed days per episode fell from 5.83 to 3.12 [5]. The design principle transfers to any lab. Every node in your diagram is a candidate checkpoint.
- Reminder and escalation loops. Where the diagram shows a step that stalls without a prompt, add a standardized reminder. A nurse-driven telephone reminder protocol before scheduled laboratory appointments cut no-show rates from 33 percent to 19 percent over six weeks [6]. The lab equivalent is an automated LIMS or email nudge at any node with a history of waiting.
- Predictive scheduling. Once a workflow is instrumented with timestamps, the phase sequence itself becomes predictable. Deep learning models trained only on clinical phase sequences from a cardiac catheterization laboratory predicted procedure end times with mean absolute error below 5 minutes and symmetric mean absolute percentage error under 6 percent at 60 second sampling intervals, with the CNN-based InceptionTime model performing best [7]. That level of modeling is beyond most academic labs, but it illustrates the ceiling. A well-structured workflow diagram is the substrate for any future automation or forecasting effort.
Step 8: Version and Maintain the Diagram
Date every revision, store the source file in a shared repository, and review the diagram quarterly or after any protocol change, instrument change, or staffing change. Treat the diagram like a living document, not a one-time deliverable. If you keep it in a text format under version control, the commit history becomes an audit trail of process evolution, which auditors and collaborators appreciate.
Common Mistakes and Limitations
- Mapping the SOP instead of the practice. The observed process, including workarounds, is the real one. The Air Force pathology assessment found this gap only because investigators interviewed and observed rather than read documents [3].
- Forgetting the queues. Newcomers draw only the tasks. Waiting between tasks is frequently the larger share of total time, as the sign-out finding in histopathology demonstrates [4].
- Omitting failure paths. Rework loops, failed QC, and re-extractions consume real time. Leave them off and your timing math will never reconcile with reality.
- Collecting timing data for one heroic week. A single good week understates delay. Sample across weeks, and account for weekends explicitly, as the histopathology TAT study did by excluding weekends from its TAT definition [4].
- Treating workload as the problem by default. The IVF data showed workload per operator did not track with outcomes while timing intervals did [2]. Before you conclude "we need more staff," check whether the delay is structural, such as a batching rule or a signature queue.
- One diagram for every audience. A manager's bottleneck map and a trainee's task map are different documents drawn from the same task inventory. Do not force one to serve both.
- Letting the diagram go stale. An outdated diagram is worse than none, because people trust it. Assign ownership and a review date.
One limitation applies to any diagram you build. It describes aggregate process, not individual cases. A diagram that says extraction takes 90 minutes does not tell you why one stubborn sample took four hours. Individual troubleshooting needs the actual sample and the actual run record.
Next Steps
Once your first diagram is validated and timed, connect it to the rest of your research project management. Import the task inventory into your lab's project plan so each workflow node gets an owner and a due date. Add checkpoints with overdue alerts if your LIMS or a lightweight tracking tool supports them. Re-measure TAT after each intervention and compare against your baseline. Workflow mapping is a cycle, not a project, and the second revision is always faster and more accurate than the first.
Frequently Asked Questions
What is a lab workflow diagram?
A lab workflow diagram is a visual map of the tasks, decisions, handoffs, and waiting points in a laboratory process, from sample receipt through final reporting. It shows who performs each step, in what order, and what happens when a step fails.
Which notation should I use for a lab workflow diagram?
Use a simple flowchart for training and overviews, a swimlane map when multiple roles or departments are involved, and BPMN 2.0 when the diagram must support automation, compliance documentation, or complex end-to-end processes. Match the notation to the audience rather than defaulting to the most elaborate option.
What software is best for drawing a lab workflow diagram?
draw.io (diagrams.net) is free and capable, Lucidchart and Visio are common commercial choices, and Mermaid or PlantUML suit labs that want diagrams under version control. BPMN-specific modelers such as Camunda Modeler are appropriate if you plan to connect diagrams to process automation.
How detailed should a lab workflow diagram be?
Detailed enough to answer the question you defined in step 1, and no more. A bottleneck analysis needs every queue and wait state, while a training overview can collapse routine substeps into single boxes.
How do I find bottlenecks using a workflow diagram?
Attach real timestamps to each node, compute each stage's share of total turnaround time, and rank stages from largest to smallest share. The histopathology example found pathologist sign-out consumed 1.7 of the average days, which pointed interventions at scheduling and case batching rather than bench work.
How often should a lab workflow diagram be updated?
Review it quarterly, and always after a protocol change, new instrument, staffing change, or audit finding. Store it with a revision date and a named owner so staleness is visible.
Can a lab workflow diagram feed into a research project plan template?
Yes. The task inventory behind the diagram, with actors, durations, inputs, and outputs, is effectively a prebuilt research project plan template. Copy the rows into your planning tool, assign owners and dates, and the plan inherits the accuracy of the diagram.
Do I need special training to use BPMN for lab workflows?
No certification is required to draw useful BPMN diagrams, though the notation has more symbols than a plain flowchart and benefits from a short tutorial. Start with a small subset of the notation, using events, tasks, gateways, and lanes, and expand only when a process genuinely requires it.
Sources
- Improved compliance by BPM-driven workflow automation.
- Optimizing IVF lab workflows through data-driven insights: associations between lab management, procedural timings, and workload with blastulation rates.
- Needs and workflow assessment prior to implementation of a digital pathology infrastructure for the US Air Force Medical Service.
- Histopathology turnaround time analysis: identifying bottlenecks and implementing mitigation strategies in a multi-site laboratory.
- Development of a prosthodontic workflow tracking system to improve delivery efficiency in clinic-laboratory transfers.
- Ring, Remind, Report: A telephone-based intervention to optimize laboratory monitoring adherence among psychoactive medication users.
- Deep learning methods for clinical workflow phase-based prediction of procedure duration: a benchmark study.