Scientific Writing Template for Lab Reports
By Dr. Zubair Khalid, DVM, MS, PhD ·
By the end of this guide you will be able to produce a complete lab report in the standard scientific format, fill in a reusable template section by section, run the two calculations almost every lab report needs (a dilution calculation and a descriptive statistics summary), and keep a lab notebook that feeds directly into your report. To follow along you need a plain text editor (Notepad, TextEdit, or VS Code), a spreadsheet program such as Excel or Google Sheets, and the citation style guide your course or target journal requires.
Everything in this article is built around one reusable template. You can copy the template block below into your editor and use it as a free lab report template for any experiment, from a general biology practical to a graduate research project.
Why a Fixed Template Works
Editors and instructors read thousands of manuscripts, and they read faster and judge more fairly when every report puts the same information in the same place. Guidelines written for review journals make the underlying logic explicit. A well-structured manuscript needs a clear question, supporting figures and tables that carry real weight, and forward-looking interpretation rather than a rehash of past work. A template enforces exactly those habits on every report you write.
There is a second benefit. When your raw notes and your report share the same structure, nothing gets lost between the bench and the page. That is why this guide pairs the lab report template with a matching lab notebook format later on.
The Standard Lab Report Format (IMRaD)
Almost every scientific report in the life sciences follows the IMRaD structure: Introduction, Methods, Results, and Discussion. The full report adds a title, an abstract, and a reference list. Each section answers one reader question.
| Section | Reader question it answers | Typical length in a course report | Most common failure |
|---|---|---|---|
| Title | What did you test? | 10 to 15 words | Vague titles such as "Biology Lab 3" |
| Abstract | What did you find in one paragraph? | 150 to 250 words | Written last-minute with no numbers |
| Introduction | Why does this question matter? | 3 to 5 paragraphs | No testable hypothesis stated |
| Methods | How would someone repeat this? | 1 to 2 pages | Missing reagent amounts, models, and conditions |
| Results | What did you observe? | Text plus 1 to 3 figures or tables | Interpretation mixed into the data |
| Discussion | What does it mean? | 3 to 5 paragraphs | Ignoring results that do not fit |
| References | Where did your ideas come from? | Every cited source | Citations missing from claims |
Title
A good title names the organism or system, the variable you manipulated, and the outcome you measured. Compare "Enzyme Lab" with "Effect of Temperature on Alkaline Phosphatase Activity in Bovine Intestinal Mucosa". The second title tells a reader scanning a database exactly what to expect.
Abstract
Write the abstract last. In four sentences, state the question, the core method, the headline result with its key number, and the main conclusion. Reviewers of structured scientific papers increasingly expect abstracts to follow a defined framework rather than free prose, a convention you see across scoping reviews and protocols in the current literature.
Introduction
The introduction moves from broad context to your specific question in three moves. First, establish why the topic matters. Second, summarize the two or three findings a reader needs in order to understand your experiment. Third, state your hypothesis as a testable statement.
A practical trick used by strong scientific writers is to organize the introduction around explicit questions the paper will answer. A diet-science review published in the Journal of the International Society of Sports Nutrition, for example, lists its sixteen questions up front and then addresses each in turn with evidence. You can borrow that device at small scale. End your introduction with numbered questions or a single hypothesis, then make sure your Results section answers each one.
Methods
The test for this section is simple. A competent classmate should be able to repeat your experiment using only your Methods text. Include the organism or sample source, the equipment model, reagent concentrations, volumes, incubation times, temperatures, and the statistical test you planned. Write Methods in past tense because the work is already done.
If your experiment was part of a larger registered or protocol-driven project, say so and cite the protocol. Large evidence syntheses now publish their protocols before collecting data, and report them against a named standard such as PRISMA-P, the Preferred Reporting Items for Systematic Review and Meta-Analysis Protocols. Even a course experiment benefits from a short "planned analysis" sentence in Methods.
Results
Report observations, not opinions. Every figure and table must be called out in the text, and every claim must be tied to a number. Keep interpretation out. "Mean absorbance at 600 nm increased from 0.12 to 0.84 over 8 hours" belongs here. "This shows bacteria grow faster at 37 degrees" belongs in the Discussion.
Discussion
Move in the reverse direction of the introduction, from your specific result back out to the broader context. A four-part structure works reliably:
- Restate your main finding in one sentence with its key number.
- Compare it to published values and explain agreement or disagreement.
- Name the two or three largest sources of error and how they shaped your conclusions.
- State what a follow-up experiment should test.
Guidelines for review articles in the environmental radioactivity literature stress that a synthesis should end by pointing to concrete future directions rather than simply restating references. Apply the same standard to a lab report discussion. An analysis of science-policy bodies similarly found that credibility rests on transparency about how evidence was gathered and judged, which is a useful reminder that honest error analysis strengthens a report rather than weakening it.
A Copy-Ready Scientific Writing Template for Lab Reports
The block below is a complete lab report template in Markdown. Save it as a plain text file named lab-report-template.md and fill it in from top to bottom. Because it is plain text, it converts cleanly into Word, Google Docs, or LaTeX, and you can reuse it for free for every report you write.
# [Descriptive title: system + variable + outcome]

**Author:** [Your name]
**Course or lab:** [Name and number]
**Date performed:** [YYYY-MM-DD]
**Date submitted:** [YYYY-MM-DD]

## Abstract
[Question. Method in one sentence. Headline result with one number.
Main conclusion. 150 to 250 words total. Write this last.]

## Introduction
- [Background: why this system matters, 1 to 2 paragraphs]
- [Prior findings the reader needs, with citations]
- **Hypothesis:** [One testable statement]
- **Predictions:** [If hypothesis is true, then measurement X will do Y]

## Methods
### Materials
- [Organism or sample, source, strain or lot]
- [Equipment with model numbers]
- [Reagents with concentrations and suppliers]

### Procedure
 [Step, with volumes, temperatures, and times]
 [Step]
 [Step]

### Data analysis
- [Statistical test, software and version, significance threshold]

## Results
### Table 1. [Descriptive title]
| Condition | n | Mean | SD |
|---|---|---|---|
| [Condition A] | | | |
| [Condition B] | | | |

Figure 1. [One-sentence caption that states what the panel shows.]

### Key observations
 [Observation with number, no interpretation]
 [Observation with number]

## Discussion
 [Main finding restated with the key number]
 [Comparison with published values, with citations]
 [Limitations: two or three named error sources]
 [Follow-up experiment]

## Numbered Walkthrough: Filling the Template with a Worked Example

This walkthrough uses a common teaching experiment, measuring the growth of *Escherichia coli* at two temperatures by absorbance at 600 nm (OD600, the optical density of a culture at 600 nm, which rises as cell density rises). Every step generalizes to your own experiment.

### Step 1. Record raw data in the notebook during the session

Use a matching plain-text notebook file. Many university teaching labs distribute their own lab notebook template as a PDF with preprinted grids, but a text version travels better across devices and version control.
LAB NOTEBOOK - Entry 2026-11-04
Objective
Compare E. coli growth at 25 C vs 37 C by OD600 over 8 h.
Setup
Strain: E. coli K-12, from department stock. Medium: LB broth, 50 mL per flask, 3 replicate flasks per temperature. Inoculum: 100 uL overnight culture into each flask (1:500 dilution).
Raw readings (OD600)
Time(h) | T25 flask1 | T25 f2 | T25 f3 | T37 f1 | T37 f2 | T37 f3 0 | 0.010 | 0.011 | 0.010 | 0.011 | 0.010 | 0.012 4 | 0.22 | 0.20 | 0.23 | 0.55 | 0.58 | 0.54 8 | 0.41 | 0.39 | 0.44 | 0.82 | 0.86 | 0.84
Notes
Incubator 2 recalibrated this morning. Blank = LB broth only.
### Step 2. Compute the summary statistics

For each condition and time point, calculate the mean and the standard deviation (SD), a measure of how far individual readings spread around the mean. The sample SD formula is:
SD = sqrt( sum of (each value - mean)^2 / (n - 1) )
Do this in a spreadsheet, or with a short Python script if you prefer a reproducible record:
import statistics as st
t8_25C = [0.41, 0.39, 0.44] t8_37C = [0.82, 0.86, 0.84]
for label, data in [("25 C, 8 h", t8_25C), ("37 C, 8 h", t8_37C)]: print(label, "mean =", round(st.mean(data), 3), "SD =", round(st.stdev(data), 3))
Expected output:
25 C, 8 h mean = 0.413 SD = 0.025 37 C, 8 h mean = 0.84 SD = 0.02
These two lines become the bottom row of Table 1 in your report.
### Step 3. Do the dilution calculation that goes in Methods
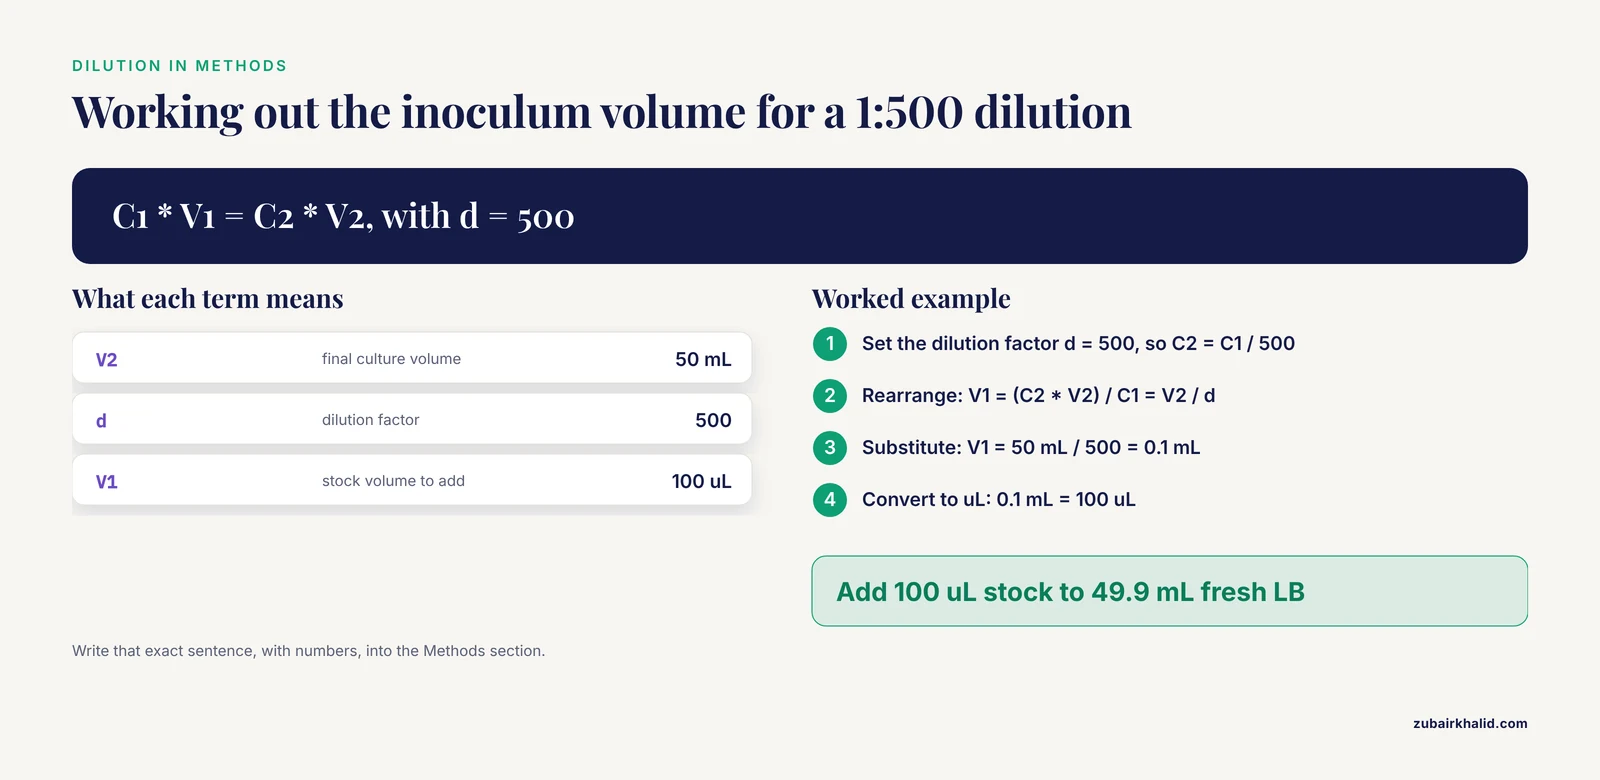
Your inoculation was a dilution, and Methods must state the ratio. Dilutions follow the relationship C1 × V1 = C2 × V2, where C is concentration and V is volume. Worked example: you want 50 mL of starting culture at a 1:500 dilution of the overnight stock, so how much stock do you add?
C1 V1 = C2 V2 Let the dilution factor d = 500, so C2 = C1 / 500 V1 = (C2 * V2) / C1 = V2 / d = 50 mL / 500 = 0.1 mL = 100 uL
Expected output:
Add 100 uL stock to 49.9 mL fresh LB for a 1:500 dilution.
Write that exact sentence, with numbers, into the Methods section.
### Step 4. Fill the template section by section
[2] **Title.** "Effect of Incubation Temperature on Growth of *Escherichia coli* K-12 Measured by OD600".
[1] **Abstract.** Draft four sentences: question (temperature effect on growth), method (OD600 at 0, 4, and 8 hours, three replicates per temperature), headline result (8 h mean OD600 of 0.84 at 37 C versus 0.41 at 25 C), conclusion (growth was faster at 37 C under these conditions).
[3] **Introduction.** Two background paragraphs on bacterial growth measurement, ending with the hypothesis: "E. coli K-12 reaches higher culture density at 37 C than at 25 C over an 8-hour window."
[5] **Methods.** Paste your notebook Setup block, the dilution sentence from Step 3, and a data-analysis sentence naming your software and the descriptive statistics you report.
[4] **Results.** Build Table 1 from your Step 2 output, write the Figure 1 caption ("Culture density of E. coli K-12 over 8 hours at 25 C and 37 C, mean of three flasks, error bars show SD."), and list the two or three key observations with numbers.
**Discussion.** Compare your OD600 values with published growth behavior of K-12 in LB, name your error sources (pipetting variability in inoculum size, single-blank spectrophotometer calibration, only two temperatures tested), and propose the follow-up (a full growth curve with more time points between 4 and 8 hours).
**References.** Add each source you actually cited, in your required style.
**Abstract last.** Revisit the abstract once Results and Discussion are final so the numbers match.
### Step 5. Check the result
Run this five-point check before submitting:
[2] Every figure and table is called out in the text at least once.
[1] Every number in the Abstract matches the corresponding number in Results exactly.
[3] Methods contain at least one temperature, one volume, one time, and one named statistical measure.
[5] The Discussion mentions at least two specific limitations.
[4] Every in-text citation has a matching reference entry, and vice versa.
## Keeping a Lab Notebook That Feeds the Report
A lab report is only as good as its raw record. The notebook template above follows the same IMRaD logic as the report, which makes transcription mechanical instead of error-prone. Three habits make the biggest difference:
[2] **Record at the bench, not afterward.** Write readings and conditions as they happen, including things that went wrong. A failed replicate that is written down can be discussed honestly. One that is forgotten becomes a mystery in your data.
[1] **Date every entry and never erase.** Draw a single line through mistakes and write the correction beside it. This convention, standard in laboratory practice, preserves the record of what actually happened.
[3] **Log reagent lots and equipment IDs.** Strain designations, lot numbers, and instrument models belong in the notebook so your Methods section can cite them later without a second trip to the bench.
If your institution provides a lab notebook template PDF with grid pages, use it for bench work and keep the text file as the digital counterpart. The two should contain the same content.
## Reporting Standards Worth Knowing
Structured reporting frameworks are converging across the life sciences, and knowing the major ones helps you borrow their habits even in short reports.
- **PRISMA.** The Preferred Reporting Items for Systematic Reviews and Meta-Analyses family governs evidence syntheses. A scoping review of lab-on-a-chip diagnostics in periodontology searched four databases from January 2015 to March 2026, screened 1,764 records, and included 20 studies, all reported under PRISMA-ScR with methodology from the Joanna Briggs Institute [2]. Its predefined data-extraction fields (technology type, target biomarker, sample matrix, performance, and technology readiness level) illustrate how a fixed field list keeps a synthesis honest and comparable.
- **PRISMA-P for protocols.** Systematic review protocols are now registered and reported against PRISMA-P before data collection begins, as in a registered protocol for a meta-analysis of virtual reality exercise interventions in university students [4]. The transferable lesson for any lab work is to write down your planned analysis before you see the data.
- **Frameworks before synthesis.** A scoping review informing the design of a United Nations antimicrobial resistance evidence panel built an explicit conceptual framework from prior governance literature before interpreting its findings [3]. In a lab report, the analogous habit is stating your hypothesis and predictions before Results.
- **Question-led structure.** Listing the questions a document will answer, then answering each in order, is a documented organizing device in review writing across fields [1] [5].
## Common Mistakes and Limitations
[2] **Writing the Results as a story instead of a report.** Results state what the data show, with numbers. Save cause and effect for the Discussion.
[1] **Mixing interpretation into Results.** If a sentence contains the word "because" or "suggests", it usually belongs in the Discussion.
[3] **Omitting negative and unexpected results.** Unexpected findings are part of the record. A Discussion that explains why a prediction failed is stronger than one that quietly drops the awkward data.
[5] **Missing units and replicates.** A mean without units or an n value cannot be interpreted or reproduced. Every table needs both.
[4] **Citing sources you never read.** Secondary citation inflates errors. Track down the original, or drop the claim.
**Treating the template as unbreakable law.** This article gives you a default. Your instructor's rubric or a target journal's author guidelines override any heading, length, or formatting suggestion here, so check them before you write. Individual course and journal requirements vary, and only the controlling document for your specific report settles them.
**Freehand notebook entries.** Loose observations on scrap paper do not survive to the Methods section. Anything not written in the notebook at the bench is effectively lost.
**Statistics chosen after seeing the data.** Decide the test in advance, and note it in Methods. Switching tests until something turns out "significant" is a recognized path to false findings.
## Checking Your Draft
Before submission, read the report in this order: Methods, Results, Abstract, Introduction, Discussion. Reading Methods and Results first forces you to check whether the claims in the Abstract are actually supported by what you did and found. Then verify the five-point checklist from the walkthrough. If a classmate can read your Methods section and tell you what you did without asking a question, the report is ready.
## Frequently Asked Questions
### What is the standard format for a scientific lab report?
The standard format is IMRaD: Title, Abstract, Introduction, Methods, Results, Discussion, and References. The template in this article follows that order and adds placeholders for tables, figures, and your hypothesis.
### How long should each section of a lab report be?
For a typical course report, aim for a 150 to 250 word abstract, a 3 to 5 paragraph introduction, 1 to 2 pages of Methods, Results sized to your figures and tables, and a 3 to 5 paragraph Discussion. Your course rubric overrides these defaults.
### Can I use first person in a lab report?
Yes, in most modern scientific writing, "we measured" or "I inoculated" is accepted and often clearer than passive voice. Follow your instructor's or journal's stated preference, and stay consistent throughout.
### Where do raw data go in a lab report?
Raw data stay in your lab notebook. The report presents summarized data, meaning means, standard deviations, and figures, and Methods describes how the summarization was done.
### What is the difference between Results and Discussion?
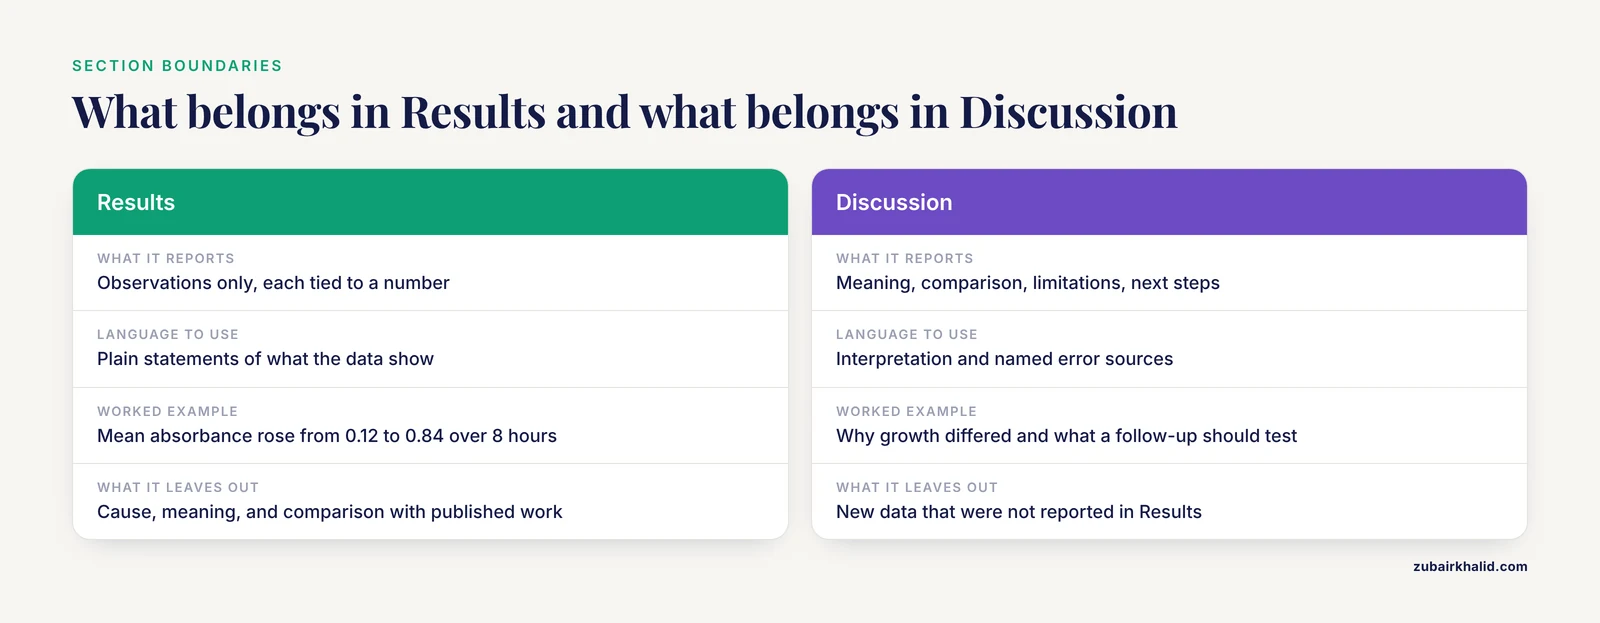
Results report observations with numbers and no interpretation. Discussion interprets those observations, compares them with published work, names limitations, and proposes next steps.
### How do I cite sources in a lab report?
Cite every borrowed fact in the text at the point it appears, then list all cited sources in a References section in the style your instructor or journal requires, such as APA, CSE, or a journal-specific format.
### Is there a free lab report template I can reuse?
Yes. The Markdown template in this article is free to copy and adapt for any lab report, and it converts cleanly into Word, Google Docs, or LaTeX without reformatting.
### How is a lab report different from a research paper?
A lab report demonstrates your understanding of an experiment, often with a graded rubric and allowed first-person voice. A research paper contributes new findings to the literature, passes peer review, and follows a specific journal's formatting and reporting standards.
<script type="application/ld+json">
{
"@context": "https://schema.org",
"@type": "FAQPage",
"mainEntity": [
{
"@type": "Question",
"name": "What is the standard format for a scientific lab report?",
"acceptedAnswer": {
"@type": "Answer",
"text": "The standard format is IMRaD: Title, Abstract, Introduction, Methods, Results, Discussion, and References. The template in this article follows that order and adds placeholders for tables, figures, and your hypothesis."
}
},
{
"@type": "Question",
"name": "How long should each section of a lab report be?",
"acceptedAnswer": {
"@type": "Answer",
"text": "For a typical course report, aim for a 150 to 250 word abstract, a 3 to 5 paragraph introduction, 1 to 2 pages of Methods, Results sized to your figures and tables, and a 3 to 5 paragraph Discussion. Your course rubric overrides these defaults."
}
},
{
"@type": "Question",
"name": "Can I use first person in a lab report?",
"acceptedAnswer": {
"@type": "Answer",
"text": "Yes, in most modern scientific writing, first person such as \"we measured\" is accepted and often clearer than passive voice. Follow your instructor's or journal's stated preference and stay consistent."
}
},
{
"@type": "Question",
"name": "Where do raw data go in a lab report?",
"acceptedAnswer": {
"@type": "Answer",
"text": "Raw data stay in your lab notebook. The report presents summarized data such as means, standard deviations, and figures, and Methods describes how the summarization was done."
}
},
{
"@type": "Question",
"name": "What is the difference between Results and Discussion?",
"acceptedAnswer": {
"@type": "Answer",
"text": "Results report observations with numbers and no interpretation. Discussion interprets those observations, compares them with published work, names limitations, and proposes next steps."
}
},
{
"@type": "Question",
"name": "How do I cite sources in a lab report?",
"acceptedAnswer": {
"@type": "Answer",
"text": "Cite every borrowed fact in the text where it appears, then list all cited sources in a References section in the style your instructor or journal requires, such as APA or CSE."
}
},
{
"@type": "Question",
"name": "Is there a free lab report template I can reuse?",
"acceptedAnswer": {
"@type": "Answer",
"text": "Yes. The Markdown template in this article is free to copy and adapt for any lab report, and it converts cleanly into Word, Google Docs, or LaTeX without reformatting."
}
},
{
"@type": "Question",
"name": "How is a lab report different from a research paper?",
"acceptedAnswer": {
"@type": "Answer",
"text": "A lab report demonstrates your understanding of an experiment, often with a graded rubric and allowed first-person voice. A research paper contributes new findings to the literature, passes peer review, and follows a specific journal's standards."
}
}
]
}
</script>
## Sources
1. [Guidelines to writing a review paper for the journal of environmental radioactivity.](https://pubmed.ncbi.nlm.nih.gov/42868643/)
2. [Transforming Diagnostic Precision in Periodontology Through Lab-on-a-Chip Technology: A Scoping Review.](https://pubmed.ncbi.nlm.nih.gov/43011417/)
3. [What can the Independent Panel on Evidence for Action against Antimicrobial Resistance learn from science policy-interfaces in global environmental governance? A scoping review and conceptual framework.](https://pubmed.ncbi.nlm.nih.gov/42950479/)
4. [Effects of immersive virtual reality-based physical activity interventions on anthropometric variables and physical fitness in university students: protocol for a systematic review and meta-analysis.](https://pubmed.ncbi.nlm.nih.gov/42855236/)
5. [Common questions and misconceptions about diets: what does the scientific evidence really show?](https://pubmed.ncbi.nlm.nih.gov/42879431/)