How to Organize the Results Section of a Lab Report
By Dr. Zubair Khalid, DVM, MS, PhD ·

By the end of this guide, you will be able to take the raw numbers from a biology lab session and turn them into a results section that any reader can follow without stopping to ask questions. You will know what belongs in results and what belongs in the discussion, how to order your findings, how to report summary statistics and test results, and how to build tables and figures that carry their own weight. You will also see how published researchers in different fields organize the same basic building blocks, so you can borrow their structure for your own reports.
To follow the worked example, have these on hand:
- Your raw data, either in a lab notebook or exported to a spreadsheet (Excel, Google Sheets, or LibreOffice Calc all work)
- A statistics tool. The examples below use R, which is free and available from the Comprehensive R Archive Network, but Python, GraphPad, SPSS, or even a spreadsheet can do the same job at this level
- Your assignment rubric or lab manual, because instructors often specify details such as decimal places, figure size, and whether raw data belongs in an appendix
- Your methods section in draft form, since the results should mirror it
Where the Results Section Fits in a Standard Lab Report Format
A standard lab report format has seven parts: title, abstract, introduction, methods, results, discussion, and references. The results section sits between methods and discussion, and the boundary between results and discussion is the single most common source of confusion for students learning how to write lab reports.
The division of labor is simple:
- Methods describes what you did and what you used.
- Results describes what you found. It contains observations, summary statistics, test statistics, tables, and figures.
- Discussion explains what the findings mean, how they compare with published work, and what the limitations are.
A practical test for any sentence in your results section: if the sentence could be debated, move it to the discussion. "Mean height in the fertilizer group was 6.79 cm" is a result. "Fertilizer improved growth because nitrogen limits photosynthesis" is interpretation, and it belongs two sections later. Some disciplines allow a short bridging sentence at the end of results that previews the interpretation, but unless your rubric allows it, keep results strictly descriptive.
The Three Containers: Text, Tables, and Figures
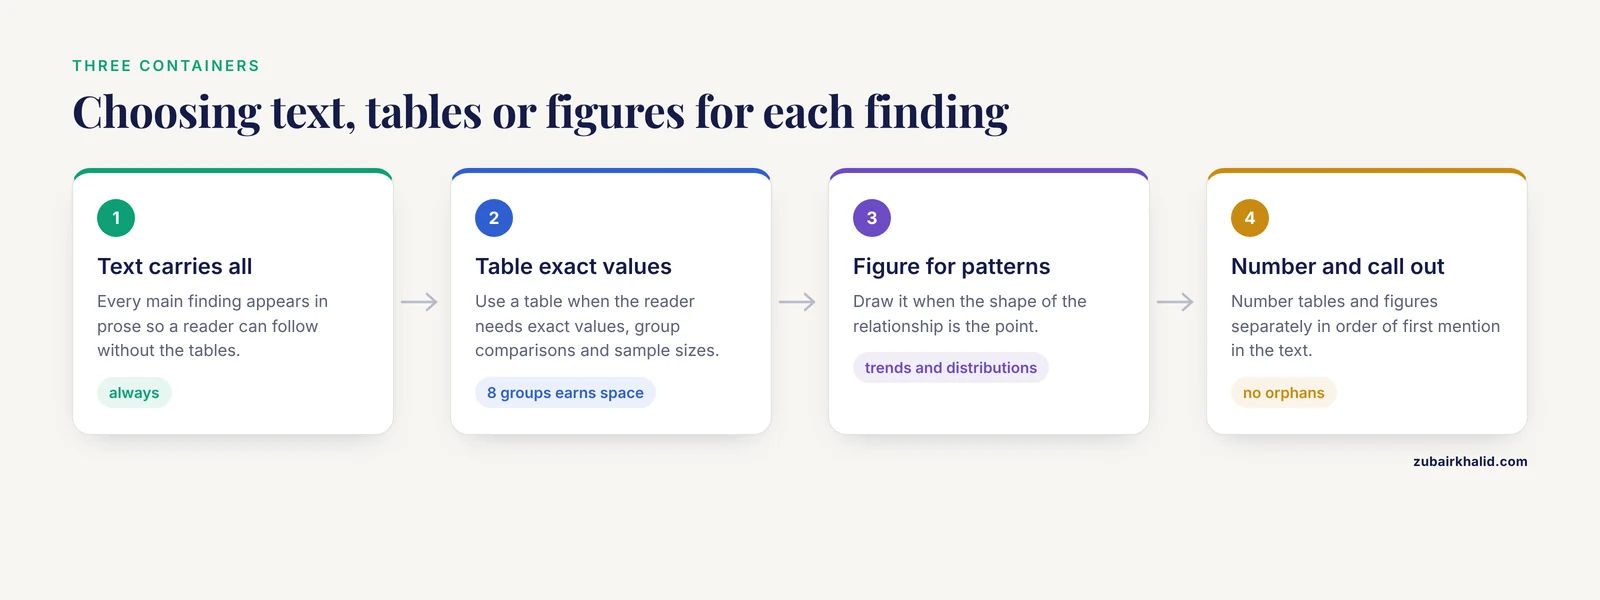
Every finding in your results section lives in one of three containers, and choosing the right container is half the work of lab report results section organization.
Text carries every result, including results that also appear in a table or figure. A reader should be able to understand your main findings from the prose alone, because many readers skim tables and figures first and read the text second.
Tables are for data the reader might want to look up: exact values, group-by-group comparisons, multi-variable summaries. A table presenting eight treatment groups with means, standard deviations, and sample sizes earns its space. A table with two numbers does not.
Figures are for patterns: trends across a condition, distributions, relationships between variables. If the point of the data is the shape of the relationship, draw it. If the point is the exact value, tabulate it.
Three rules bind all three containers together:
- Number tables and figures separately (Table 1, Table 2, Figure 1, Figure 2) in the order they are first mentioned in the text.
- Give each one a self-contained caption. A reader should understand the table or figure from its caption without reading the rest of the report, which means the caption states what was measured, the units, the sample size, and any abbreviation definitions.
- Call out every table and figure in the text, in numerical order. "Figure 1" that never appears in a sentence is an orphan, and graders notice orphans quickly.
Lab Report Results Section Organization Step by Step
The seven steps below take you from a raw data sheet to a finished results section. The worked example uses a classic undergraduate design: eight bean seedlings grown for 14 days with fertilizer and eight grown without, with height measured in centimeters.
Step 1: Inventory and Clean Your Raw Data
Open your spreadsheet and lay the data out with one row per replicate and one column per variable. Flag, but do not delete, suspect values. A seedling that dried out because its tray failed is a note for the discussion, not a quiet deletion.
In a spreadsheet, compute your first summary statistics directly:
=AVERAGE(B2:B9)
=STDEV.S(B2:B9)
=COUNT(B2:B9)
Expected output for the control group column, given the data below, is a mean of 4.8, a standard deviation of about 0.35, and a count of 8.
Control heights (cm): 4.2 4.8 5.1 4.5 4.9 5.3 4.6 5.0Write the sample size down now. One of the most common results-section errors is a sample size in the text that does not match the number of rows in the data.
Step 2: Choose an Order That Mirrors Your Methods
There is no single mandated order, but three ordering principles cover nearly every lab report, and you should pick one and apply it consistently:
- Mirror the methods. If your methods describe measuring germination rate first and final biomass second, present germination first and biomass second. This is the default for course reports because it lets a reader check your work step by step.
- General to specific. Open with the headline finding, then move through subgroups. Papers that must compress enormous datasets into a few pages often open their results with the headline numbers and then descend through strata. The Global Burden of Disease 2023 analysis of unintentional poisoning opens its results with global counts of incident poisonings, deaths, and disability-adjusted life-years for 2023, then moves to the long-term trend since 1990 and then to breakdowns by age, sex, region, and the Socio-demographic Index [1]. The same instinct scales down to a lab report: main comparison first, secondary comparisons after.
- By hypothesis or research question. If your introduction posed three questions, answer them in the same order.
Whatever you choose, do not organize results chronologically by when you happened to notice things at the bench, and do not organize them by which result you like best.
Step 3: Run the Analysis and Capture the Output
Decide what statistical test answers your question before you look for a flattering one. For two independent groups with roughly normal, similarly spread measurements, an independent-samples t-test is the standard choice.
In R, enter the data and run the test:
control <- c(4.2, 4.8, 5.1, 4.5, 4.9, 5.3, 4.6, 5.0)
fertilizer <- c(6.1, 6.8, 7.2, 6.4, 7.0, 6.6, 7.3, 6.9)

mean(control)
sd(control)
t.test(fertilizer, control, var.equal = TRUE)
The expected output looks like this:
        Two Sample t-test

data:  fertilizer and control
t = 10.44, df = 14, p-value = 4.4e-08
alternative hypothesis: true difference in means is not equal to 0
95 percent confidence interval:
 1.58 2.40
sample estimates:
mean of x mean of y
   6.788     4.800
Save this output. The values you will carry into your text are the two means, the standard deviations from the earlier commands, the t statistic (10.44), the degrees of freedom (14), the p-value (reported as p < 0.001 in most course reports), and optionally the 95 percent confidence interval for the difference (1.58 to 2.40 cm).
A quick note on what each parameter means, since these appear in nearly every results section you will ever write:
- Mean is the arithmetic average of the replicate values.
- Standard deviation (SD) describes how spread out the replicates are around the mean.
- n is the number of independent replicates, not the number of technical readings of the same replicate.
- t is the test statistic, the ratio of the observed difference to the variation around it.
- df is the degrees of freedom, which for this test is n₁ + n₂ - 2.
- p-value is the probability of seeing a difference at least this large if the true difference were zero. By convention, p < 0.05 is called statistically significant.
Step 4: Draft Each Paragraph With a Fixed Formula
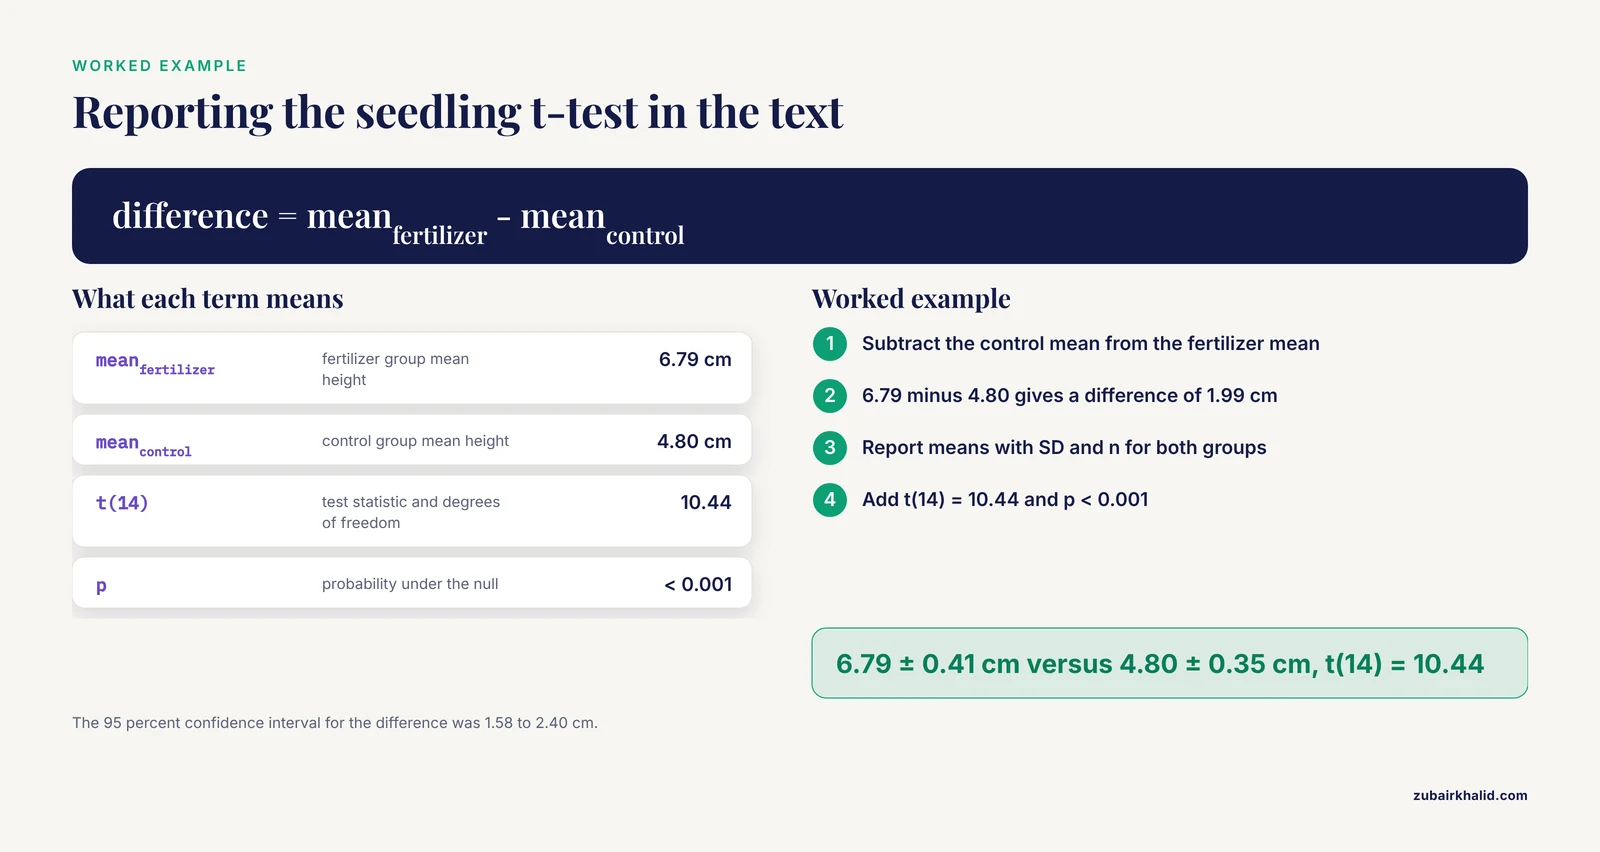
Each results paragraph follows the same four-part formula, and once you internalize it, drafting becomes mechanical:
- Topic sentence naming what was measured and what was compared, in past tense.
- The numbers: group means with their spread and sample sizes, in consistent units.
- The statistical statement: test statistic, degrees of freedom, p-value.
- The pointer to any table or figure that carries the same result.
Applied to the seedling example:
Fertilizer-treated seedlings were taller than control seedlings after 14 days (Figure 1). Mean height in the fertilizer group was 6.79 ± 0.41 cm (mean ± SD, n = 8) compared with 4.80 ± 0.35 cm in the control group (n = 8). An independent-samples t-test showed that the difference was statistically significant (t(14) = 10.44, p < 0.001).
Two formatting conventions matter here. First, state once per report how you are expressing variability, for example "mean ± SD," and then use it consistently. Second, keep the number of decimal places consistent with the precision of your instrument. If your ruler reads to the nearest millimeter, two decimal places in centimeters is defensible, three is not.
If your report contains more than one comparison, the next paragraph follows the same formula for the next comparison, in the order you settled in Step 2.
Step 5: Build Tables and Figures That Stand Alone
For the seedling data, a simple figure shows the comparison at a glance:
boxplot(control, fertilizer,
        names = c("Control", "Fertilizer"),
        ylab = "Height after 14 days (cm)")
The output is a two-box plot with the response variable, including units, on the y-axis and the treatment groups on the x-axis. A caption for it would read something like: "Figure 1. Height of bean seedlings after 14 days of growth with or without fertilizer (n = 8 per group). Boxes show the interquartile range, horizontal lines show the median, and whiskers extend to the most extreme values within 1.5 times the interquartile range."
For tables, follow these rules:
- Put the caption above the table, with the table number.
- Label every column with the variable and its unit, for example "Height (cm)."
- Put sample size in the caption or in a column, not buried in a footnote.
- Report the same summary statistics in the table that you report in the text, so the two never disagree.
- Report the results of statistical tests either in the table or in the text, but clearly, not vaguely in both.
Step 6: Check Every Number Against the Raw Data
Before you write the discussion, run a verification pass. This takes ten minutes and catches the errors that cost the most marks:
- Recompute one mean and one standard deviation by hand or in a fresh spreadsheet cell.
- Confirm that every n in the text matches the row count in the data.
- Confirm that every unit appears at least once per variable and that you have not swapped mg for g or minutes for hours anywhere.
- Confirm that the values in each table match the values in the text. A mean of 6.79 in a paragraph and 6.87 in the corresponding table is the kind of inconsistency that makes a grader distrust the whole report.
- Confirm that each table and figure is called out in the text in ascending numerical order.
Step 7: Read It Cold
Finally, read the results section from top to bottom as if you had never seen the experiment. Two questions guide the read. First, can a reader state your main finding after reading only the first paragraph? Second, is there any sentence that interprets, explains, or apologizes for the data? If yes, cut it and save the idea for the discussion.
What to Report for Common Statistical Tests
The table below summarizes what belongs in the text for the analyses most common in introductory and intermediate biology labs.
| Analysis | Report in the text | Worked example sentence |
|---|---|---|
| Independent t-test | Both group means ± SD, n per group, t, df, p | Fertilizer seedlings averaged 6.79 ± 0.41 cm versus 4.80 ± 0.35 cm for controls (t(14) = 10.44, p < 0.001) |
| One-way ANOVA | Group means ± SD, F statistic with two df values, p | Growth differed across the three light levels (F(2, 21) = 8.92, p < 0.01), with mean height decreasing as shading increased |
| Linear regression | Slope with units, R², p | Height increased with fertilizer concentration at 0.42 cm per gram of added fertilizer (R² = 0.71, p < 0.001) |
| Chi-square test | Observed counts or percentages per category, χ², df, p | Germination did not differ between treated and untreated seeds (χ²(1) = 0.85, p = 0.36) |
| Descriptive only | n, mean, SD, and range | Across all 24 seedlings, height ranged from 3.9 to 7.4 cm (mean 5.8 cm, SD 1.1 cm) |
If your course follows a specific style guide, such as APA style, its formatting for statistics symbols takes priority over the general patterns here.
What Published Results Sections Look Like in Practice
Course reports are simplified versions of the results sections you will encounter in the research literature, and four organizational patterns from recent published papers transfer directly to student writing.
Headline first, strata after. Large epidemiological analyses report the topline estimate before any breakdown. The GBD 2023 unintentional poisoning analysis follows this pattern, moving from global totals to age, sex, regional, and socioeconomic stratifications, and it also derives a compound quantity, case fatality, from two separately modeled quantities, deaths and incidence [1]. The transferable lesson is that a reader should meet your most important number in your first results paragraph, and that derived values deserve their own clearly described place.
Report the estimate with its uncertainty. When a difference or association is the finding, publish the size of the effect and the uncertainty around it, not just a p-value. In a federated analysis of 7,415 adults from eight European studies, the authors reported that each 5 kg/m² increase in body mass index was associated with lower gut microbial alpha diversity, giving the coefficient as β = -0.05 with a 95% confidence interval of -0.07 to -0.03, and they gave similarly complete estimates for each genus-level association [2]. In a lab report, the equivalent habit is writing "height increased by 1.99 cm (95% CI 1.58 to 2.40)" rather than only "p < 0.001."
Separate data types into their own streams. When a study produces both quantitative and qualitative data, strong results sections keep the streams distinct. A mixed-methods study of cognitive symptoms during the menopause transition reported its survey findings as percentages, including the proportion of 216 participants who rated their difficulties as bothersome and the proportion interested in a future intervention, and then reported its focus group findings as a thematic analysis organized into ten themes across two content areas [3]. If your lab report combines measurements with observations or open-ended responses, report the measurements first with statistics, then the observations as organized, labeled categories.
Name the analysis before the findings. Qualitative results read as credible only when the reader knows how the themes were derived. In a study of patients who received amyloid PET scan results, the methods state that verbatim interview transcripts were analyzed inductively, and the results section then presents the themes that emerged, such as how participants' motivations for testing were shaped by family experience with dementia, followed by the pattern that all participants accurately understood their amyloid status [4]. The transferable version for a student report: before presenting categorized observations, state in one sentence how you categorized them.
Lab Report Results Section Organization Tips
These tips solve the problems that show up most often in graded reports:
- Write results before discussion. Drafting results first forces you to know what the data actually say, which makes the discussion faster and more honest.
- Keep a running list of every number you plan to state. When the section is drafted, tick each number off against your saved statistical output. This one habit eliminates most numerical errors.
- Use parallel structure across paragraphs. If paragraph one begins "Mean height was...," paragraph two should begin the same way for its variable. Parallelism makes a multi-part results section feel organized rather than scattered.
- Put negative and unexpected results in the main text. A result that contradicts your hypothesis is still a result, and it belongs in the same formula as any other finding. Omitting it is the fastest route from a data problem to an integrity problem.
- Match your figures to your claims. Every claim in the text should be traceable to a specific table, figure, or stated number. If a claim has no number behind it, it is not a result yet.
- Front-load the sample size. State n for each group in the first sentence that mentions the data, then refer to groups by name afterward.
Common Mistakes and Limitations
These are the errors graders flag most often, in rough order of frequency:
- The data dump. Reproducing every reading from every replicate in the text instead of summarizing. Raw data belongs in an appendix if your instructor wants it, and the results section should present summaries and patterns.
- Methods leakage. Writing "heights were measured with a ruler every 3 days" in results. The procedure was already described in methods. Results state only what was measured and what the values were.
- Interpretation creep. Sentences beginning with "This suggests," "This occurred because," or "These findings demonstrate" are discussion sentences. Cut them from results.
- p-value-only reporting. Writing "the difference was significant (p < 0.05)" without stating the size of the difference leaves the reader unable to judge whether the effect matters. Always pair a p-value with means, a difference, or an effect size.
- Orphan and duplicate figures. A figure never mentioned in the text, or the same data shown twice as both a table and a figure, both read as disorganization.
- Unit and decimal chaos. Mixing cm and mm, or reporting one mean to one decimal place and another to three, signals carelessness. Pick one convention per variable and hold it.
- Selective reporting. Presenting only the comparisons that came out significant while quietly dropping the rest. Graders and reviewers ask about missing comparisons, and the honest answer should already be in the section.
Two limitations of the general advice in this article are worth stating plainly. First, formats vary. Instructors, journals, and professional bodies such as the American Society for Microbiology publish their own formatting requirements, and where those differ from the general conventions here, the specific requirement wins. Second, this guide describes how to organize and report results clearly. It cannot tell you whether a particular data set was collected correctly, and individual experimental problems, such as failed controls or contaminated cultures, need to be raised with your instructor or laboratory supervisor before you decide how to handle the affected data.
Frequently Asked Questions
Should the results section include interpretation of the findings?
No. Results describe what you found, and the discussion explains what it means. Keep interpretation, comparison with other studies, and mechanism out of results unless your rubric explicitly combines the two sections.
How long should the results section of a lab report be?
Long enough to report every planned comparison once, and no longer. For a typical undergraduate report, this is usually two to four paragraphs plus one to three tables or figures.
Do I include raw data in the results section?
No. Summarize raw data into means, standard deviations, and test statistics, and put the full data table in an appendix if your instructor asks for it.
What verb tense should the results section use?
Past tense. "Seedlings grew faster under fertilizer" is correct, while the present tense is reserved for what tables and figures show, as in "Figure 1 shows height after 14 days."
What do I do if my results do not support my hypothesis?
Report them plainly using the same paragraph formula as any other finding. A well-organized null or contradictory result is a legitimate scientific outcome, and the discussion is where you explore why it occurred.
Can I put a figure in the results that I did not make myself?
No. Figures in the results section present your own data. Images from other sources belong in the introduction or discussion, cited like any other borrowed material.
Where do failed runs and excluded data points go?
Report the number of replicates excluded and the reason in one sentence, usually at the start of the affected paragraph, then report the analysis on the retained data. The judgment call about whether an exclusion is justified belongs with your instructor.
How do I report a p-value in the text?
Use the format p < 0.001 when the value is extremely small, otherwise give the exact value to two or three decimal places, such as p = 0.036. Italicize p, and always pair it with the test statistic and degrees of freedom.
Sources
- Global, regional, and national burden of unintentional poisoning, 1990-2023: results from the Global Burden of Disease Study 2023.
- Associations of Adiposity With Gut Microbiota Composition Among Adults-Results From a Federated Analysis of Individual Participant Data From Eight European Observational Studies.
- Mixed methods research to support the development of an evidence-based intervention for cognitive symptoms in menopause transition.
- Long-term impact of disclosing amyloid PET results to individuals with subjective cognitive decline.