How to Use knitr to Automate Reproducible Figures in R Markdown
By Dr. Zubair Khalid, DVM, MS, PhD ·
If your figures look correct when you run chunks interactively but come out wrong, stale, or missing when you knit, the most likely cause is hidden state. A cached chunk holding an old plot, an object left over in your global environment, or a random number generator that was never seeded will all produce figures that change from one knit to the next. The first thing to check is almost always the same: clear the cache, close every R session, and knit from a completely fresh session using the Knit button rather than by running chunks by hand. If the problem disappears, you were seeing the residue of interactive work, not a bug in your code.
This guide walks through the causes of figure failures in knitr and R Markdown, from the most common to the rarest, explains the mechanism behind each one, and gives you a diagnostic sequence and a prevention plan you can apply to any project.
Why Figure Reproducibility Matters
A figure that cannot be regenerated from its own script is not a result. It is a screenshot of one lucky afternoon on one computer. The broader movement toward reproducible research exists because analysis pipelines, not just raw data, determine what a paper reports. In metabolomics, for example, raw instrument files are now routinely deposited in public archives, yet the computational steps that turn those files into the feature tables and plots in a publication are often the hardest part to share, audit, and rerun [1]. Figures sit at the end of that pipeline, so any silent failure upstream shows up in them.
knitr addresses this through literate programming, the practice of interleaving narrative text with executable code in a single source document. When you knit an R Markdown file, knitr runs every code chunk in order, captures each plot as a file, and inserts it into the output document next to the prose that explains it. The result is a single artifact that contains the analysis, the figure, and the explanation together, which is the core promise of the approach [1].
The catch is that knitr can only reproduce what the R session actually does. Most figure problems are therefore session problems, and they respond to a small set of predictable fixes.
What knitr Actually Does When It Makes a Figure
Understanding the mechanism makes every troubleshooting step below easier to interpret.
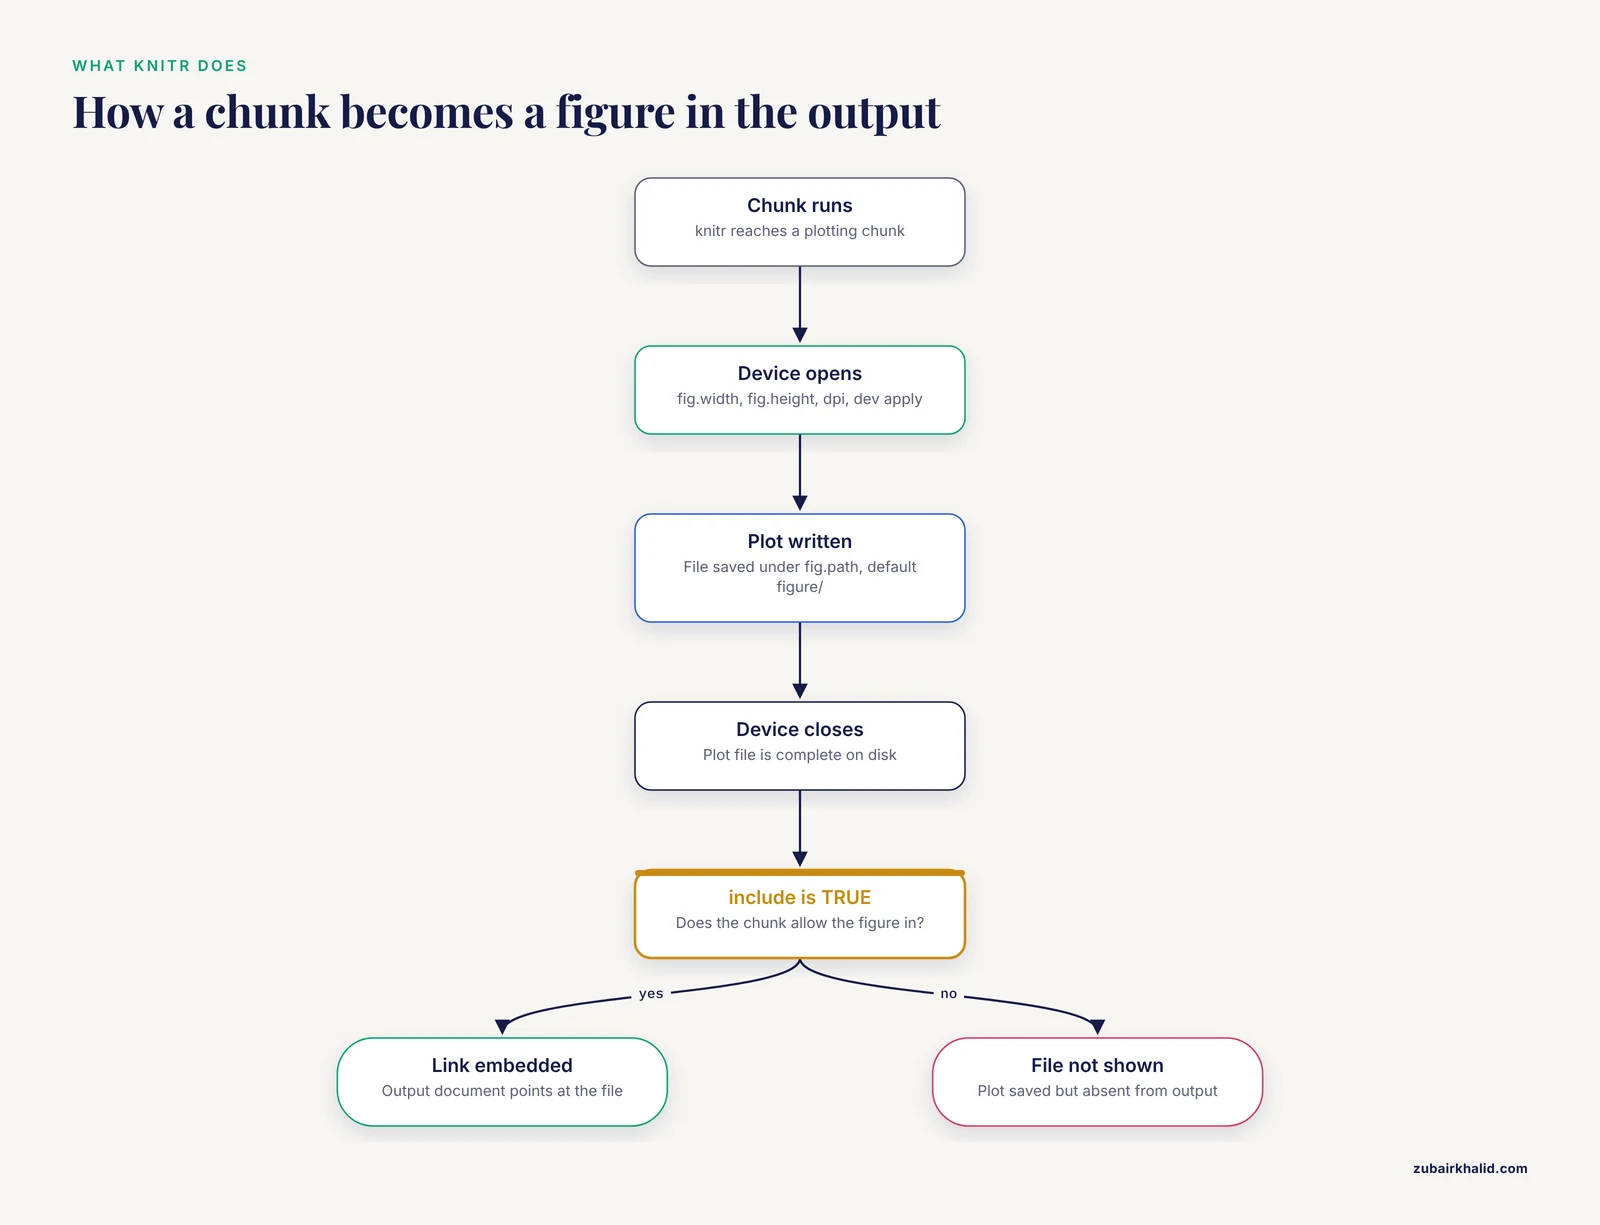
When knitr encounters a code chunk that produces a plot, it opens a graphics device, runs the code, writes the plot to a file on disk, closes the device, and embeds a link to that file in the output. The details are controlled by chunk options:
fig.widthandfig.heightset the physical size of the plot in inches. The knitr defaults are 7 by 7, though the R Markdown output format you use may override them.dpisets the resolution of raster output. The knitr default is 72 dots per inch, and many R Markdown templates raise it.devselects the graphics device, such as"png","pdf","svg", or"cairo_pdf". The right choice depends on the output format, because HTML documents embed raster or vector images while PDF documents built with LaTeX need PDF-compatible devices.fig.pathsets the folder where generated figures are written, relative to the document directory. The default isfigure/, and each file name is prefixed with the chunk label.includecontrols whether the figure is placed in the document. A chunk withinclude = FALSEstill runs and still saves its plot, but the plot does not appear.cachecontrols whether knitr reuses the results of a previous run instead of recomputing.
Every one of these options is a place where a figure can silently go wrong. The troubleshooting table below maps the symptoms you will see to the option or behavior that caused them.
Knitr Reproducible Figures Troubleshooting Table
| Symptom | Likely cause | How to confirm | Fix |
|---|---|---|---|
| Figure disappears when knitting but appears when you run the chunk manually | Hidden state in the global environment, or the plot depends on an object created outside the chunk | Close all R sessions, knit fresh, and see if the figure vanishes | Move all data preparation into chunks, or load required objects from files inside the document |
| An old version of a figure keeps appearing after you change the code | Cached chunk (cache = TRUE) is not being invalidated | Delete the *_cache folder and knit again. If the figure corrects itself, the cache was stale | Add cache.extra inputs that capture what the chunk depends on, or set dependson for chunks that read other chunks, or drop caching for plotting chunks |
Only the last plot from a for loop appears | ggplot2 objects are not printed inside loops | Wrap a single loop iteration's plot in print() and see if it renders | Call print(p) inside the loop for ggplot2 figures, or build a list of plots and print them after the loop |
| Figure looks sharp in one output format and blurry in another | Low dpi combined with a raster device, or the viewer is scaling the image up | Check the dpi option and inspect the file in the figure/ folder | Raise dpi to 150 or 300, or switch to a vector device such as dev = "svg" for HTML output |
| Figure renders in HTML but errors or renders badly in PDF | Graphics device mismatch. The PDF path needs a device that LaTeX can include, and missing fonts can break pdf() | Knit with dev = "pdf" alone and read the error message | Set dev = "pdf" or dev = "cairo_pdf" for PDF output, and embed fonts or switch to cairo_pdf if fonts are the problem |
| Error about a file path that exists on your machine but not for a collaborator | Absolute paths or a working directory that differs between machines | Print getwd() in a chunk and compare across machines | Use project-relative paths, ideally with the here package, and keep the R Markdown file at the project root |
| Same code, different figure between runs | Randomness from an unseeded RNG, typically jitter, sampling, or a random starting point in an algorithm | Add set.seed(1) before the plotting code and see if runs become identical | Seed the RNG at the top of the document and before any stochastic step |
Figure is missing from the output but a file exists in figure/ | include = FALSE on the chunk, or the plot was produced inside a function or a conditional branch that did not execute | Check the chunk header options and confirm the branch ran | Set include = TRUE, or call print() explicitly on the plot object |
| Figure overflows the page in PDF output | Physical figure size exceeds the text width, so LaTeX scales or clips it | Check fig.width and fig.height against your page geometry | Reduce fig.width and fig.height, or use out.width to control display size separately from the underlying file size |
Knit fails with a message about rmarkdown or a missing package | Package not installed in the fresh session used for knitting | Run installed.packages() or try loading the package in a clean session | Install the package, and record versions with sessionInfo() or renv so the environment is reproducible |
Causes and Fixes, From Most Common to Rarest
1. Hidden state and interactive residue
The single most common cause of non-reproducible figures is running chunks by hand in an R session that contains objects, loaded packages, and parameter values left over from earlier work. When you knit, RStudio starts a fresh R session and runs the document top to bottom. Any chunk that quietly depended on something you created interactively now fails or produces something different.
The mechanism is simple. knitr evaluates the document as a self-contained program. Your interactive session is not self-contained. The fix is to make the document honest: every object a figure depends on must be created by a chunk above it or loaded from a file by a chunk above it. A quick test is to restart R and run every chunk in order without touching the console. If a figure breaks, something was coming from outside the document.
2. Stale caches serving old figures
Caching exists to save time. When a chunk has cache = TRUE, knitr stores its output and skips reexecution on the next knit as long as the chunk code is unchanged. The failure mode is that "unchanged code" is not the same as "unchanged meaning." If the chunk reads a data file that you edited, or depends on a result computed in another chunk, knitr may serve a plot built from the old data while the rest of the document moves on. The document then mixes figures from different versions of the analysis, which is worse than an error because nothing fails loudly.
The fixes, in order of preference, are:
- Do not cache plotting chunks. Recomputing a plot is usually fast, and caching it buys little.
- If you cache a computation, add
cache.extrakeyed to the inputs that matter, such as the file modification time of the data. - Use the
dependsonoption so a cached chunk is invalidated whenever the chunks it depends on recompute. - When in doubt, delete the
*_cachedirectory and knit clean.
3. Plots inside loops and functions that never print
Base R graphics draw directly to the active device, so a plot() call inside a loop renders fine. ggplot2 works differently. Building a ggplot object returns an object, and printing that object is what draws it. At the top level, R auto-prints, so ggplot(...) appears to draw by itself. Inside a loop or a function, auto-printing does not happen, so the plots are constructed and discarded, and you see either nothing or only the final object.
The fix is one line: assign the plot to a name and call print(p) inside the loop. The same rule applies inside user-defined functions and inside purrr::map pipelines. This is not a knitr bug, but it is the cause of a large share of "my figure vanished when I knit" reports, and it explains why the figure sometimes shows up only as a single lonely panel.
4. Unseeded randomness
Any figure built with jittered points, sampled data, random initializations, or stochastic resampling will differ between runs unless the random number generator is seeded. In R Markdown, an unseeded document is a document that rewrites its own results every time it is knit, which quietly breaks the connection between the numbers in your text and the plot above them.
Call set.seed() once near the top of the document, after loading packages, and again before any chunk whose stochastic behavior you want to pin down. If you use caching, knitr manages seeds per chunk so that cached chunks stay reproducible, which is one more reason the cache and seed topics travel together.
5. Graphics device and output format mismatches
The same document can behave differently across output formats because each format has different device requirements. HTML output can embed PNG or SVG. PDF output through LaTeX requires PDF, and the base pdf() device can fail on fonts that are not available or not embeddable, producing errors or dropped characters in figure text.
How to fix knitr reproducible figures troubleshooting here is a matter of matching the device to the destination. For HTML, dev = "svg" gives crisp vector figures that scale with the page. For PDF, dev = "pdf" is the baseline and dev = "cairo_pdf" handles a wider range of fonts and Unicode characters. If you need pixel-exact control in HTML, set dpi to 150 or 300 and consider the ragg device family through the dev option. When a figure misbehaves in only one format, isolate the device first, because the rendering code path is the thing that changed.
6. Paths and working directories
A figure that knits on your laptop and fails for a collaborator usually involves a path. knitr sets the working directory to the folder containing the R Markdown file during knitting, which surprises people who developed their script with a different working directory set interactively. Absolute paths make the problem worse, because they encode one machine's directory layout into the analysis.
The durable fix is to keep the R Markdown file at the top of a self-contained project folder, reference data with paths relative to that file, and optionally use the here package, which builds paths from the project root regardless of how or where the session was started. As a diagnostic, put getwd() in a chunk near the top. If the printed path differs between machines, you have found the cause.
7. Figure size and output size confusion
Two different settings control two different things. fig.width and fig.height set the size of the graphics device, which determines text scaling and the aspect ratio of the saved file. out.width and out.height set how large the image appears in the final document. A frequent mistake is fixing a page-overflow problem by changing fig.width, which instead shrinks all the text and spacing inside the plot. The right fix for display size is out.width = "100%" or a percentage, while the right fix for crowded text is adjusting fig.width or increasing the base font size in the plotting theme.
8. Environment drift across machines and months
When a figure reproduces today but not after an R or package upgrade, the cause is rarely the plotting code. It is the environment. Package updates change defaults, and R itself changes graphics behavior between major versions. The FAIR principles, first formulated for data and later extended to research software and workflows, make the case that the computational environment is part of the scholarly record and should be shareable and reusable like the data [1].
The practical responses are to record the session with sessionInfo() in the final chunk, to pin package versions with renv for anything you expect to revisit, and to state the R version somewhere in the document. For teaching materials that walk students through full analysis pipelines, open educational resources built on R and Bioconductor make this environment recording an explicit part of the workflow rather than an afterthought [1].
9. Rare causes worth knowing
A few less common failures are worth a paragraph each:
- Oversized figures in LaTeX. A figure whose physical dimensions exceed the text block can be clipped or scaled unpredictably. Check the geometry of your PDF template against
fig.width. - Plots created in chunks with
eval = FALSE. The chunk does not run, no figure file is produced, and the document references a file that does not exist. - Parallel or background processing that returns before plotting finishes, producing empty or partial figures. Collect results first, then plot in a separate sequential chunk.
- Custom
knit_hooksor output hooks left over from an earlier experiment that divert or rename figure files. If figures vanish after you edited hooks, remove the hook and knit clean.
A Five-Step Diagnostic Sequence
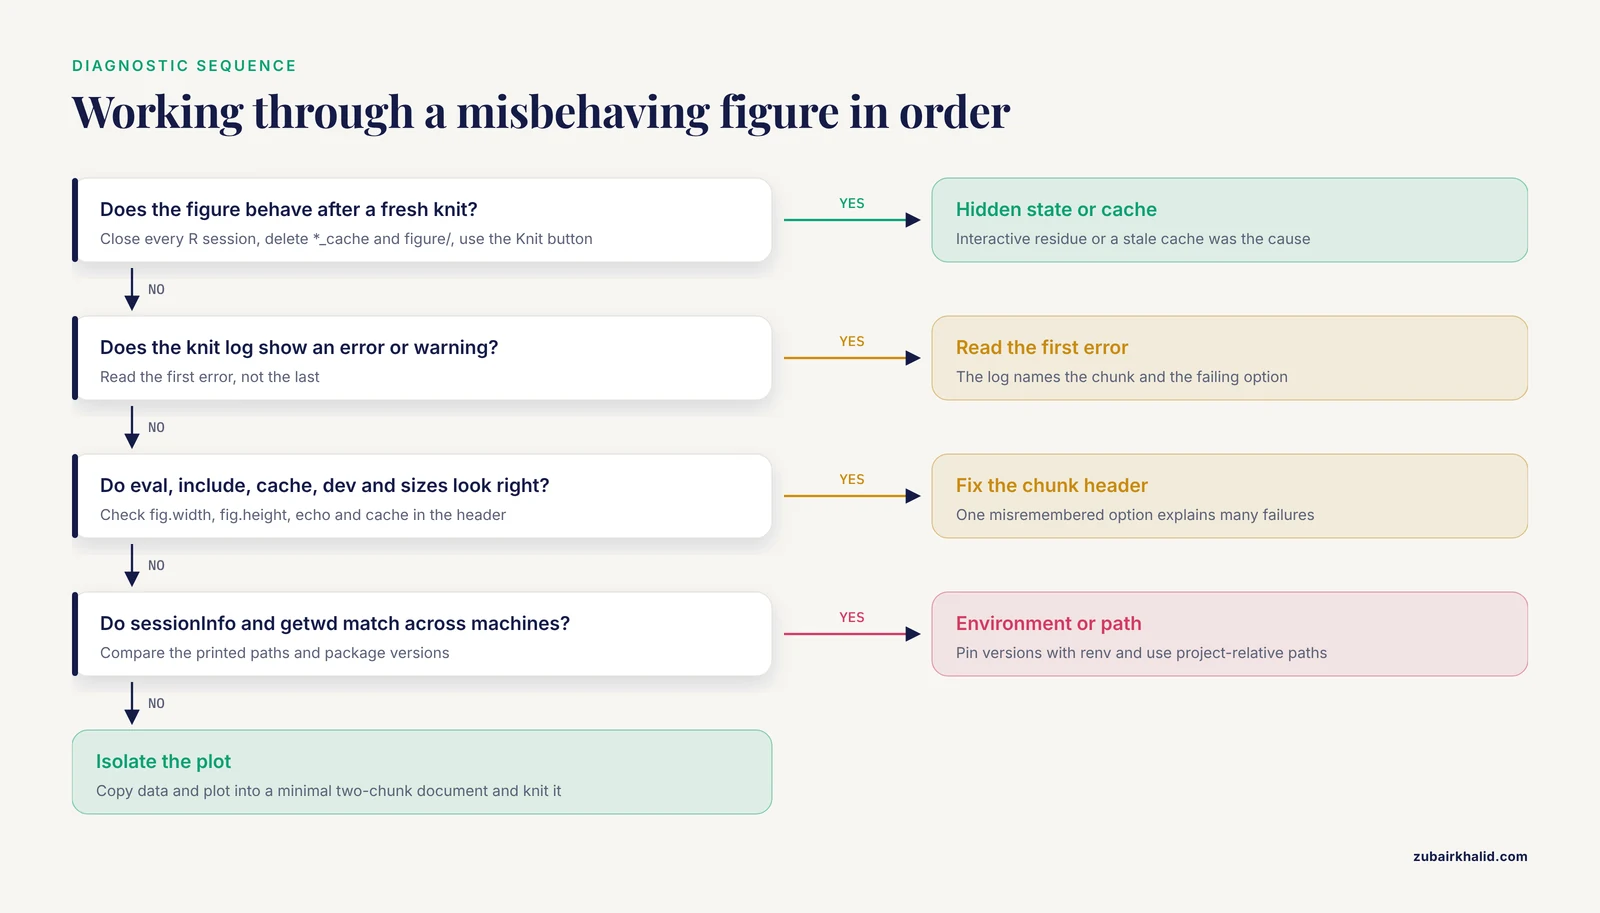
When a figure misbehaves, work through this sequence in order. Each step either fixes the problem or eliminates a whole category of causes.
- Knit fresh. Close every R session, delete the
*_cacheandfigure/directories, and knit with the Knit button. This removes hidden state and stale caches at once and resolves the majority of cases. - Read the actual log. The knit output in the R Markdown tab contains warnings and errors that interactive running suppresses. Find the first error, not the last.
- Inspect the chunk header. Confirm
eval,include,echo,cache,dev,fig.width, andfig.heightsay what you intend. One misremembered option explains a surprising number of failures. - Check the environment and the paths. Run
sessionInfo()andgetwd()in chunks. Compare across machines if the problem is machine-specific. - Isolate the plot. Copy the plotting code into a minimal new document with two chunks, data and plot, and knit that. If the minimal document works, the cause is upstream in the full document. If it fails, the cause is in the plotting code or the device.
A Reproducibility Checklist for Figure Pipelines
The same principles that make data findable, accessible, interoperable, and reusable apply to the analysis that produces your figures, and educational resources in the life sciences increasingly treat executable, script-based workflows as the practical way to carry those principles through [1]. Before you consider a figure pipeline finished, confirm every item on this reproducibility checklist:
- The document knits from a completely fresh R session with no manual steps.
- Every object used by a figure is created or loaded by a chunk above that figure.
- The random number generator is seeded, and any stochastic analysis pins its own seed.
- No plotting chunk is cached unless the cache is keyed to its true inputs.
- Data are referenced with project-relative paths, and the project folder is self-contained.
- The graphics device matches each output format, and fonts render correctly in PDF.
- Figure dimensions and resolution are set deliberately with
fig.width,fig.height,dpi, andout.width. sessionInfo()output is recorded, and package versions are pinned for long-term work.- The final document, its data, and its code are stored together so a colleague can rerun the whole thing from raw input to final figure [1].
A document that passes this list produces the same figure on your machine, your collaborator's machine, and a reviewer's machine, which is the entire point.
Common Mistakes and Limitations
- Treating the knit button as a formality. If you never knit until the end, hidden state accumulates for weeks. Knit after every substantive change so failures surface when they are cheap to fix.
- Caching everything to save time. Caching is a precision tool. Applying it broadly produces documents whose chunks describe different versions of the analysis.
- Debugging in the interactive session. Reproduce the failure with a fresh knit before you change any code. Fixing the symptom you see interactively often fixes nothing in the document.
- Confusing display size with figure size, as described above, and then compensating with font hacks.
- Assuming a figure is reproducible because the code is correct. Correct code running in an unpinned environment is still not reproducible. Version drift is a cause, not a footnote.
- Ignoring warnings because the figure appeared. A warning about fonts, missing values, or deprecated defaults often becomes the next failure.
- A limitation of any checklist is that it covers the document, not the science. Reproducible figures guarantee that others can rerun your analysis exactly, not that the analysis is well designed or that the result generalizes.
Individual research projects differ in data governance requirements, and any project involving identifiable human or animal clinical data must follow the review and privacy policies of the relevant institution before figures or underlying data are shared.
Preventing the Next Failure
Prevention in practice reduces to three habits. First, build the document so that a fresh session is the normal condition, not the exception. Second, make every dependency explicit, whether it is a package, a data file, a random seed, or a chunk dependency. Third, record the environment as part of the document itself. These habits scale from a single homework report to a multi-author analysis, and they are the same habits that open, script-based workflows in the life sciences are built on [1].
Frequently Asked Questions
Why do my figures disappear when I knit but show up when I run chunks manually?
Because knitting runs the document in a fresh R session while manual running uses your cluttered interactive session. An object, package, or parameter created outside the document is present interactively and absent when knitting. Move every dependency into the document or load it from a file.
Why does my ggplot inside a for loop only show the last plot?
ggplot2 objects are not auto-printed inside loops or functions, so earlier plots are built and discarded. Assign each plot to a variable and call print() on it inside the loop.
How do I stop cached chunks from showing old figures?
Delete the *_cache folder and knit again to confirm the diagnosis. Then either remove cache = TRUE from plotting chunks or add cache.extra and dependson so the cache is invalidated when its true inputs change.
Why are my figures blurry in HTML output?
The figure was rasterized at low resolution. Raise the dpi chunk option to 150 or 300, or switch to a vector device such as dev = "svg" so the figure scales cleanly at any size.
Why does a figure work in HTML but fail in PDF?
The two formats use different graphics devices. PDF output through LaTeX needs dev = "pdf" or dev = "cairo_pdf", and font problems in the base pdf() device are a common trigger. Match the device to the output format.
Where does knitr save my figures and can I change the folder?
knitr writes figures to a folder named figure/ next to the R Markdown file by default, with the chunk label in the file name. Change the location with the fig.path chunk option.
What seed should I use for reproducible figures?
Any fixed seed works, because the goal is that reruns match, not that the numbers are special. Call set.seed() once near the top of the document, and again before any stochastic step whose result you want pinned.
How do I record package versions so my figures reproduce later?
Add a final chunk containing sessionInfo() so the R and package versions are printed in the document. For long-lived projects, use renv to pin exact package versions in the project library.