Recording Raw Data in Lab Notebooks: Best Practices
By Dr. Zubair Khalid, DVM, MS, PhD ·

By the end of this article you will be able to set up a lab notebook that captures raw data in a way that survives audits, reproduces experiments, and holds up as legal evidence. You will have a reusable lab notebook template, a step by step workflow for recording values at the bench, a working correction procedure, and a method for tying paper entries to digital files on your computer.
Before you start, gather the following:
- A bound or permanently bound notebook with numbered pages (a sewn binding, not loose-leaf or spiral)
- Permanent ink pens in black or blue
- A ruler for drawing tables
- Your instrument manuals or protocol printouts
- For digital records: a terminal with
sha256sum(Linux, macOS) orGet-FileHash(Windows PowerShell), and a hash log file
Nothing else is required. The whole system below fits on one notebook page and one text file.
Why Raw Data Deserves Special Treatment
Raw data are the original, unmanipulated numbers, images, readings, and observations that come directly off your instruments, samples, and reactions. A raw absorbance reading of 0.402 is raw data. The 0.402 after you subtract a blank, convert to concentration, and average across triplicates is processed data. The distinction matters because every calculation you publish can only be checked if the original numbers survive.
Recording raw data in lab notebooks is the foundation of reproducibility. A 2026 paper in Frontiers in Neuroinformatics describes the core problem directly: fragmented tools, inconsistent documentation, and poor platform integration continue to undermine reproducibility in data-intensive science, particularly when many processing stages sit between raw data and the final figure [1]. The paper proposed IntegriLAB, an electronic lab notebook framework that consolidates data, documents, and code into one centralized system, precisely because scattered and incomplete records make experiments impossible to verify [1].
That finding applies just as much to a spiral notebook full of plate reader values as it does to a neuroimaging pipeline. If the raw values are missing, transcribed late, or recorded in processed form, no one, including you six months later, can reconstruct what happened.
What Counts as Raw Data
Record the following in the notebook, in their unprocessed form:
- Instrument readings: absorbance, fluorescence, pH, temperature, mass, voltage, counts
- Manual observations: colony morphology, animal behavior notes, gel appearance, color changes
- Sample identifiers as written on the tube, plate, or cage card, exactly as they appear
- Timestamps for each reading or event
- Instrument identifiers: serial numbers, calibration due dates, settings
- Deviations: anything that went wrong or differently from the protocol, with the time it happened
- Conditions: reagent lot numbers, concentrations as prepared, incubation times and temperatures
Do not record averages, blank-subtracted values, or "cleaned up" numbers in place of the raw readings. Write the raw values first, then do the math. If you want to show a calculated column in the same table, label it clearly as calculated and keep the raw column beside it.
Electronic Lab Notebook Comparison: Paper, Electronic, and Hybrid
The right format depends on your institution, your data volume, and your field. The table below summarizes the practical tradeoffs.
| Attribute | Bound paper notebook | General-purpose electronic lab notebook (ELN) | Structured ELN with version control | Hybrid (paper + digital hashes) |
|---|---|---|---|---|
| Permanence | High, if signed and witnessed | Depends on vendor export | High with immutable commit history | High |
| Searchability | Low, manual indexing | High | High | Medium |
| Automatic audit trail | None, relies on dates and witnesses | Varies by vendor | Strong with signed commits | Strong when hashes are logged |
| Attach large datasets | No, reference by location | Yes, within size limits | Yes, via external repositories | Yes, by reference |
| Offline use at the bench | Excellent | Depends on vendor | Depends on setup | Excellent |
| Risk to watch | Loss, fire, illegible entries | Vendor lock-in, unclear export | Setup complexity | Two systems to keep in sync |
Traditional electronic lab notebooks help with organization, but recent analysis points out that many of them lack cross-platform interoperability, verifiable authorship certification, and immutable auditability [1]. IntegriLAB addresses those gaps by unifying repositories such as DataLad (a data versioning tool), Overleaf (a collaborative writing platform), and GitHub (a code hosting service) under one web-based system, then using a component called LabTrace, built on energy-efficient blockchain technology, to certify each research activity with cryptographically signed, immutable records [1]. You do not need blockchain to record raw data well, but the underlying message applies to every format: an entry should be attributable to a specific person, at a specific time, in a form that cannot silently change later.
A reasonable practical policy for most students and trainees: keep the primary narrative and hand-recorded values in the bound notebook, keep large instrument output files on backed-up storage, and bind the two together with file hashes, as shown in the walkthrough below.
The Lab Notebook Template
Every experimental entry should contain the same fields so that any reader can find what they need. Copy this structure onto a page and reuse it.
Page 47                         Date: 2026-11-11
Project: pAMP-plasmid-kill-curve
Experiment: Cefazolin MIC against E. coli K-12, run 2
Operator: Z. Khalid
Objective: Determine minimum inhibitory concentration in Mueller-Hinton broth
Protocol: SOP-MIC-03, rev 4 (bound at back of notebook)
Instruments: Plate reader SN A12F44, calibration valid to 2027-03-01
Reagents: Cefazolin lot C5521, Mueller-Hinton broth lot M7102
Expected outcome if it works: no growth at 32 ug/mL and above

PLAN (before starting):
1. Two-fold dilution series, 64 to 0.5 ug/mL, 200 uL per well
2. Inoculate 1:100 from 0.5 McFarland suspension
3. Read OD600 at 0 h and 18 h

CONDITIONS AS RUN:
- Incubator 37.0 C, ambient air
- Started inoculation 14:22
- NOTE: well D6 lid condensation observed at 14:25, wiped

RAW DATA (see next page for full table)

OBSERVATIONS AND DEVIATIONS:
- Stock appeared clear, no precipitate
- Deviation: plate left on bench 3 min during transfer (14:30-14:33)

Signed: _______  Date: 2026-11-11
Witnessed by: _______  Date: _______
The header fields matter less for their exact wording than for their consistency. A reader scanning 200 pages should be able to find any experiment by date, project, or keyword in a few minutes.
How to Record Raw Data in a Lab Notebook, Step by Step
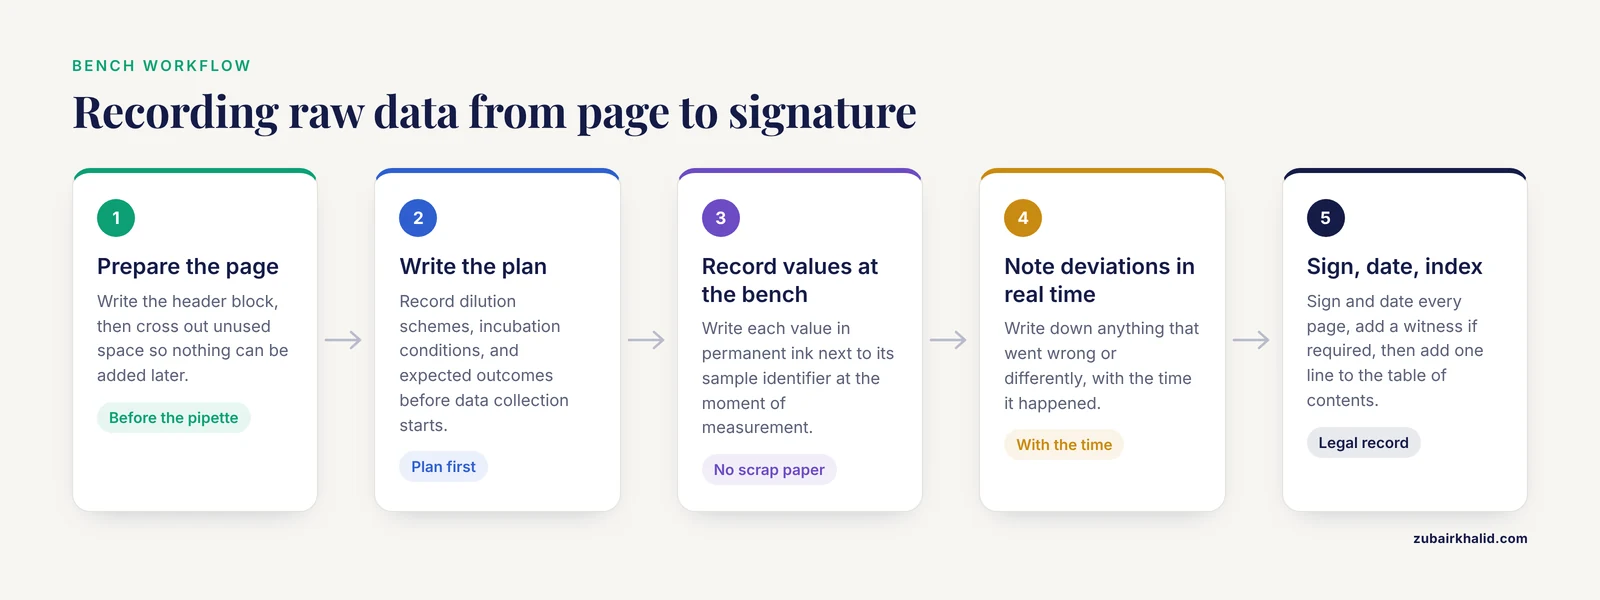
The following workflow takes you from an empty page to a signed, cross-referenced record. Work through it in order for every experiment until it becomes automatic.
Step 1: Prepare the page before you touch a pipette
Write the header block from the template above. Never start recording before the header exists. This single habit prevents the most common notebook failure, which is a page of anonymous numbers with no date, no experiment name, and no conditions.
Cross out any blank space you will not use. Draw an X or a diagonal line through empty regions of the page so that nothing can be added later.
Step 2: Write the plan before the results
Record what you intend to do, including dilution schemes, incubation conditions, and expected outcomes. Write the plan in the notebook before data collection starts. Pre-registration of intent, even informally, lets you detect later whether a result surprised you because of biology or because you changed the protocol midway.
Step 3: Record values at the moment of measurement
Write each value immediately, in permanent ink, next to its sample identifier. Never record on scrap paper, paper towels, or glove wrappers with the intention of transcribing later. Transcription delay is the single largest source of raw data corruption in wet labs.
A raw data table should look like this:
OD600, plate reader, read 1 at 14:40
Well   Sample         OD600
A1     blank          0.049
B1     64 ug/mL       0.051
C1     32 ug/mL       0.052
D1     16 ug/mL       0.201
E1     8 ug/mL        0.487
F1     4 ug/mL        0.655
G1     2 ug/mL        0.712
H1     0.5 ug/mL      0.738
Notice what is present and what is absent. Every value has a unit context (OD600, declared in the title line). Every value has a sample identity. Nothing is averaged, blank-corrected, or rounded beyond what the instrument displayed. The blank sits in the table as a raw reading, not subtracted out.
Step 4: Record deviations the moment they happen
If a plate sits on the bench, a lid gets contaminated, or an incubator door stays open, write it down immediately with the time. A deviation that seems trivial at 14:30 may explain an anomalous triplicate at analysis time. Deviations recorded in real time protect you. Deviations reconstructed from memory three weeks later protect no one.
Step 5: Attach or reference digital outputs
Instrument files, gel images, and sequencing output do not belong in a paper notebook. Reference them by storage location, and bind them to the page with a cryptographic hash. A hash is a fixed-length fingerprint computed from a file. If the file changes by even one byte, the hash changes completely, which makes silent alteration detectable.
On Linux or macOS, run:
sha256sum run002_plate_raw.csv >> ~/hashlog.txt
cat ~/hashlog.txt
Expected output looks like this (your hash values will differ):
9f2a7c1e44b0d8f6a3c5e2b9d1f8a4c6e0b2d7f9a1c3e5b7d9f1a3c5e7b9d1f2 run002_plate_raw.csvOn Windows PowerShell, run:
Get-FileHash run002_plate_raw.csv | Format-ListExpected output:
Algorithm       : SHA256
Hash            : 9F2A7C1E44B0D8F6A3C5E2B9D1F8A4C6E0B2D7F9A1C3E5B7D9F1A3C5E7B9D1F2
Path            : C:\Users\zkhalid\experiments\run002_plate_raw.csv
Then write in the notebook, by hand:
Digital attachment: run002_plate_raw.csv
SHA-256: 9f2a7c1e...b9d1f2
Location: lab-share/kill-curve/run002/
Hash logged in hashlog.txt line 47
Write enough of the hash to identify it uniquely. The full 64-character hash lives in the hash log file, which itself should be version controlled or backed up.
Step 6: Do the calculations on a fresh section, below the raw data
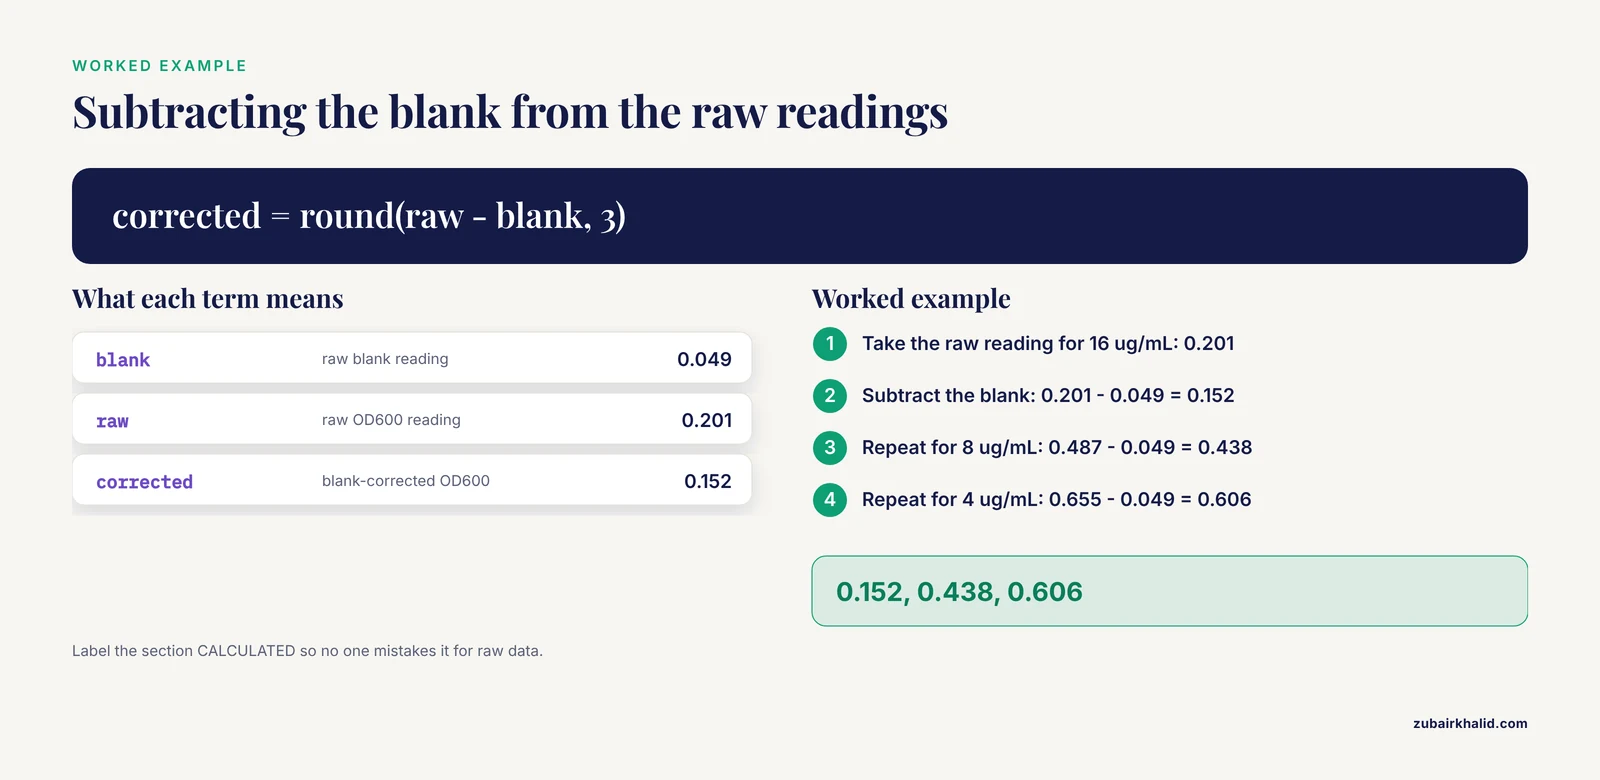
Now subtract the blank and compute derived values. Keep the arithmetic visible. For the dilution series above, work through one calculation explicitly in the notebook:
# Blank-corrected OD600, written on page 48 as a worked example
blank = 0.049
readings = {"16 ug/mL": 0.201, "8 ug/mL": 0.487, "4 ug/mL": 0.655}
corrected = {k: round(v - blank, 3) for k, v in readings.items()}
print(corrected)
Expected output:
{'16 ug/mL': 0.152, '8 ug/mL': 0.438, '4 ug/mL': 0.606}Label the section "CALCULATED" so no one mistakes it for raw data. Every derived number should trace back to a raw number on a previous page through a visible operation.
Step 7: Sign, date, and witness
Sign and date the bottom of every page, including pages of raw tables with no narrative. If your institution requires witnessing, have a colleague who understands the work review and countersign within the interval your institution specifies. Signature converts a personal worksheet into a legal record, which matters for patent purposes and for disputes about when a result was first obtained.
Step 8: Index the entry
Maintain a table of contents at the front of the notebook. After each experiment, add one line: page number, date, experiment title, project. Two minutes here saves hours of flipping later, and it is the difference between a notebook that gets used and one that gets avoided.
Step 9: Handle corrections with the standard procedure
Draw a single line through the incorrect entry so it remains legible. Write the correct value nearby. Add your initials and the date next to the correction. Never erase, never use correction fluid, never overwrite, never remove pages. A correction with initials and a date is normal and expected. A hidden correction destroys the credibility of the entire notebook.
Example of a properly corrected entry in plain text form:
E1 8 ug/mL 0.487 -> struck through, correct value 0.468, ZK 2026-11-11Step 10: Close out the experiment
Write a short conclusion, even one sentence: "MIC falls between 16 and 32 ug/mL, repeat with narrower range." Note the next step and the page it will be on. An experiment without a stated outcome forces the next reader, likely you, to reverse-engineer your interpretation from a table.
Practical Tips for Recording Raw Data in Lab Notebooks
Write units on every value, every time. An entry of "5.2" is meaningless when someone later asks whether it was 5.2 micrograms per milliliter or 5.2 milligrams. Units belong inside the table header and, for any ambiguous value, next to the number itself.
Record the instrument state. Note settings, serial numbers, and calibration status. The Frontiers in Neuroinformatics analysis identified inconsistent documentation across processing stages as a reproducibility failure point, and the same principle holds at the bench level [1]. A reading without the instrument conditions that produced it is only half a measurement.
Use permanent ink and date every page. This is textbook practice across laboratory management guides and institutional documentation standards, and it exists for a reason: undated, pencil-written records have repeatedly failed to hold up in patent proceedings and research integrity investigations.
Keep one experiment per page when possible. If two experiments share a page, draw a clear horizontal divider and label both sides. Shared pages with unlabeled mixing are a common source of transcription errors.
Photograph gel images and unusual observations, then reference the photo. Write the file name and hash in the notebook so the image is bound to the page.
Back up electronic records on a schedule. For digital raw data, follow a versioned storage approach. DataLad, one of the platforms IntegriLAB was designed to integrate, exists specifically to version-control large research data alongside documentation [1]. Whatever tool you use, the test is the same: can you retrieve yesterday's file, unmodified, next year?
Treat your hash log as data. The hash log file that binds digital files to notebook pages is itself a record. Back it up, date it, and never edit old lines.
Common Mistakes and Limitations
These are the errors that show up most often when notebooks are reviewed during audits, manuscript preparation, or integrity inquiries.
Recording processed values instead of raw ones. A student writes "0.15" for all three replicates because they blank-subtracted in their head at the bench. Later, the blank turns out to have been recorded wrong, and the original readings are gone. Always write what the instrument showed, then calculate.
Transcribing from scrap paper hours later. Values get swapped between samples, digits get dropped, and timestamps become fiction. Record directly into the notebook at the bench, even if your handwriting suffers.
Using pencil, gel pens, or erasable ink. These fade, smear, and can be altered. Permanent black or blue ink only.
Leaving gaps and blank pages. Blank spaces invite questions about whether entries were removed. Draw lines through unused space.
Backdating or pre-dating. Enter data on the day you collect it. If you must add something later, write "ADDED 2026-11-15, ZK" clearly, with the reason. Never disguise the timeline.
No units, no sample IDs, no context. A column of bare numbers is the most common failure found in student notebooks. Every number needs a label, a unit, and a sample identity.
White-out and overwriting. Corrections must remain visible. Opaque corrections look like concealment, even when they are innocent.
Digital records without hashes or backups. An instrument CSV sitting on one laptop with no checksum and no copy is not a durable record. Hash it, reference it, back it up.
Assuming the ELN handles everything. As the IntegriLAB analysis makes clear, organization alone does not guarantee verifiable authorship or immutability, and many current ELN platforms lack those properties [1]. Ask your institution how ELN records are exported, who owns the data, and what happens if the vendor discontinues the product before you commit years of records to one system.
One limitation to state plainly: the procedures here are general best practice. Your institution, your funder, and your technology transfer office may have specific requirements for witnessing intervals, retention periods, and electronic record formats, and those requirements override anything written here. Ask your principal investigator or institutional research office for the local standard operating procedure before your first entry, not after.
Frequently Asked Questions
What counts as raw data in a lab notebook?
Raw data are the original, unprocessed values that come directly from your instruments and observations, such as an OD600 reading of 0.402, a colony count, or a gel photograph. Anything you have subtracted, averaged, converted, or normalized is processed data and should be kept separate from the raw values.
Should I record data in pen or pencil?
Always use permanent ink, in black or blue. Pencil and erasable ink can be altered or fade, which undermines the notebook as a permanent record. If you write something wrong, strike through it with a single line, write the correction, and initial and date it.
How do I correct a mistake in a lab notebook?
Draw one line through the error so the original text stays readable, write the correct value next to it, and add your initials and the date. Never erase, use correction fluid, remove pages, or write over the original entry, because an invisible correction looks like concealment.
Can I record raw data electronically instead of on paper?
Yes, if your institution permits it and the system captures who recorded what and when. Be aware that many current electronic lab notebooks lack cross-platform interoperability, authorship certification, and immutable audit trails, so confirm how your records would be exported and verified before committing to a platform.
What is the difference between raw and processed data?
Raw data are direct instrument outputs and observations with no manipulation applied. Processed data are the results of operations on raw data, such as blank subtraction, averaging, unit conversion, or normalization. Both belong in the notebook, but in clearly labeled separate sections, with every processed value traceable to a raw one.
How do I make a lab notebook template?
Create a standard header block with the date, page number, project, experiment title, operator, objective, protocol reference, instrument identifiers, and reagent details, followed by sections for plan, conditions as run, raw data, observations, calculated results, and signatures. Reuse the same block on every page so any reader can navigate your notebook quickly.
Do I need to sign and date every page?
Yes. Sign and date every page you write on, including pages that contain only data tables, and add a witness countersignature if your institution requires one. A signed, dated page is what turns a personal worksheet into a record with legal and scientific standing.
How long should I keep my lab notebooks?
Retention requirements vary by institution, funder, and jurisdiction, so ask your principal investigator or research office for the local policy. As a general rule, notebooks are retained for many years after a project ends, so write every entry assuming someone will read it a decade from now.