GraphPad Prism vs R (ggplot2) for Biostatistics Figures
By Dr. Zubair Khalid, DVM, MS, PhD ·

GraphPad Prism is a commercial, menu-driven statistics and graphing package built around the standard tests and figure types of laboratory and clinical biology. R with ggplot2 is a free, code-based system in which the analysis and every figure live in a script you can rerun. The one-sentence difference between GraphPad Prism and ggplot2 is this: Prism trades flexibility for speed and guidance, while ggplot2 trades immediacy for control and reproducibility. The rule of thumb follows directly. If your project fits a standard workflow such as a t-test (a comparison of two group means), an analysis of variance, or a dose-response curve, and you need a publication figure this week, use Prism. If your analysis is custom, your dataset is large, or a reviewer revision will force you to regenerate every panel, use R with ggplot2. Many productive labs run both, and this research software comparison shows where each one earns its place.
The Difference Between GraphPad Prism and ggplot2 in One Paragraph
Prism is a self-contained desktop application. Data entry, statistical testing, and figure drawing happen under one roof, and guided dialogs ask the questions a statistician would ask, such as whether your groups are paired and whether the data meet parametric assumptions. ggplot2 is a plotting package inside the R language. It draws figures but performs no primary statistical testing, so you assemble your own analysis from R's functions and packages and then hand the results to ggplot2 for drawing. That single architectural difference drives every criterion in this article: how fast you reach a finished figure, how much you can change it, whether the whole analysis can be replayed exactly a year later, and what it costs to get started.
What GraphPad Prism Is
Prism, developed by GraphPad Software, organizes work around structured data tables. An XY table holds dose-response and kinetic data, a column table holds one value per subject for group comparisons, and further table types cover grouped designs, contingency data (counts across categories), and survival times. You choose an analysis from a categorized list, the software asks clarifying questions in a dialog, and it returns both numerical results and a linked graph. Changing the data updates the analysis and the figure together.
The built-in test library covers the core of biostatistics as practiced in wet-lab and clinical papers: t-tests, one-way and two-way ANOVA (analysis of variance, the test for comparing means across three or more groups) with post hoc (between-group follow-up) corrections such as Tukey, Dunnett, and Bonferroni, nonparametric alternatives (methods that do not assume a normal distribution) such as the Mann-Whitney and Kruskal-Wallis tests, Kaplan-Meier survival analysis with logrank testing, linear and nonlinear regression for pharmacology curves, and receiver operating characteristic (ROC) analysis, which plots diagnostic sensitivity against false-positive rate to pick a cutoff.
The published record shows how consistently this workflow appears across fields and versions. A pediatric renal function study comparing the Bedside Schwartz equation with measured creatinine clearance ran its statistics in Prism 10 [1]. A periodontal trial comparing advanced platelet-rich fibrin with a connective tissue graft used Prism 8.0 and checked normality with the Shapiro-Wilk test (a test of whether data follow a normal distribution) before selecting a t-test or the nonparametric Mann-Whitney test [2]. A zebrafish model of Alzheimer disease, with 60 fish in five treatment groups, analyzed behavioral and histology outcomes using one-way ANOVA followed by Tukey multiple comparisons in Prism [3]. A questionnaire survey of healthcare worker awareness used Prism VII with t-tests and ANOVA to compare scores between groups [4], and a dental ELISA (enzyme-linked immunosorbent assay) study ran its ANOVA and Tukey tests in Prism 5 [5]. The span from Prism 5 to Prism 10 tells you two things. The standard assay paper fits Prism comfortably, and methods sections are expected to report the exact version used, because defaults and algorithms change between releases.
Where Prism Excels
Guided analysis is the headline strength. The dialogs force you to state paired versus unpaired designs, parametric versus nonparametric assumptions, and your multiple-comparison method, which blocks many silent errors that beginners make in scripted code. Speed is the second strength: a four-group experiment can go from raw numbers to a labeled, publication-format figure in under an hour. Curve fitting deserves special mention, because nonlinear regression for dose-response and binding curves (for example, a four-parameter logistic model, the standard sigmoid shape for drug responses) is a daily task in pharmacology and biochemistry and is a first-class Prism feature. Exports to TIFF, EPS, and PDF at controlled resolution meet most journal figure requirements without extra software.
Where Prism Falls Short
Click paths are hard to document. When an analysis involves a chain of menu choices, a methods paragraph cannot capture them, and rerunning everything after a data correction means manual work repeated figure by figure. Fine visual control is bounded: you can adjust most elements, but unusual panel layouts, fully custom typography, and batch styling fight the software. Scale is a hard limit, because the table model assumes assay-sized data rather than the tens of thousands of features in a modern omics (high-throughput measurement of many genes, proteins, or metabolites at once) experiment. Access matters too. Prism is paid commercial software with academic licensing options, so a collaborator without a license cannot open your project files or extend your analysis.
What R and ggplot2 Are
R is a free, open-source programming language for statistical computing, and ggplot2 is its most widely used plotting package, part of the tidyverse collection. ggplot2 implements the grammar of graphics, a design system in which a figure is built by mapping data to visual properties (called aesthetics, such as x position, color, and size) and stacking layers such as points, lines, bars, and error bars. A minimal plot takes one line, for example ggplot(data, aes(x = group, y = value)) + geom_point(), and you add axis labels, color scales, themes, and small multiples with further lines. Saving uses ggsave(), which writes PDF, PNG, or TIFF files at a resolution and size you set.
The architectural point bears repeating: ggplot2 draws, it does not decide. You run t-tests, ANOVA, linear models, or survival analysis with R's own functions or add-on packages, then pass the results to ggplot2. Extension packages bring common biological formats within easy reach. ggpubr adds significance brackets and p-values to boxplots, survminer draws Kaplan-Meier curves, and patchwork arranges separate panels into one composite figure. Installation runs through R's central package archive (CRAN), every piece is free, and most people write in the free RStudio editor.
The R Ecosystem Is the Real Argument
The statistics packages are why many labs adopt R at all. Differential expression tools such as DESeq2 and limma for transcriptomics, ChAMP for DNA methylation, and Multi-Omics Factor Analysis (MOFA) for integrating data types are written in R, and pipelines such as BiomiX chain them together with false discovery rate (FDR, the expected share of false positives among declared findings) correction before generating report figures [6]. Wrapped tools make common outputs easier still. ProteoArk produces manuscript-ready principal component analysis (PCA, a dimension-reduction summary of the largest variance patterns) plots, heatmaps (color-coded matrices), MA plots, and volcano plots (effect size against statistical significance) from proteomics search results in one click [7]. FLASHApp provides interactive, publication-ready visualizations for top-down proteomics with shareable URLs for team collaboration [8]. PopMLvis runs several population-structure algorithms in one interactive platform and outputs figures ready for integration into scientific articles [9]. These tools cover predefined workflows well, but they stop where their designers stopped. When your question falls outside them, you write R directly, and ggplot2 is the drawing engine behind most of that literature.
Python offers a parallel scripted world. pyOpenMS-viz extends pandas DataFrames (R and Python both use this table structure for data) so that a standard mass spectrometry plot takes a single line of code [10], and plot-misc adds biomedical archetypes such as forest plots, survival plots, volcano plots, and heatmaps on top of matplotlib [11]. The lesson generalizes beyond one language: scripted visualization wins on reproducibility and scale, while point-and-click tools win on immediacy. That trade-off is the heart of the GraphPad Prism vs ggplot2 decision.
Side-by-Side Comparison
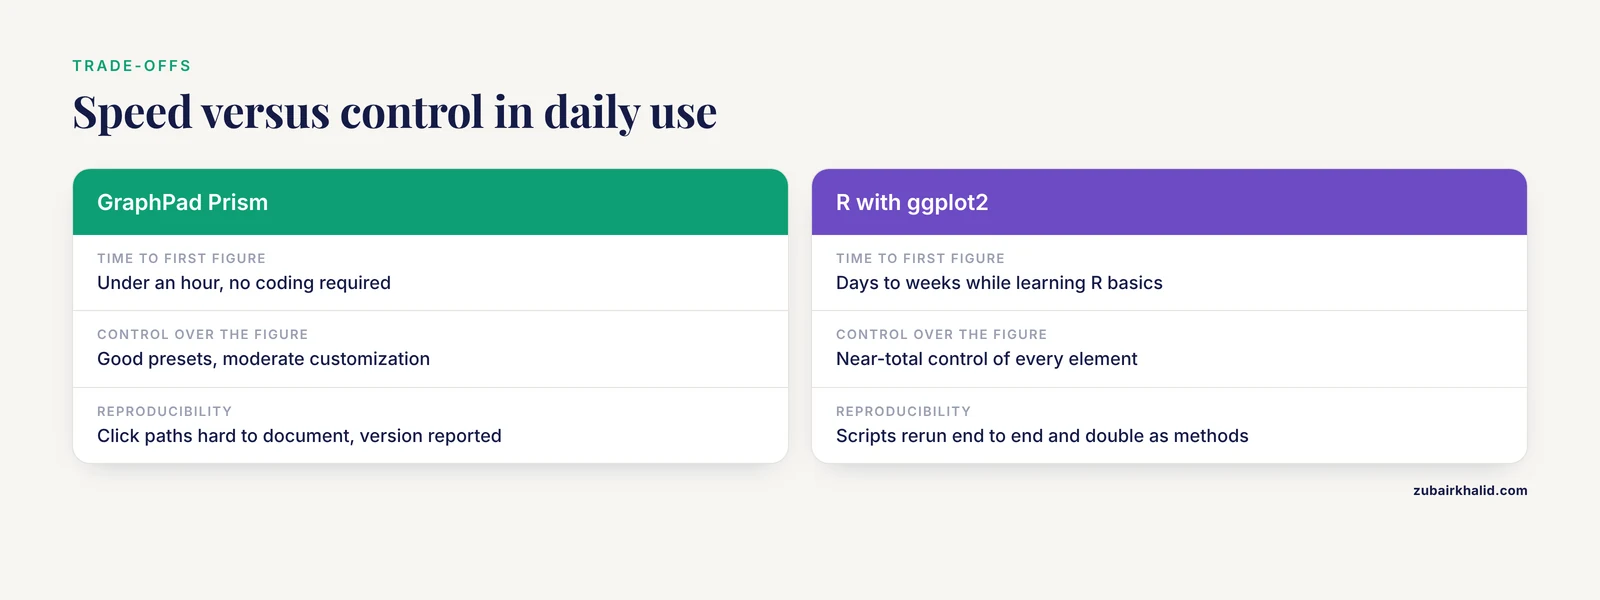
The table below summarizes the two options on the criteria that come up in real project decisions.
| Criterion | GraphPad Prism | R with ggplot2 |
|---|---|---|
| Cost and license | Paid commercial software, academic licenses available | Free and open source |
| Interface | Point-and-click dialogs with structured data tables | Code written in R, usually in the free RStudio editor |
| Time to first figure | Under an hour, no coding required | Days to weeks while learning R basics |
| Core statistics | Guided t-tests, ANOVA with post hoc corrections, nonparametric tests, survival analysis, regression, ROC curves | All of base R plus thousands of packages, including omics pipelines such as DESeq2 and limma |
| Figure control | Good presets, moderate customization | Near-total control of every element through code |
| Reproducibility | Click paths are hard to document, version reported in methods | Scripts rerun end to end and double as the methods section |
| Automation | Manual per figure, limited batch options | Loops and functions generate dozens of consistent figures |
| Data size | Assay-sized tables | Large files and high-throughput datasets |
| Collaboration | License required to open project files | Scripts and packages shared freely |
| Best for | Standard assays, clinical figures, curve fitting | Custom analyses, pipelines, lab-wide figure styles |
GraphPad Prism vs ggplot2: The Criteria That Decide Real Choices
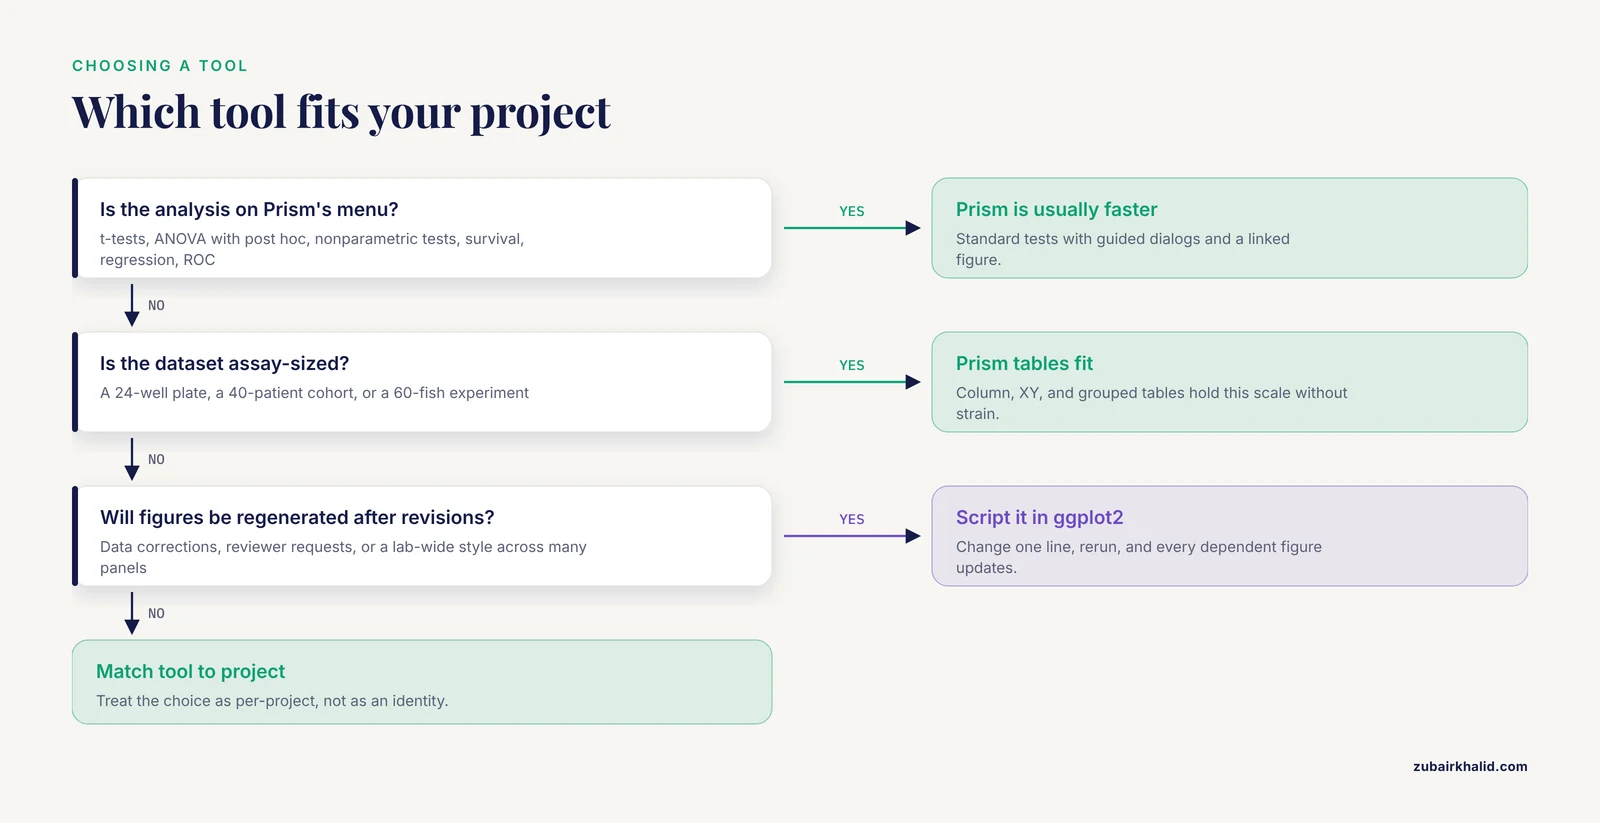
A benchmarking effort that evaluated 26 widely used visualization tools scored them on ease of use, customizability, financial cost, and required background knowledge, and proposed a figure-quality scoring system called M.E.D.V.I.S. . Those criteria, plus reproducibility and data scale, are exactly the ones that decide between GraphPad Prism or ggplot2 for a given project.
Speed to First Figure
Prism wins on a clock. Install the software, paste a column of numbers, click the analysis, and a formatted figure appears the same afternoon. ggplot2 requires installing R and an editor, learning how data frames work, and writing syntax before anything appears on screen. A motivated student can produce a first boxplot from a tutorial in a day, but comfortable speed takes weeks of regular use. For a one-off analysis with a deadline, that difference decides the question.
Depth and Flexibility of Statistics
Prism covers the common tests of bench and clinical biology well, and its guided flow is safer for a novice than hand-written code. R covers that list and everything beyond it: mixed-effects models for repeated measures, generalized models for counts and proportions, resampling and bootstrap methods, Bayesian tools, and entire genomics pipelines. The practical test is simple. If your analysis appears on Prism's menu, Prism is usually faster and adequately rigorous. If it does not, there is no button to click, and R is the realistic path.
Control Over the Figure
Prism presets are respectable but bounded, and most journals accept them without complaint. ggplot2 exposes every element of a plot to code, from tick-label fonts to facet spacing, which matters when a lab wants one visual style across hundreds of panels. The trade-off is real, because low-level scripting can produce verbose, brittle code that demands considerable programming experience and limits reuse between projects, which is precisely why archetype packages such as plot-misc wrap common biomedical figure types in higher-level functions [11]. Control costs effort in both directions.
Reproducibility and Automation
A ggplot2 script is self-documenting. When a reviewer requests a subgroup analysis, you change one line and rerun, and every dependent figure updates. Interactive tool builders feel the same pressure from the opposite side, and FLASHApp was created partly because manual processing between analysis steps undermines reproducibility and consistency of results [8]. Prism's answer to reproducibility is a saved project file plus a methods paragraph, which works well for small projects and strains under long revision cycles or multi-figure pipelines.
Cost, Access, and Collaboration
Prism requires a paid license, with academic pricing and trial options, so budgeting and procurement enter the picture for labs and students. R and ggplot2 are free, which means a collaborator on another continent can run your script without a purchase order. The counter-cost of R is time, because learning hours are a genuine expense. They are also an investment that transfers to careers in biostatistics and data science rather than staying locked to one package.
Data Size and Data Type
A 24-well plate, a 40-patient cohort, or a 60-fish experiment fits Prism's tables without strain. A proteomics run measuring thousands of proteins across conditions does not, and no amount of clicking closes that gap. High-throughput work lives naturally in R, which is why omics pipelines are written there and why their figure outputs, from volcano plots to heatmaps, follow ggplot2 conventions [7], [6].
When to Use GraphPad Prism
Choose Prism when most of the following hold. The analysis is a standard group comparison, dose-response fit, survival curve, or ROC analysis. The dataset is assay-sized. The deadline is near. The team does not code, and the figures will be made once or twice rather than regenerated across revisions. This describes the majority of single-experiment papers in pharmacology, dentistry, and basic medical research, and it matches the published usage pattern from Prism 5 through Prism 10,,, [5]. Getting started takes an afternoon: open a column table, run a one-way ANOVA, tick the Tukey correction, label the axis with units, and export a TIFF.
When to Use R with ggplot2
Choose R when any of the following hold. The data are high-throughput or the analysis is custom. Figures must be regenerated after data corrections or reviewer requests. A lab wants one consistent style across many figures and authors. Students and collaborators need free access. Or you are building skills for a career where scripted analysis is the daily tool. Getting started is a staged process: learn data frames, then the ggplot, aes, and geom trio, then themes and ggsave, then one extension such as ggpubr, working from a template script rather than a blank file.
Worked Scenarios
Scenario 1: A Four-Group Pharmacology Study
Twenty-two mice in four groups (control, standard drug, two test doses) with rotarod and locomotor endpoints. This is essentially the design of a published cinnamon bark extract study that ran ANOVA with Tukey post hoc tests in Prism [13]. Prism is the right call here. Enter a column table, run one-way ANOVA, select Tukey, adjust the axis label, and export. The same project is equally valid in R but costs a beginner a day of syntax errors for no analytical gain.
Scenario 2: Clinical Assay Validation
A published NT-proBNP assay evaluation measured 2,277 healthy individuals to build age- and sex-stratified reference ranges, then ran precision, linearity, and method-comparison work across Excel, MedCalc, and Prism 9 [14]. A soluble P-selectin study of 144 subjects similarly combined Excel, Prism 9.4.1, and MedCalc for Kruskal-Wallis tests, Dunn's post hoc comparisons, Spearman correlation (a rank-based measure of association), and ROC curves [15]. Clinical validation teams routinely chain tools this way. Prism handles group comparisons and ROC curves comfortably, MedCalc specializes in method-comparison statistics, and Excel remains the shared record of lab data. This is the clearest case for GraphPad Prism as the statistics workbench inside a multi-tool clinical workflow rather than as a total solution.
Scenario 3: High-Throughput Omics
A proteomics experiment yields thousands of proteins across treatment conditions, and you need PCA, heatmaps, volcano plots, and differential expression with FDR correction. Prism's table model does not fit this scale. R fits naturally, which is why pipelines such as BiomiX chain DESeq2, limma, and MOFA inside R and emit report figures directly [6]. If your workflow matches a wrapped tool, ProteoArk's one-click manuscript-ready figures can spare you the coding [7]. If it does not, you write ggplot2, and the script becomes part of your methods.
Scenario 4: A Lab-Wide Figure Style
A lab submits papers with 40 panels each and revises figures for years. Point-and-click regeneration does not scale, and manual intervention between analysis and figure steps is exactly what undermines reproducibility in multi-step workflows [8]. A shared ggplot2 theme plus archetype functions for forest, survival, and volcano plots gives every figure the same typography and palette, and one script run regenerates the full set after any data change [11]. Before submission, score the output against the M.E.D.V.I.S. criteria of complexity, color usage, whitespace, and the number of distinct visualizations per figure [12].
Common Mistakes and Limitations
Choosing the Test by Habit
Paired designs need paired tests, skewed data need nonparametric tests, and post hoc comparisons only make sense after an overall test with a correction applied. Prism's dialogs prompt for these choices. R leaves them entirely to you, so the error risk in R sits in the code you write, not in the software. Whichever tool you use, decide the test plan before looking at the results.
Treating ggplot2 as the Statistics
ggplot2 draws. Running a test inside a plotting helper without checking its assumptions produces confident-looking wrong figures. Keep analysis and plotting as separate, labeled steps in the script.
Trusting Defaults
Default colors, missing units, and cramped whitespace are the most common figure complaints. Score your figures against the M.E.D.V.I.S. criteria of complexity, color usage, whitespace, and the number of distinct visualizations [12], use colorblind-safe palettes, and put units on every axis.
Underestimating the Learning Curve
Scripted tools can produce verbose, brittle code that demands considerable programming experience when used at a low level [11]. Budget weeks rather than hours for R comfort, and start from a working template rather than a blank file. The same skill then produces analyses as well as figures.
Skipping Version Reporting
Published methods sections report exact versions, and behavior differs between releases. Report your software and version for either tool, as the studies cited throughout this article do for Prism 5 through Prism 10 [1],,, [15],,.
Assuming One Tool Must Win
The best software for researchers is the one that matches the analysis, the deadline, and the team. Clinical studies combine Excel, MedCalc, and Prism [14], [15]. Omics teams combine wrapped pipelines with hand-written R,. Treating tool choice as an identity rather than a per-project decision wastes time in both directions.
Frequently Asked Questions
Is GraphPad Prism or ggplot2 better for a beginner?
Prism, for most biology beginners. Its guided dialogs walk you through test choices and produce a finished figure without code. ggplot2 requires learning R first, which takes weeks before figures come easily.
Is ggplot2 free while Prism is paid?
Yes. R and ggplot2 are free and open source, so anyone can install and run your scripts. Prism requires a paid license with academic pricing options, and collaborators without a license cannot open your project files.
Can GraphPad Prism do everything R can?
No. Prism covers the standard tests of bench and clinical biology well, but R's package ecosystem extends to omics pipelines, mixed models, custom simulations, and any analysis a programmer can describe. If a test is on Prism's list, Prism is often faster. If it is not, R is usually the only option.
Do journals prefer Prism figures or ggplot2 figures?
Journals judge format, resolution, and clarity, not the tool that made the figure. Both produce journal-ready output. Report the software and version in your methods section either way.
Can I use both Prism and ggplot2 in the same project?
Yes, and many labs do. A common pattern uses Prism for quick assay figures and R for large datasets, custom panels, and anything that must be regenerated. Export both to the same file formats and combine them at figure assembly.
Which should I learn for a career in biostatistics or data science?
Learn R. Biostatistics, genomics, and data science roles expect scripted, reproducible analysis, and the package ecosystem you would use daily lives in R. Prism remains common in wet-lab and clinical settings, so familiarity helps, but R is the transferable career skill.
Sources
- Comparison of Bedside Schwartz equation and measurement of creatinine clearence in children and adolescents
- Comparison Between the Use of Advanced Platelet-Rich Fibrin (A-PRF) and Connective Tissue Graft in the Treatment of Cairo Type 1 Gingival Recession Associated with the Coronally Advanced Flap
- Evaluation of the Neuroprotective Effect of Lawsonia inermis Flower Extract in Alzheimer’s Disease-induced Zebrafish Model
- Rising t i des of res istance: evaluation of h ealth care worke rs aw ar en ess regarding ar tific i al inte l l igenc e to com bat antim icrob i al res i stance in Pakistan.
- In vitro quantitative comparison of the release of growth factors - Transforming growth factor-β1, vascular endothelial growth factor-A and platelet-derived growth factor-AB from root canal dentin after conditioning with 17% ethylenediaminetetraacetic acid and 10% citric acid
- BiomiX, a user-friendly bioinformatic tool for democratized analysis and integration of multiomics data.
- ProteoArk: A One-Pot Proteomics Data Analysis and Visualization Tool for Biologists.
- FLASHApp: Interactive Data Analysis and Visualization for Top-Down Proteomics.
- PopMLvis: a tool for analysis and visualization of population structure using genotype data from genome-wide association studies.
- pyOpenMS-viz: Streamlining Mass Spectrometry Data Visualization with pandas.
- Effective visualization of biomedical data using plot-misc.
- What is a "Good" figure: Scoring of biomedical data visualization.
- EVALUATION OF SKELETAL MUSCLE RELAXANT ACTIVITY OF AQUEOUS EXTRACT OF CINNAMOMUM VERUM BARK ON SWISS ALBINO MOUSE
- Analytical and clinical performance evaluation of a new NT-proBNP assay
- Evaluation of Soluble P-selectin in Patients with Venous Thrombosis - An Observational Study