Gantt Chart vs. Milestone Table for Grant Proposals
By Dr. Zubair Khalid, DVM, MS, PhD ·

A Gantt chart shows every task of a project plotted against calendar time, while a milestone table lists only the major checkpoints a project must hit and when. The rule of thumb is simple. Use a Gantt chart when reviewers need to see how work fits together and where tasks overlap, and use a milestone table when reviewers need to see, at a glance, what will be delivered and when. Many strong proposals use both, with the Gantt chart carrying the detail and the milestone table carrying the summary.
This article explains the difference between a Gantt chart and a milestone table in the context of grant proposal planning, shows how each one works on its own terms, compares them on the criteria that actually decide which one you should use, and walks through worked scenarios for common grant types.
What a Gantt Chart Is
A Gantt chart is a horizontal bar chart that maps project tasks onto a calendar. Each task gets its own row. Time runs left to right across the top, divided into months, quarters, or years. A bar spans from the start date of a task to its end date. When two bars sit on the same rows of the calendar at the same time, you can see immediately that those tasks run in parallel. When one bar ends where another begins, you can see a dependency, meaning the second task cannot start until the first one finishes.
In a grant proposal, a Gantt chart usually covers the full award period. A three-year project gets a grid with three columns of years or twelve columns of quarters. Tasks might include staff hiring, protocol approval, instrument purchase, data collection waves, analysis periods, manuscript preparation, and reporting deadlines. Many researchers add diamond symbols or shaded cells to mark decision points within the bars.
The core strength of a Gantt chart is that it answers scheduling questions. Which activities happen at the same time. Where the critical path sits, meaning the sequence of tasks that determines the earliest possible finish date. What happens if one activity slips. A reviewer can trace a single row and see one workstream from start to finish, or read down a vertical slice and see everything that must happen in a given quarter.
The cost of that detail is effort. Building a Gantt chart forces you to decompose the project into tasks, estimate durations, and think through dependencies before you have drafted a single aim. That effort is not wasted, because the same decomposition feeds the budget justification, the staffing plan, and the research strategy narrative. But it takes time, and it takes revision every time the project design changes.
A Gantt chart also communicates staffing. If you add a row for each person rather than each task, the chart shows when a postdoctoral researcher is doing fieldwork, when a statistician is active, and where personnel gaps fall. That version, sometimes called a staffing or effort Gantt, is common in proposals with several named personnel.
What a Milestone Table Is
A milestone table is a compact list of the major checkpoints in a project, each with a target date and usually a way to tell whether the checkpoint was reached. A milestone is a significant, verifiable event rather than an activity. "Collect samples" is an activity. "Enroll 120 participants" or "Complete pilot dataset analysis" or "Submit first manuscript" are milestones, because you can look at the project on a given date and say yes or no.
Most milestone tables in grant proposals have three or four columns:
| Milestone | Target date | Success criteria | Responsible person |
|---|---|---|---|
| IRB approval secured | Month 3 | Approved protocol on file | PI |
| 60 participants enrolled | Month 12 | Enrollment log verified | Site coordinator |
| Primary analysis complete | Month 24 | Locked dataset and results memo | Statistician |
Some funders ask for a specific variant of this format. Others simply ask for a "timeline" or "project schedule" and accept either format. What matters to the reviewer is that the table states what will be true at each date and how you would know.
The core strength of a milestone table is that it converts a project into a set of promises. Each row is something the program officer can hold you to during the award. That is why milestone tables do a second job after the proposal is funded. Progress reports often ask whether milestones were met, and a well-written table from the proposal becomes the checklist for the entire award period.
The limitation is what the table leaves out. A milestone table does not show parallel work, task duration, dependencies, or staffing. Two very different projects can produce nearly identical milestone tables, because the table records outcomes rather than the work that produces them.
Side-by-Side Comparison
This table summarizes the gantt chart vs. milestone comparison on the criteria that matter in grant proposal planning.
| Criterion | Gantt chart | Milestone table |
|---|---|---|
| What it shows | All tasks plotted across calendar time | Major checkpoints with target dates |
| Time resolution | Fine, often months or weeks | Coarse, usually quarters or years |
| Question it answers | How and when will the work get done | What will be delivered and when |
| Shows dependencies | Yes, visible in bar sequences | No |
| Shows parallel work | Yes | No |
| Shows staffing or effort | Yes, in a personnel variant | Rarely |
| Verifiable checkpoints | Not directly | Yes, by design |
| Effort to build | High, requires full task breakdown | Low, 8 to 12 rows is typical |
| Effort to revise | High, every change ripples through bars | Low, edit individual rows |
| Risk in a proposal | Clutter and unreadable detail if overbuilt | Vagueness if milestones are activities in disguise |
| Best project stage | Execution-focused planning and complex projects | Early planning, summary pages, and award reporting |
| Post-award use | Internal project management | Direct input to progress reports |
Gantt Chart vs. Milestone Table: Which Reviewers Expect
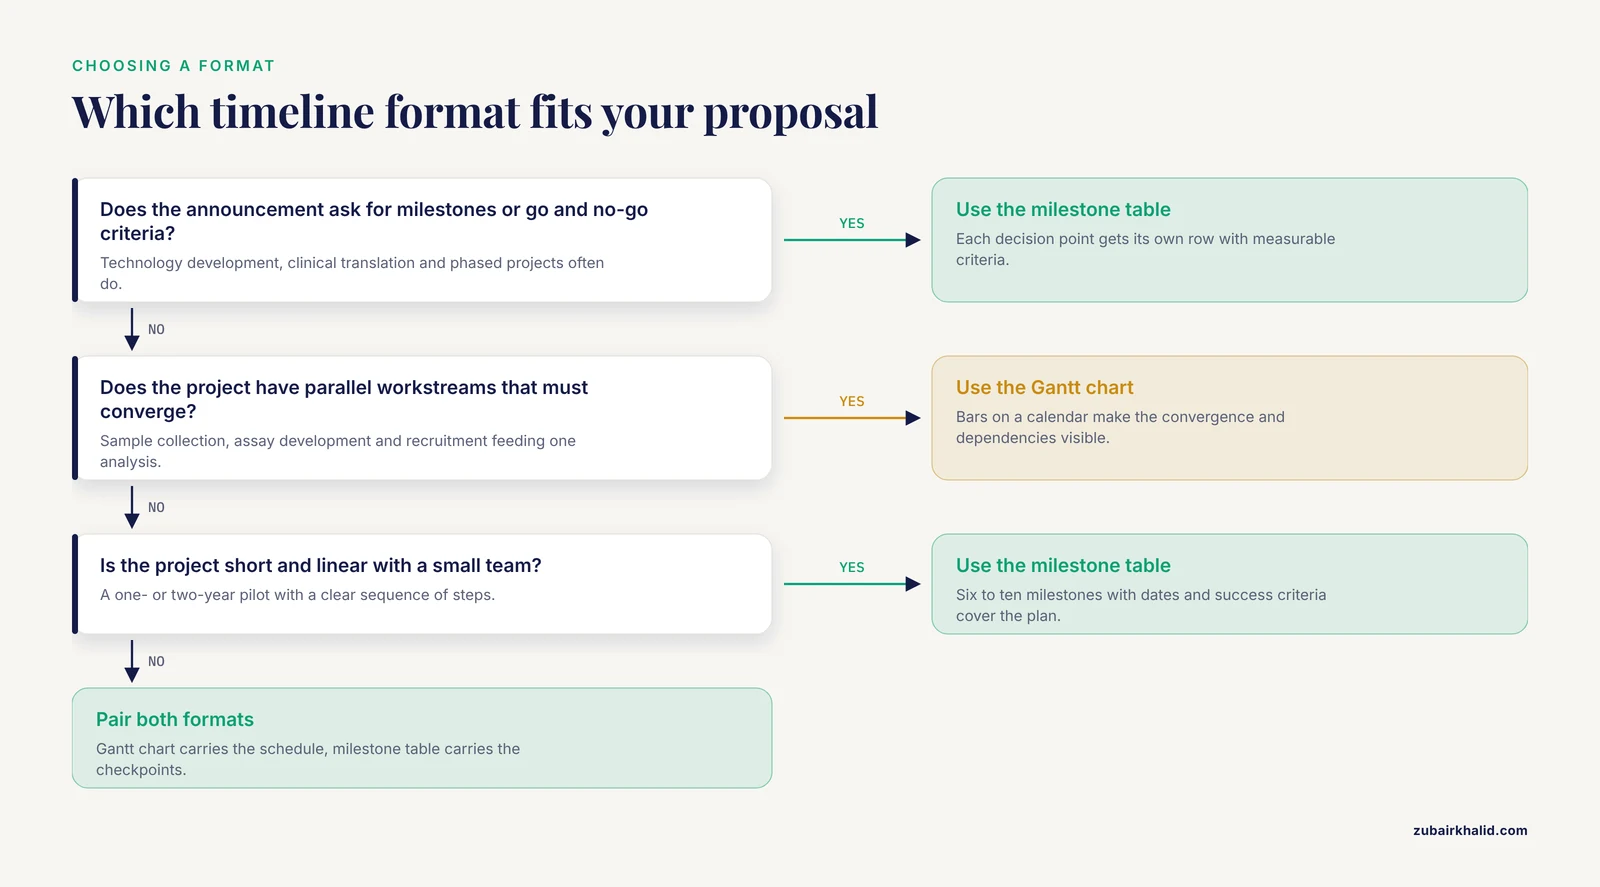
The difference between a Gantt chart and a milestone table for grant proposal purposes is less about format than about what the funder wants to verify. Reading the funding announcement answers most of the question.
When a program announcement asks for a "research strategy," "work plan," or "project timeline" without specifying a format, either option is acceptable, and reviewers generally judge the planning quality rather than the diagram type. When an announcement asks for "milestones" and "go and no-go decision points," it is explicitly asking for the table, and delivering a bar chart without a checkpoint list will read as unresponsive. When an announcement asks for a detailed schedule of activities, a timeline of tasks, or a project management plan for a large collaborative effort, that is a request for Gantt-level detail.
Two funder behaviors shape the choice in practice. First, large project grants and center grants, which coordinate many people and workstreams over several years, are the settings where reviewers most often want to see scheduling logic. Second, funders of nearly every size ask funded investigators to report progress against stated plans during the award. Milestones written at proposal time become the reference points for those reports, so the table has a life beyond the review panel.
Some review criteria name feasibility and the adequacy of the timeline as scored elements. In those competitions, whichever format demonstrates feasibility most clearly for your specific project is the one that earns the points. A one-person pilot study with a clear sequence of steps may demonstrate feasibility better with a milestone table. A project with three parallel workstreams feeding a shared analysis may need the Gantt chart to prove the schedule holds.
When to Use a Gantt Chart
Choose the Gantt chart in these situations.
The project has parallel workstreams that must converge. If sample collection, assay development, and recruitment run at the same time and all three feed a midpoint analysis, a milestone table hides the concurrency. A Gantt chart makes the convergence visible, which is exactly what a reviewer assessing feasibility needs to check. If workstream A finishes two months late, the chart shows whether the analysis start date survives.
The project spans multiple years with seasonal or phased work. Field seasons, academic terms, clinical enrollment waves, and animal breeding cycles create recurring windows of activity. Bars on a calendar show those windows and the gaps between them in a way that a list of dates cannot.
The funder or the team will use the plan to manage execution. Grants with subawards, core facilities, or multi-site coordination benefit from a document the project manager can update monthly. The chart started for the proposal becomes the working schedule after the award.
You need to justify personnel effort. A personnel Gantt chart, with one row per key person and bars showing when each person is active on each task, doubles as evidence for the staffing plan and the budget justification. This format is standard in collaborative and multi-PI proposals.
The main caution is overbuilding. A Gantt chart with 60 rows and weekly resolution across five years is unreadable at the page size proposals allow. Consolidate to the 12 to 25 most meaningful workstreams, use quarterly resolution for multi-year projects, and save the fine detail for an internal version.
When to Use a Milestone Table
Choose the milestone table in these situations.
The project is linear and short. A one- or two-year pilot with a sequence of steps, a clear deliverable, and a small team does not need scheduling machinery. Six to ten milestones with dates and success criteria communicate the whole plan in a third of a page.
The funding announcement asks for milestones or go and no-go criteria. Some programs, particularly those funding technology development, clinical translation, and phased projects, want explicit decision points with predefined criteria for continuing. The milestone table is the natural home for those criteria. Each decision point gets its own row, with the go criterion stated in measurable terms.
You want the table to do double duty after the award. Because progress reports ask whether planned milestones were achieved, a table written at proposal time becomes the framework for reporting for the life of the grant. Investigators who write verifiable milestones at the start spend far less time reconstructing their accomplishments two years later.
Page limits are tight. A milestone table compresses into a small space and remains legible. When the timeline must share a page with the specific aims or the budget summary, the table usually wins.
The main caution is vagueness. A milestone such as "data analysis" is an activity, not a checkpoint, and reviewers notice. Rewrite it as "complete primary analysis and circulate results memo" with a month number and you have a promise instead of a label.
Worked Scenarios
The following scenarios show the choice in the settings that generate the most questions from early-career applicants.
Scenario 1: A five-year single-PI research project grant
A cell biologist proposes a five-year project with three specific aims. Aim 1 develops a reagent, Aim 2 applies it in cell models, and Aim 3 applies it in an animal model. The work is largely sequential with some overlap between Aims 1 and 2.
The right primary format is the Gantt chart. Five years is long enough that reviewer confidence in the schedule depends on seeing the sequencing logic. The chart might have 15 rows covering reagent generation, validation, each experimental campaign, the animal work with its ethics approval and colony establishment steps, analysis periods, and manuscript targets. Quarterly resolution keeps it legible.
The applicant should still include a short milestone table alongside the chart. Useful milestones for this project include regulatory or animal protocol approval by month 3, validated reagent by month 9, completion of the Aim 1 experimental campaign by month 18, first manuscript submitted by month 24, and the Aim 3 animal study initiated by month 30. The chart proves the schedule works. The table gives the reviewer, and later the program officer, five dates to check.
Scenario 2: A two-year pilot or small grant
A junior investigator proposes a two-year pilot with one technician and a single cohort of participants. The work is sequential. Recruit, enroll, collect, analyze, report.
The right primary format is the milestone table. The project has no meaningful parallelism to display, and a two-year Gantt chart for four people adds visual weight without adding information. Eight milestones with target months and success criteria, such as "protocol approved by month 4," "50 percent of target enrollment by month 10," "database locked by month 20," and "manuscript submitted by month 23," cover the plan completely.
If the applicant suspects reviewers will probe feasibility, for example whether recruitment of the full cohort in 12 months is realistic, a small Gantt chart covering just the enrollment and collection period can answer that specific concern without replacing the table as the primary format.
Scenario 3: A multi-site clinical study
A three-site clinical study involves protocol approval at each site, site training, staggered enrollment, a coordinated data freeze, and a single analysis team. This is the classic case for the Gantt chart. The reviewer needs to see that site B starts enrollment after its regulatory approval, that all three sites finish collection before the data freeze, and that the analysis period follows the freeze with enough time for the planned primary analysis.
This scenario also illustrates the strongest combined format. A one-page Gantt chart carries the schedule. A milestone table beneath or beside it lists the six to eight checkpoints, including each site's approval date, the aggregate enrollment target with a date, the data freeze, and the primary results meeting. The chart answers "how," the table answers "what and when."
Scenario 4: A training fellowship or career development award
A fellowship proposal centers on one person's development plan plus a bounded research project. The primary format is the milestone table, organized partly by research checkpoints and partly by training events, such as completing required coursework, presenting at a national meeting, and submitting the first first-author manuscript. A compact Gantt chart can still help when the research plan has genuinely parallel elements, but most fellowship timelines are linear enough that the table alone reads better.
Scenario 5: A phased technology development project
Projects that build a device, a dataset, or a software tool often carry explicit decision points. A prototype is either functional or it is not. A benchmark is either met or it is not. Here the milestone table is essential because the funder wants go and no-go criteria in writing, but a Gantt chart is usually also needed because development work involves overlapping design, build, and test cycles. Present the table first, with each decision point and its criteria, then attach the chart as the operational schedule.
How to Build Each One Well
Building a Gantt chart for a proposal
- List every workstream, not every microtask. Aim for 12 to 25 rows for a project grant.
- Assign each row a start and end point on the award calendar, which typically begins at month 1 rather than a calendar date, because award start dates shift.
- Draw dependencies explicitly in your own planning even if the final graphic does not draw arrows. If the analysis depends on the data freeze, the bars must reflect that.
- Mark decision points and reporting deadlines on the chart, often with diamonds or distinct symbols, so the chart and the milestone table agree.
- Label generously inside or beside bars. Reviewers should not need to decode row numbers against a legend.
- Test readability at print size. If text is illegible at the final page width, consolidate rows or reduce resolution.
Spreadsheet software is sufficient for most proposal charts, and dedicated project management tools add dependencies and automatic recalculation that pay off after the award. Whatever tool you use, keep an editable master file. You will revise the chart more than any other proposal element except the specific aims.
Building a milestone table for a proposal
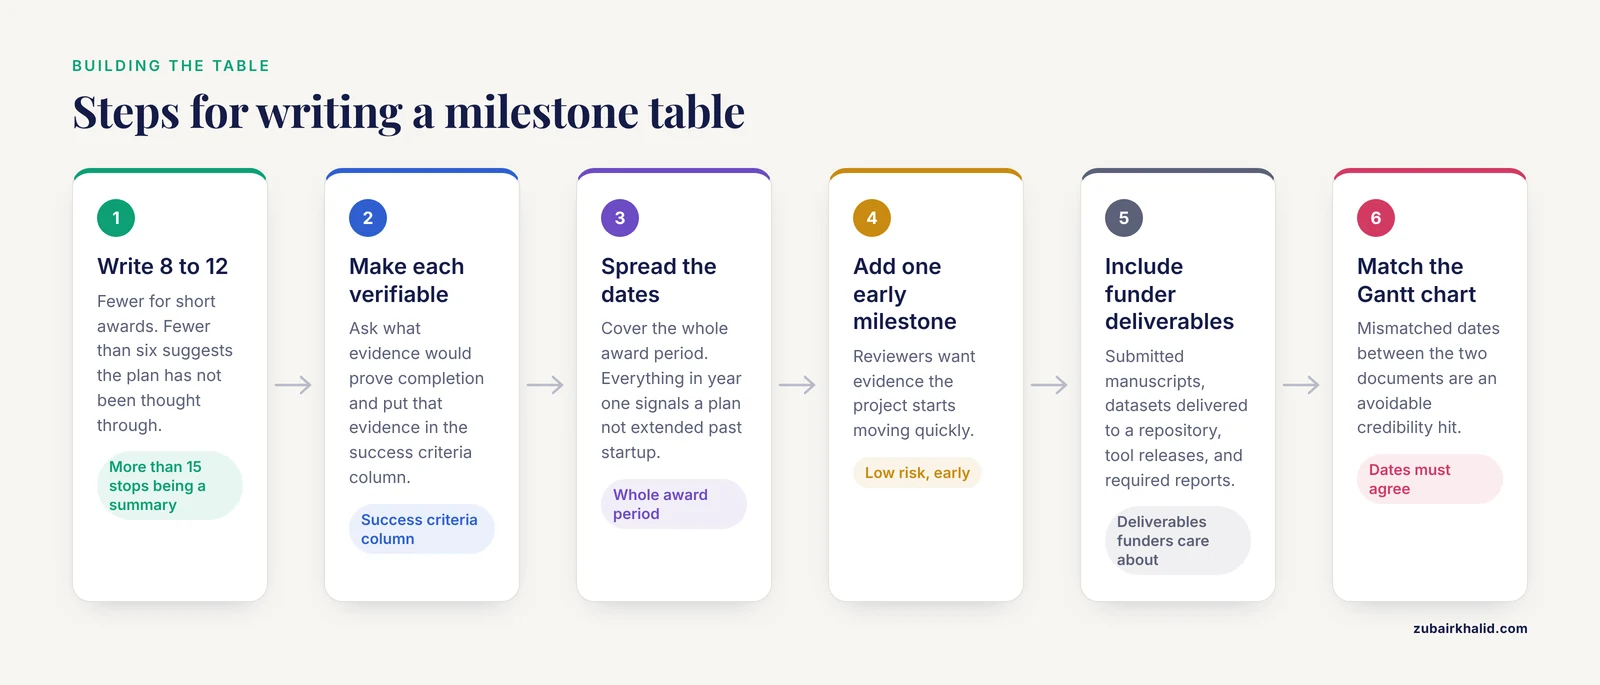
- Write 8 to 12 milestones for a typical project grant, fewer for short awards. Fewer than six suggests the plan has not been thought through. More than 15 stops being a summary.
- Make each milestone verifiable. Ask what evidence would prove completion, and put that evidence in the success criteria column.
- Spread the dates across the whole award period. A table with every milestone in year one and nothing after signals a plan that has not been extended past the startup phase.
- Include at least one early, low-risk milestone. Reviewers want evidence the project starts moving quickly.
- Include deliverables the funder cares about, such as submitted manuscripts, datasets delivered to a repository, tool releases, and required reports.
- Align the dates exactly with the Gantt chart if you include both. Mismatched dates between the two documents are an avoidable credibility hit.
Using Both Together
The gantt chart or milestone table question is often a false choice. The strongest pattern in grant proposal planning is a paired presentation. The Gantt chart occupies the main timeline figure and carries tasks, phases, and staffing. The milestone table sits beneath it or on the facing page and lists the checkpoints with dates and success criteria. The two documents must agree, and each references the other.
This pairing works because it serves two different reading behaviors. Some reviewers read the narrative and want the schedule picture. Others scan the plan for concrete commitments. One format serves each reader, and neither format has to do a job it is bad at.
The pairing also survives into the award period. Program officers typically track milestones, while the research team manages tasks. Keeping both documents current means the internal plan and the external commitments never drift apart.
Common Mistakes and Limitations
Treating activities as milestones. "Begin data collection" and "continue analysis" are not checkpoints. Every milestone should pass the yes-or-no test on a given date.
Density without information. Gantt charts packed with dozens of thin rows, tiny fonts, and weekly resolution over five years look thorough and read as noise. Consolidate.
Dates that ignore administrative reality. Startup time for hiring, contracting, protocol review, and equipment procurement routinely takes longer than applicants assume. Build that lag into months 1 through 6 rather than starting the science at month 1.
Inconsistency between documents. If the narrative says analysis starts in year two, the chart shows year two, but the milestone table says month 14, the panel notices. Reconcile all three before submission.
Milestones no one could miss. Milestones such as "hold regular meetings" are unfalsifiable and communicate nothing. Every milestone should carry a real risk of failure if the project goes badly.
Ignoring the reporting cycle. Milestones that land just before required progress reporting dates make those reports easier to write. Milestones that land just after them create awkward reporting gaps. Align checkpoints with the reporting calendar where you can.
Treating the timeline as fixed after the award. A milestone table written at proposal time is a plan, not a contract. Most funders expect plans to evolve and want deviations explained in progress reports rather than hidden. The limitation to keep in view is that no timeline document, however detailed, guarantees feasibility, and any individual project plan should be pressure-tested with mentors, collaborators, or a structured grant writing course before submission.
Frequently Asked Questions
Do grant reviewers prefer a Gantt chart or a milestone table?
Neither format is universally preferred. Reviewers prefer whichever format proves the project is feasible, and the funding announcement often signals which one it wants. Complex multi-workstream projects read best as Gantt charts, and short linear projects read best as milestone tables.
Can I include both a Gantt chart and a milestone table in one proposal?
Yes, and for medium and large projects this is often the strongest choice. Use the Gantt chart for scheduling detail and the milestone table for verifiable checkpoints, and make sure the dates agree between the two.
How many milestones should a grant proposal include?
Eight to twelve milestones is a workable range for a multi-year project grant, with fewer for short pilots. Every milestone should be verifiable, spread across the whole award period, and tied to a real deliverable or decision point.
What software do I need to make a Gantt chart for a proposal?
None in particular. A spreadsheet with colored cells across a month or quarter grid is enough for most proposals, and dedicated project management software adds dependency tracking that becomes useful after funding.
How detailed should the timeline be in a grant proposal?
Detailed enough to show sequencing, dependencies, and realistic durations, and no more detailed than the page size allows. Quarterly resolution across the award period with 12 to 25 workstreams suits most project grants, and weekly detail belongs in your internal plan rather than the submitted document.
Should milestones change after the grant is funded?
They can, and most funders expect plans to evolve. Report any change in the required progress reports with a brief explanation, and update the milestone table so it remains the shared reference point between you and the program officer.