How to Use Gantt Charts for Research Project Scheduling
By Dr. Zubair Khalid, DVM, MS, PhD ·
By the end of this guide you will be able to build a working Gantt chart for research projects from scratch, estimate task durations with a defensible method, connect the schedule to the real constraints of a laboratory, and keep the chart alive through the whole project instead of abandoning it after week two. You will need a spreadsheet such as Microsoft Excel or Google Sheets, optionally a Python installation with matplotlib, and a draft list of the tasks in your study.
What a Gantt Chart Is
A Gantt chart depicts the tasks of a project as horizontal bars plotted against a time axis, showing each task's time span and how it overlaps with every other task [1]. That definition comes straight from how the chart is used in practice. Each row is one task. Each bar starts at the task's planned start date and ends at its planned finish date. Reading the chart top to bottom shows sequence. Reading across any single date shows everything happening at once.
Three pieces of information are visible immediately in a well-built chart:
- Sequence, meaning which tasks must finish before others can start.
- Overlap, meaning which tasks run in parallel and therefore compete for the same people, instruments, or funds.
- Slack, meaning how long a task can slip before it pushes back the project's end date.
The same overlap-reading property that makes Gantt charts useful for planning has also been used analytically. In a systematic review of COVID-19 case series, researchers plotted enrollment dates of 116 studies on a Gantt chart and used the visible overlaps to flag papers that likely reported some of the same participants twice [1]. The chart was doing what it always does, making overlaps obvious, and the researchers exploited that for a scientific purpose.
Why Gantt Charts Fit Research Project Management
Research projects differ from many business projects in two ways that shape scheduling. First, much of the work is exploratory, so durations are guesses rather than quotes. Second, resources are shared. A single microscope, a single sequencing slot, or a single trained postdoc may be the bottleneck for several lines of work at once.
A Gantt chart handles both realities better than a to-do list because it forces you to put dates and dependencies on paper where advisors, collaborators, and funders can challenge them. Grant applications routinely expect this. The KRESCENT 2.0 Health Research Training Platform, a pan-Canadian kidney research training program, included Gantt timeline charts among its core application documents during a six-month application effort spanning multiple jurisdictions and disciplines [2]. When reviewers of a major national competition expect to see a timeline, the chart is not decoration. It is the document that shows whether the team actually thought through the sequence of work.
Manual scheduling alone strains quickly once many people and shared resources are involved, a pattern documented in clinical operations where static boards and manual coordination fall behind during high-demand periods [3]. A chart will not solve coordination by itself, but it gives the team one shared, dated picture of who owes what to whom and when.
Building a Gantt Chart for Research Projects Step by Step
The walkthrough below builds a chart for a concrete example project. Suppose you run a 12-month study collecting blood samples from 120 mice across two assay batches, followed by statistical analysis and a manuscript. The same steps apply to a field survey, a bioinformatics pipeline project, or a clinical chart review.
Step 1: Break the project into tasks
Start with a work breakdown structure, which is a hierarchical list of everything that must happen. A useful rule of thumb is that each task should be small enough that you can tell within about a week whether it is finished, but large enough that it produces something checkable, such as a signed protocol, a plate of data, or a figure.
For the example project, a first-pass task list looks like this:
- Protocol and animal-use approval
- Equipment calibration
- Pilot experiments
- Main data collection
- Assay batch 1
- Assay batch 2
- Statistical analysis
- Manuscript and submission
Step 2: Estimate each duration with a three-point method
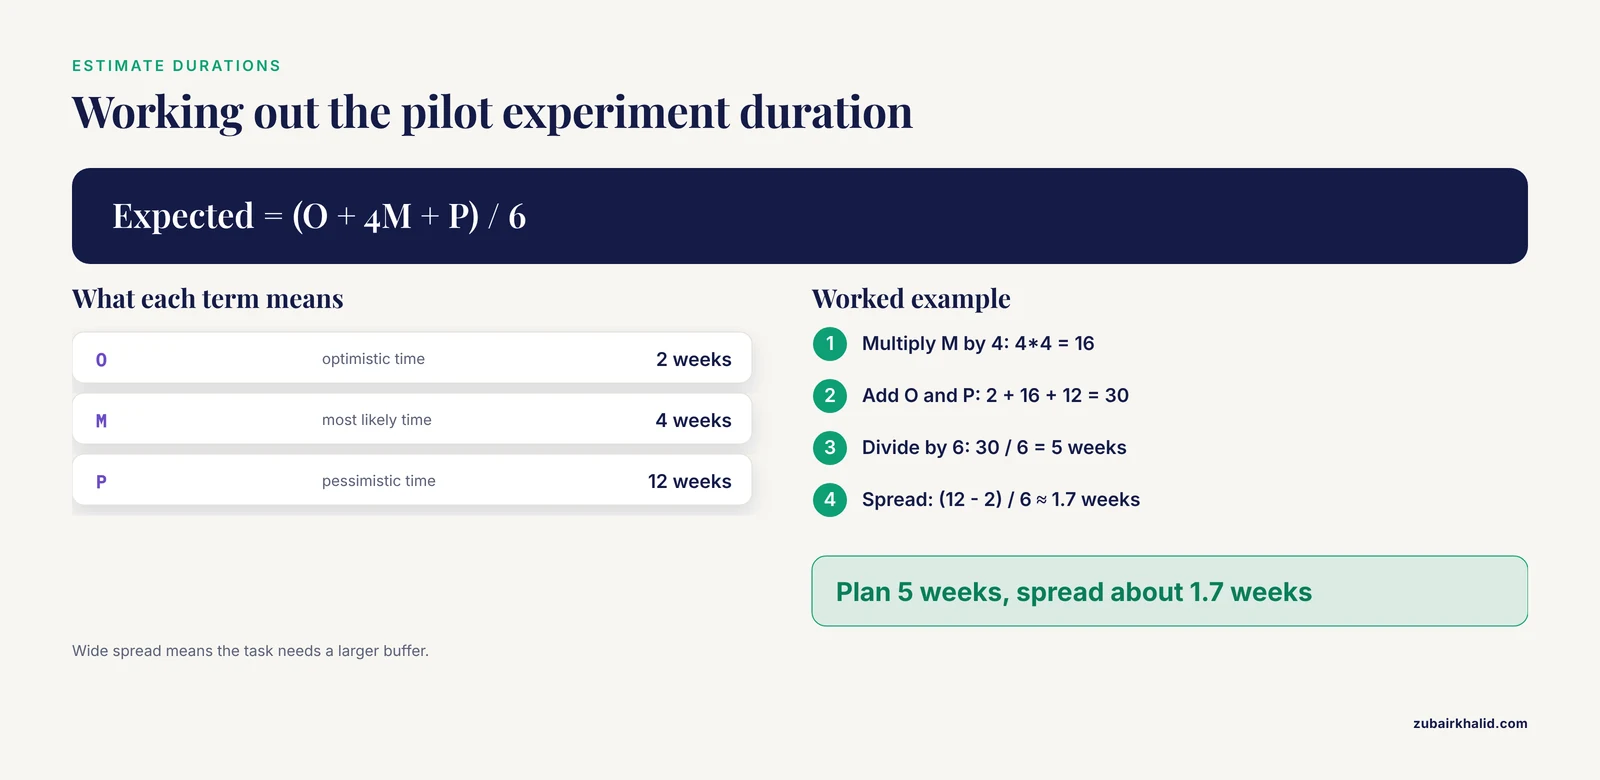
Because research tasks are uncertain, a single duration guess hides your uncertainty. The standard three-point method asks for three numbers per task: an optimistic time (O), a most-likely time (M), and a pessimistic time (P), all in the same unit. The expected duration is:
Expected duration = (O + 4M + P) / 6
Spread            = (P - O) / 6
Worked example for the pilot experiments. Suppose the pilot could go smoothly in 2 weeks, will most likely take 4 weeks, and could drag to 12 weeks if the antibody lot fails:
Expected duration = (2 + 4*4 + 12) / 6 = (2 + 16 + 12) / 6 = 30 / 6 = 5 weeks
Spread            = (12 - 2) / 6 = 10 / 6 ≈ 1.7 weeks
Plan for 5 weeks and treat the 1.7-week spread as a signal for how much buffer this task needs. Tasks with a wide spread, typically those involving living systems or new protocols, deserve larger buffers than tasks with a narrow spread, such as writing a standard operating procedure.
Step 3: Set dependencies
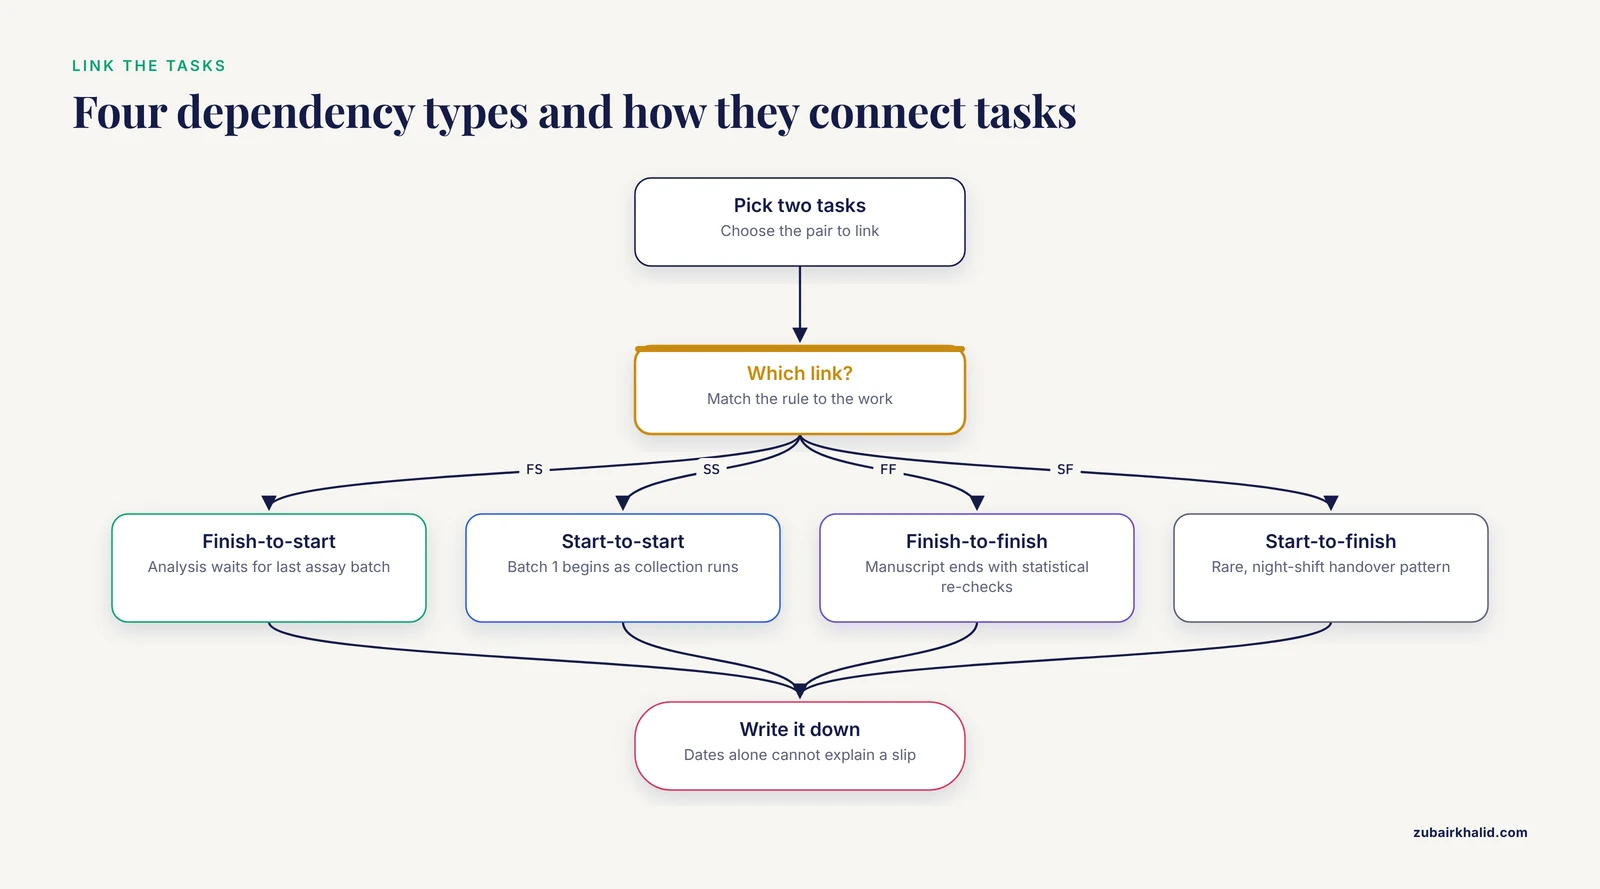
A dependency is a rule linking two tasks. Four types cover almost everything in a lab:
- Finish-to-start (FS). Task B starts when task A ends. Statistical analysis cannot begin before the last assay batch ends.
- Start-to-start (SS). Task B starts when task A starts. Assay batch 1 can begin once main data collection is underway.
- Finish-to-finish (FF). Task B finishes when task A finishes. Manuscript finalization ends when statistical re-checks end.
- Start-to-finish (SF). Rare in research. An example is a night-shift technician handover pattern, which most lab projects can ignore.
Write dependencies down even in a simple chart. A chart with dates but no dependencies cannot tell you why the project is late when something slips.
Step 4: Add milestones and buffers
A milestone is a zero-duration marker for a checkpoint, such as "Protocol approved" or "Dataset frozen." Buffers are deliberate empty stretches you add where the spread from Step 2 is large. A common pattern is a project buffer at the end, sized from the combined spreads of the riskiest chain of tasks, plus smaller local buffers before hard external deadlines such as animal facility shutdown dates or grant reporting dates.
Step 5: Draw the chart
The fastest programmatic route is Python with matplotlib, which most researchers already have through an Anaconda or pip install:
import matplotlib.pyplot as plt

tasks = [
    ("Protocol and animal-use approval", 0,  4),
    ("Equipment calibration",            2,  2),
    ("Pilot experiments",                4,  5),
    ("Main data collection",             9,  12),
    ("Assay batch 1",                    12, 4),
    ("Assay batch 2",                    17, 4),
    ("Statistical analysis",             21, 5),
    ("Manuscript and submission",        25, 7),
]

fig, ax = plt.subplots(figsize=(10, 4.5))
for i, (name, start, length) in enumerate(tasks):
    ax.barh(i, length, left=start, height=0.5)
ax.set_yticks(range(len(tasks)))
ax.set_yticklabels([t for t in tasks])
ax.invert_yaxis()
ax.set_xlabel("Weeks from project start")
ax.set_title("12-month research project schedule")
plt.tight_layout()
plt.savefig("gantt.png", dpi=200)
The expected output is a PNG file named gantt.png containing one horizontal bar per task. The first task, protocol approval, sits at the top starting at week 0 and ending at week 4. Equipment calibration runs from week 2 to week 4, overlapping the approval period. The two assay batches appear as shorter bars nested inside the long data-collection bar, which makes their parallelism visible at a glance. The x axis runs from week 0 to week 32.
To mark a milestone, draw a bar with a length of zero or a thin vertical line at the milestone date. To color bars by owner or resource, pass a color argument per task and add a simple legend.
Step 6: Build the same chart in a spreadsheet
Most teams prefer a spreadsheet because anyone can edit it. Lay out the columns like this:
A: Task
B: Owner
C: Depends on
D: Duration (workdays)
E: Start date
F: Finish date
G: Percent complete
In F2, calculate the finish date from the start and duration:
=WORKDAY(E2, D2-1)WORKDAY returns a date that many workdays after the start date, skipping weekends, so a 10-workday task starting on a Monday finishes on the second Friday of the following week. In G2, calculate progress against the plan:
=MIN(1, NETWORKDAYS(E2, TODAY())/D2)NETWORKDAYS counts working days between two dates, so this formula reports the fraction of the task's planned workdays that have already elapsed, capped at 100 percent. Select the date columns and apply a conditional-formatting bar to turn the sheet into a visual Gantt chart.
Two error messages appear repeatedly in this setup. Excel shows #VALUE! when the start date was entered as text, for example as "March 3rd". Fix it by re-entering the date in a recognized date format or with =DATE(2026, 3, 3). Google Sheets shows Formula parse error when the spreadsheet locale expects a different argument separator than the comma. Fix it in File, Settings by checking the locale, or replace commas in the formula with the separator your locale uses.
The table below collects the formulas and settings that matter most.
| Purpose | Formula or setting | Notes |
|---|---|---|
| Expected task duration | (O + 4M + P) / 6 | O is optimistic, M most likely, P pessimistic time |
| Duration uncertainty | (P - O) / 6 | Use the spread to size buffers |
| Finish date | =WORKDAY(E2, D2-1) | Skips weekends, D2 is workdays |
| Elapsed workdays | =NETWORKDAYS(E2, TODAY()) | Compare against D2 for progress |
| Percent complete | =MIN(1, NETWORKDAYS(E2, TODAY())/D2) | Caps at 100 percent |
| Overlap check | Compare start and finish columns | Overlaps flag shared equipment or personnel |
Step 7: Review and update on a fixed cadence
Decide the review rhythm when you build the chart, not after it drifts. A weekly 15-minute update where each owner changes only the percent-complete column and any new finish dates is usually enough. Update the chart itself, not a copy of it in email.
How to Use Gantt Charts for Lab Project Scheduling
Scheduling inside a working laboratory adds constraints that a generic business template misses. The sections below map chart features onto those constraints.
Shared instruments and consumables are resources, not just tasks
When two bars overlap because both need the same confocal microscope or the same PCR machine, the chart is telling you about resource contention. Treat major instruments as named resources. If your spreadsheet tool supports resource assignment, assign them. If not, add a column naming the key instrument per task and scan overlaps manually every review.
Laboratory information systems grew up around exactly this problem. LabBase was built to manage laboratory workflows with structured tracking of samples and procedures [4]. Modern platforms continue in that direction. openBIS, an electronic lab notebook and laboratory information management system developed at ETH, was adopted by an analytical chemistry laboratory to integrate the data workflow around spectroscopy instruments, with dashboards for data collection and visualization aligned to FAIR data principles [5]. If your lab runs such a platform, your Gantt chart should reference the same sample and experiment identifiers so that a scheduled task links directly to the records it produces.
Schedule the documentation, not just the experiment
A repeated finding in laboratory informatics is that researchers are overburdened by the complexity of experiments and analysis workflows, so metadata collection ends up incomplete or ambiguous, which undermines reproducibility [6]. Put documentation on the chart as its own tasks, for example "Enter batch metadata into ELN" with its own owner and duration. A task that has no scheduled time is the task that never happens.
Computational pipelines run on their own schedulers
A Gantt chart plans work at the human and instrument level. At the machine level, dedicated engines take over. Managing a GATK-based genomic variant calling workflow across hundreds or thousands of samples is handled by workflow systems such as Swift/T, which parallelizes samples within cluster nodes and runs portably across cluster scheduling environments including PBS Torque, SLURM, and Cray aprun [7]. Interactive bioinformatics toolkits such as BioWorkflow schedule parallel tasks with GPU acceleration and distributed computing to raise throughput [8]. At larger scales, frameworks built on Kubernetes with Argo Workflows and Kueue unify CPUs, GPUs, and quantum processors under a single orchestration layer with resource-aware scheduling, and fault-tolerant strategies such as replication-based dynamic provisioning keep scientific workflows running despite task failure [9].
The division of labor is simple. The Gantt chart decides that variant calling for cohort A happens in March and needs the cluster allocation. The workflow engine decides which sample runs on which node at which second. Research on scientific workflow scheduling surveys heuristic, meta-heuristic, and reinforcement-learning methods that minimize makespan and energy use, and in reported experiments a reinforcement-learning scheduler improved both metrics against existing methods [10]. None of that machinery replaces your chart. Your chart is what tells the funding agency, your advisor, and yourself when the pipeline stage must be ready.
Automation shifts scheduling from people to orchestrators
Laboratory automation platforms are moving task scheduling into software. The Experiment Orchestration System (EOS) is an open-source framework in which labs, devices, tasks, and experiments are defined in YAML and Python plugins, and a central orchestrator executes task scheduling, result aggregation, and autonomous experiment campaigns [11]. AI-native autonomous laboratories go further, concurrently serving multiple users and managing instrumentation for complex multi-objective experiments without human intervention. Even in an automated lab, someone schedules the campaigns, orders the reagents, and books the instrument maintenance. That planning layer is exactly what the Gantt chart represents.
Gantt Chart for Research Projects Tips
These tips address the failure modes that show up most often once a chart is in daily use.
- Batch your interruptions and defend focus blocks. A hybrid laboratory and field study of digital notifications found that constant notifications raised perceived workload on the NASA-TLX questionnaire, a standard self-report workload scale, lowered RMSSD, a heart-rate-variability measure reflecting parasympathetic activity, and worsened task accuracy, with larger penalties under dual-task demands. A 14-day intervention bundling batched notifications, a priority allow-list, and two daily 50-minute focus blocks cut notification rates by roughly half and lowered momentary stress ratings by about 6.5 points, with partial recovery after washout [12]. Read your own Gantt chart as a defense tool. If analysis week is scheduled, the chart is your written justification for muting channels and holding the focus block.
- Put milestones where your advisor actually looks. Align milestones with committee meetings, grant reporting dates, and conference abstract deadlines rather than with internal task boundaries nobody else sees.
- Keep two levels of detail. Maintain a detailed chart for yourself and a summary chart of 8 to 12 bars for anyone outside the project. Showing a collaborator 60 rows is a reliable way to make sure they stop reading.
- Record the estimate, then record the reality. Add two columns, planned duration and actual duration. After the project, the difference is the calibration data that makes your next chart honest. Teams that never record actuals keep making the same optimistic error for years.
- Anchor the chart to the data systems. Tie each task to the identifier it will produce in your ELN or LIMS so progress can be verified against records rather than recalled from memory [5].
- Treat approval steps as tasks with owners. Ethics review, biosafety sign-off, and animal-use approval each take calendar time controlled by other people. They belong on the chart with realistic durations, not in a footnote.
Common Mistakes and Limitations
- Tasks at the wrong size. One bar reading "Do experiments" hides every dependency and cannot be tracked. Three hundred rows of pipetting steps bury the structure. Aim for tasks that finish in days to a few weeks and produce a checkable output.
- Dates without dependencies. If every bar simply starts on a typed date, a two-week slip in sample collection changes nothing on the chart and the whole plan quietly becomes fiction. Enter the dependency so downstream bars move when you update.
- The frozen chart. The most common failure in research project management is a chart built for a proposal, submitted, and never opened again. If the chart is not updated at a fixed weekly cadence, it is an artifact of the application, not a schedule.
- Ignoring resource contention. Overlapping bars that all require one instrument or one trained operator are a schedule you cannot execute. Resolve the contention by serializing tasks or by negotiating instrument time before the conflict hits.
- Confusing planning with execution. A Gantt chart is a plan, not a runtime. Workflow engines and orchestration systems execute and reschedule at the task level in ways a static chart cannot [11]. Expect the chart to be an approximation of what the execution layer does.
- No allowance for failure and repetition. Wet-lab and animal work are iterative by nature. Buffers sized from the three-point spread exist for this reason. A schedule with zero slack is a schedule with one planned failure built in.
- No owner per task. A task without a named person is a wish. Assign every bar.
- The honest limitation. A Gantt chart reflects estimates about an uncertain process. It will be wrong. Its value is in being visibly, datedly, and correctably wrong on a schedule you control.
Using a Research Project Plan Template
A research project plan template saves you from redesigning the structure every time. Build one spreadsheet with these headers and reuse it across projects:
Task ID | Task name | Owner | Depends on | Duration (workdays) |
Start date | Finish date | Percent complete | Key resource |
Deliverable | Notes
Fill the dependency column before the dates, because dependencies drive everything else. Keep a milestone row type with zero duration. When a new project starts, duplicate the template, delete the old rows, and keep the header, the formulas, and the conditional formatting intact. Over a few projects, your template becomes a record of how long tasks realistically take in your lab, which is far more valuable than any generic online template because it is calibrated to your own equipment, animals, and personnel.
Frequently Asked Questions
What is a Gantt chart for research projects?
It is a visual schedule that shows each project task as a horizontal bar against a calendar, making sequence, overlaps, and gaps readable at a glance [1].
How detailed should the task list be?
Use tasks that take days to a few weeks and each produce a checkable output, then keep a separate summary view of about 8 to 12 bars for advisors and collaborators.
Which tools can build a Gantt chart for free?
A spreadsheet with conditional formatting, Python with matplotlib, and open-source project management applications all produce charts at no cost, and most labs already have the first two installed.
How do I plan for experiments that fail and need repeating?
Use the three-point estimate, plan for the expected duration, and add buffers proportional to each task's spread so a repeat run consumes buffer instead of the deadline.
Can a Gantt chart track cost and personnel too?
Yes, by adding columns for owner, effort, and budget per task, though the chart's core strength remains timing and overlap rather than accounting.
How do I keep the chart updated without wasting time?
Hold a short weekly update where each task owner changes only percent complete and finish dates, and treat any task whose dates did not move in a month as a signal to investigate.
Do I need a Gantt chart for a small one-person project?
A lightweight version with 8 to 15 bars is still useful because it surfaces dependency and deadline conflicts that a to-do list hides, and it doubles as the timeline section of a future proposal.
How does a Gantt chart relate to computational pipeline schedulers?
The chart plans when each project stage happens and who owns it, while engines such as workflow systems and cluster schedulers execute individual jobs within that stage [7][10].
Sources
- Exploring the Gantt chart as a tool to highlight double report in case series published during the first wave of the COVID-19 pandemic.
- The KRESCENT 2.0 Health Research Training Platform Application Process: Program Report.
- Autonomous Agentic AI for Clinical Workflow Orchestration: Self-Managing Healthcare Operations
- MANAGING LABORATORY WORKFLOW WITH LABBASE
- The openBIS Digital Platform for Instrumentation and Data Workflow in the Analytical Laboratory.
- Handling Metadata in a Neurophysiology Laboratory
- Managing genomic variant calling workflows with Swift/T
- Managing Complex Workflows in Bioinformatics: An Interactive Toolkit With GPU Acceleration
- Replication-Based Dynamic Energy-Aware Resource Provisioning for Scientific Workflows
- Evaluating Scheduling Efficiency for Complex Scientific Workflows in Cloud Infrastructures
- The Experiment Orchestration System (EOS): Comprehensive Foundation for Laboratory Automation
- Managing Digital Notifications and Stress: Evidence from a Hybrid Laboratory and Field Study on Cognitive Load, HRV, and Well-being