How to Measure the Citation Advantage of Data Sharing
By Dr. Zubair Khalid, DVM, MS, PhD ·

The citation advantage of data sharing is the measurable excess of citations that publications receive when they make their data available, compared with similar publications that do not. You measure it by sorting articles into groups based on how they share data, collecting citation counts for each group, and comparing the groups with regression models that adjust for journal, field, and article age.
Data sharing citation advantage metrics turn a vague promise, that open data gets rewarded, into a number you can defend in a promotion case or a grant application. This guide defines the metrics, reviews the study designs behind the published evidence, and walks through the steps of an analysis you can run yourself. The methods come from bibliometrics, the quantitative study of scholarly publications and the citations between them, and they apply in any field where research data sharing is practiced.
Data Sharing Citation Advantage Metrics Explained
Four terms carry the whole analysis. Learn them once and the literature becomes readable.
Research data sharing means making the dataset behind a paper available for others to access and reuse, most often by depositing it in a repository that issues a persistent identifier such as a DOI (digital object identifier). Sharing can also happen through supplementary files attached to the paper or through a data paper, a publication whose primary product is the dataset itself.
A data availability statement (DAS) is the section of a journal article that declares where the underlying data can be found. Statements differ in strength. A statement linking directly to a repository record is the strongest signal. A statement saying data are available from the corresponding author on request is the weakest verifiable claim, because nobody can check it without asking.
A data citation is a formal reference to a dataset in the reference list of a publication, ideally pointing at a persistent identifier. The Data Citation Index (DCI) on the Web of Science harvests formal data citations and provides a single access point to repositories and datasets across many disciplines. Informal data citations also exist, buried in the main text, supplementary files, or acknowledgments, and careful studies look for both kinds.
The citation advantage is the difference in citations between sharing and non-sharing publications after adjustment. It is reported as a difference in mean citations, a ratio, or a regression coefficient, depending on the design.
Every metric in this article belongs to one of two sides. Exposure metrics describe who shared. Outcome metrics describe who got cited.
Exposure metrics: classifying who shared
Three practical signals recur across the literature:
- Repository links in the article text, resolvable to a persistent identifier.
- Supplementary-material links, where the data ride along with the paper.
- Textual sharing statements of any kind, including promises of data on request.
A study of 566,188 journal articles indexed in OpenAlex used exactly these three signals to identify observable sharing practices across six research fields [2]. A larger publisher-level study of 531,889 articles in PLOS and BMC journals went further and labeled every data availability statement into four categories based on its content and the type of availability it described, separating statements with a repository link from statements that promised data on request or pointed to files inside the paper [3].
The deepest methodological lesson comes from meta-research in the medical and health sciences. That literature distinguishes declared availability, meaning the article claims data exist somewhere, from actual availability, meaning a retrieval attempt succeeds [4]. When you measure sharing, you choose which of these two you are counting, and you say so.
Outcome metrics: measuring the reward
- Raw citation counts from a database such as OpenAlex, Web of Science, Scopus, or a field-specific index.
- Field-normalized citation impact, which expresses each paper's citations relative to the average for its field and year.
- Formal data citation counts, harvested from dataset references.
- Data paper metrics, including citations, visits, and downloads [5].
- Citation timing, meaning how quickly citations arrive after publication.
Astrophysics researchers built simple measures on the NASA Astrophysics Data System to compare citations per paper between articles with and without links to data [6]. Data journal studies add usage indicators such as visits and downloads, then combine them with citations to interpret reusability [5].
Why Researchers Measure the Citation Advantage
The measurement exists to solve an incentive problem. In the biomedical sciences, the lack of incentives has been described as the rate-limiting step for data sharing, because evaluation of scientific productivity still leans on publication counts and citation counts [7]. Sharing data costs time and money, and the current reward system does not automatically pay it back.
Several proposed fixes depend on measurement. Coauthorship in exchange for data is common, but it conflicts with authorship guidelines and leaves secondary analysts unable to contest methods they did not run [7]. Data publication, data citation, and altmetrics have been proposed as alternative routes to credit the people who generate data [7]. Archaeologists wrote a standard for citing datasets for exactly this reason, so that researchers making data publicly available receive appropriate credit [8]. A scoping review of incentive mechanisms identified metrics as one of seven major themes in this literature, alongside publisher and journal policies, software solutions, sharing agreements, open science badges, and funder mandates [9].
Measurement also matters at the journal level. A survey of 1,243 journals in the Chinese Science Citation Database, examined in 2021, found that research data policies were weak overall, but that life sciences journals held stronger attitudes toward data sharing than other disciplines, and that journals with higher impact factors and CiteScores were more likely to have data policies at all [10]. If prestigious journals mandate sharing, and mandates change behavior, then any observed citation advantage is entangled with journal prestige. That entanglement is the central statistical problem of the field, and the next sections show how to handle it.
What the Evidence Shows
The published evidence is consistent in direction. Papers that link to data tend to collect more citations than papers that do not, across several designs and fields.
In astrophysics, an analysis of publication records from the NASA Astrophysics Data System found a citation advantage for papers with links to data, which received significantly more citations per paper on average than papers without such links [6]. The same study used INSPEC and Web of Science to ask whether experimental and theoretical papers behave differently, an early example of testing whether the advantage depends on article type.
At publisher scale, the PLOS and BMC study showed how far policy can push the exposure metric. After publisher mandates, data availability statements became close to universal. In 2018, 93.7% of 21,793 PLOS articles and 88.2% of 31,956 BMC articles carried one [3]. Yet statements with a real repository link remained a minority. In 2017 and 2018, 20.8% of PLOS publications and 12.2% of BMC publications had statements containing a link to data in a repository [3]. Regression across the four statement categories found an association between repository-linked data and a citation advantage [3].
Across fields, the OpenAlex study examined how interdisciplinary breadth relates to sharing and citation impact. Breadth was measured as the number of Level-0 disciplinary concepts attached to each article. Observable sharing probability generally declined as breadth increased, and the association was negative but non-linear [2]. The study also applied BERTopic topic modeling in history and digital humanities to probe topic-level variation, a reminder that field and even topic shape who shares.
The table summarizes the five designs you are most likely to encounter or imitate.
| Design | Corpus and source | Sharing signal | Outcome metric | Headline finding |
|---|---|---|---|---|
| Field index comparison [6] | Astrophysics records from the NASA Astrophysics Data System | Links to data within the paper | Citations per paper | Papers linking to data received significantly more citations on average |
| Publisher statement labeling [3] | PLOS and BMC journal articles | Data availability statements in four content categories | Citations, tested by regression | Repository-linked statements were associated with a citation advantage |
| Cross-field repository mining [2] | OpenAlex articles across six research fields | Repository links, supplementary links, textual statements | Citation impact, tested by regression | Sharing probability declined as interdisciplinary breadth increased, non-linearly |
| Data citation audit [1] | Genetics and Heredity publications and datasets | Formal data citations plus implicit citations in full texts | Data citation counts with citer-based analysis | Citer-based profiling separated self-citation from independent reuse |
| Data journal metrics [5] | Two Chinese data journals | Paper, data, and citation indicators, more than thirty in total | Citations, visits, downloads, timing | Combining visits and downloads with citations helped decode reusability |
Two lessons emerge. First, every credible study classifies sharing before it counts anything. Second, every credible study adjusts for something, whether article type, field, or journal.
How to Measure the Citation Advantage of Data Sharing, Step by Step
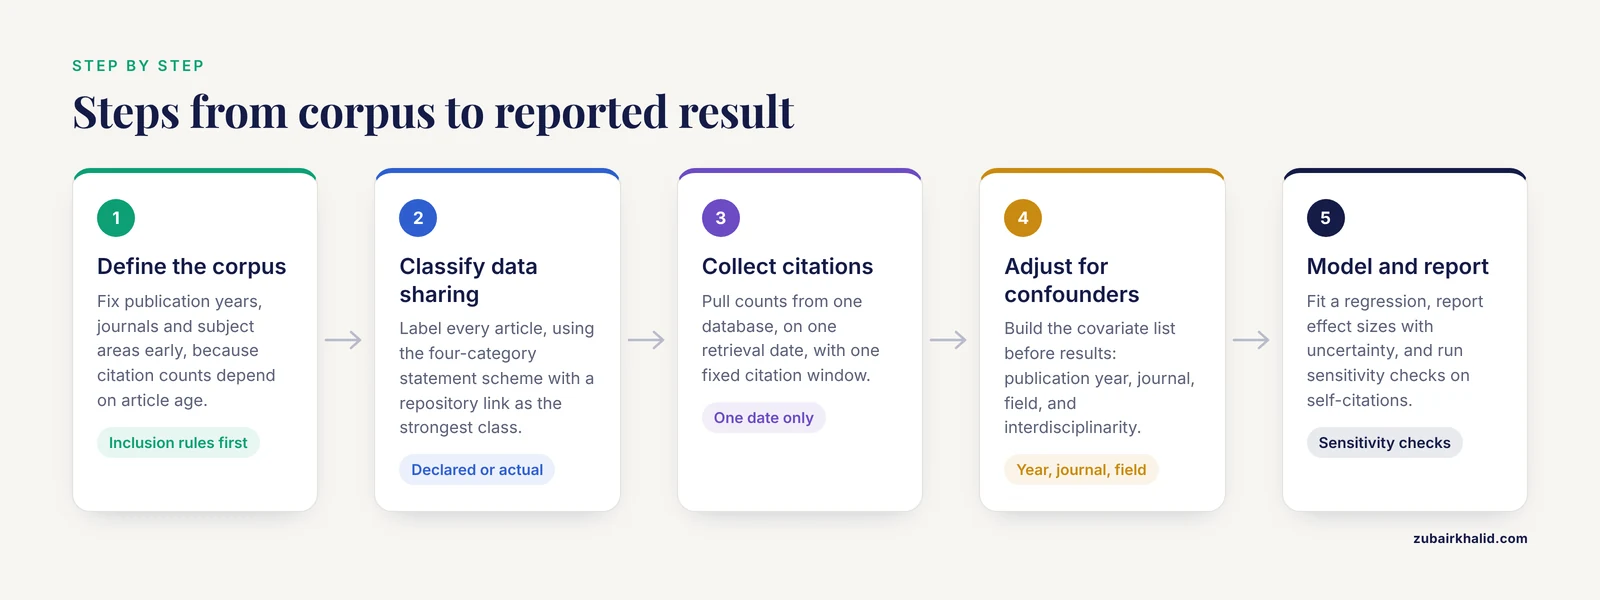
Step 1: Define the corpus
Pick a population of articles with clear inclusion rules. Useful boundaries include publication years, journals, and subject areas. Large corpora make regression stable, as the PLOS and BMC analysis demonstrated, but a single-journal or single-field corpus also works if you state the boundary. Fix the publication window early, because citation counts depend on article age.
Step 2: Classify data sharing for every article
Decide what counts as sharing and label every article. The four-category scheme from the PLOS and BMC study is a workable template, with a repository link as the strongest class [3]. Labeling can be manual for small corpora or automated with text mining for large ones, as that study demonstrated with an automatic labeling system [3]. Record whether you are measuring declared availability or actual availability, and if you choose the latter, attempt retrieval of a sample of the declared datasets [4].
Step 3: Collect the citation outcome
Pull citation counts for every article from one database, on one retrieval date, with one fixed citation window. Mixing databases or dates adds noise. If your question concerns data reuse rather than paper citations, harvest formal data citations from the Data Citation Index and supplement them with a full-text search for implicit citations, the approach used in the Genetics and Heredity case study, which sampled 148 citing articles in depth [1]. Usage metrics such as visits and downloads complement citations, especially where dataset reuse accrues slowly [5].
Step 4: Adjust for confounders
Build the covariate list before you look at results. At minimum, adjust for publication year, journal, and field. The data journal literature adds team size and funding sources to the indicator set, and the OpenAlex study shows why interdisciplinarity belongs on the list, because sharing probability changes with disciplinary breadth [2]. Individual and organizational factors also shape who shares in the first place, and a systematic review of 51 studies mapped these factors across disciplines [11].
Step 5: Model, test, and report
Fit a regression with the sharing category as the exposure and citations as the outcome. Report effect sizes with uncertainty, run sensitivity analyses with different statement classifications and citation windows, and check robustness to self-citations. Citer-based analysis, which profiles the citing articles rather than the cited ones, was developed precisely to remedy self-citation distortion in data citation studies.
A worked example ties the steps together. Suppose you replicate the PLOS and BMC design. You harvest every data availability statement from a defined set of articles, label the statements into four categories, pull citation counts from a single database on a single day, and regress citations on statement category with year, journal, and field as covariates. Your exposure distribution should mirror the published one, where repository links appeared in a minority of statements even under mandate, and your outcome test asks the same question the original regression asked, whether the repository-linked group out-cites the rest [3].
Data Sources and Repository Comparison
Your choice of data source constrains every later step. The main options:
- OpenAlex. Free and comprehensive, and the backbone of the six-field cross-discipline study. It supports all three sharing signals and provides citation counts at scale.
- Web of Science with the Data Citation Index. The DCI covers more than 500 data repositories worldwide and more than two million data studies and datasets, screened for quality through peer review, which makes it the natural home for formal data citation counts.
- Publisher full-text corpora. Open full texts allowed statement-by-statement labeling across the PLOS and BMC corpus [3]. Any publisher with open articles works.
- Field-specific indexes. The NASA Astrophysics Data System gave astrophysics researchers clean publication records with data links [6]. Look for the equivalent in your field.
- Data journals. Journals such as Chinese Science Data and the Journal of Global Change Data and Discovery publish the datasets themselves and can be evaluated with indicator sets spanning papers, data, and citations [5].
On the repository side, compare candidates with three questions. Does the repository issue a persistent identifier that others can cite? Does it attach a license that permits flexible reuse? Does it store data in structured formats that make reuse practical? The archaeology review found that most repository data were licensed to enable flexible reuse, but only a small proportion were stored in structured formats for easy reuse [8]. That gap is exactly what a repository comparison should catch before you deposit.
Confounders That Distort the Measurement
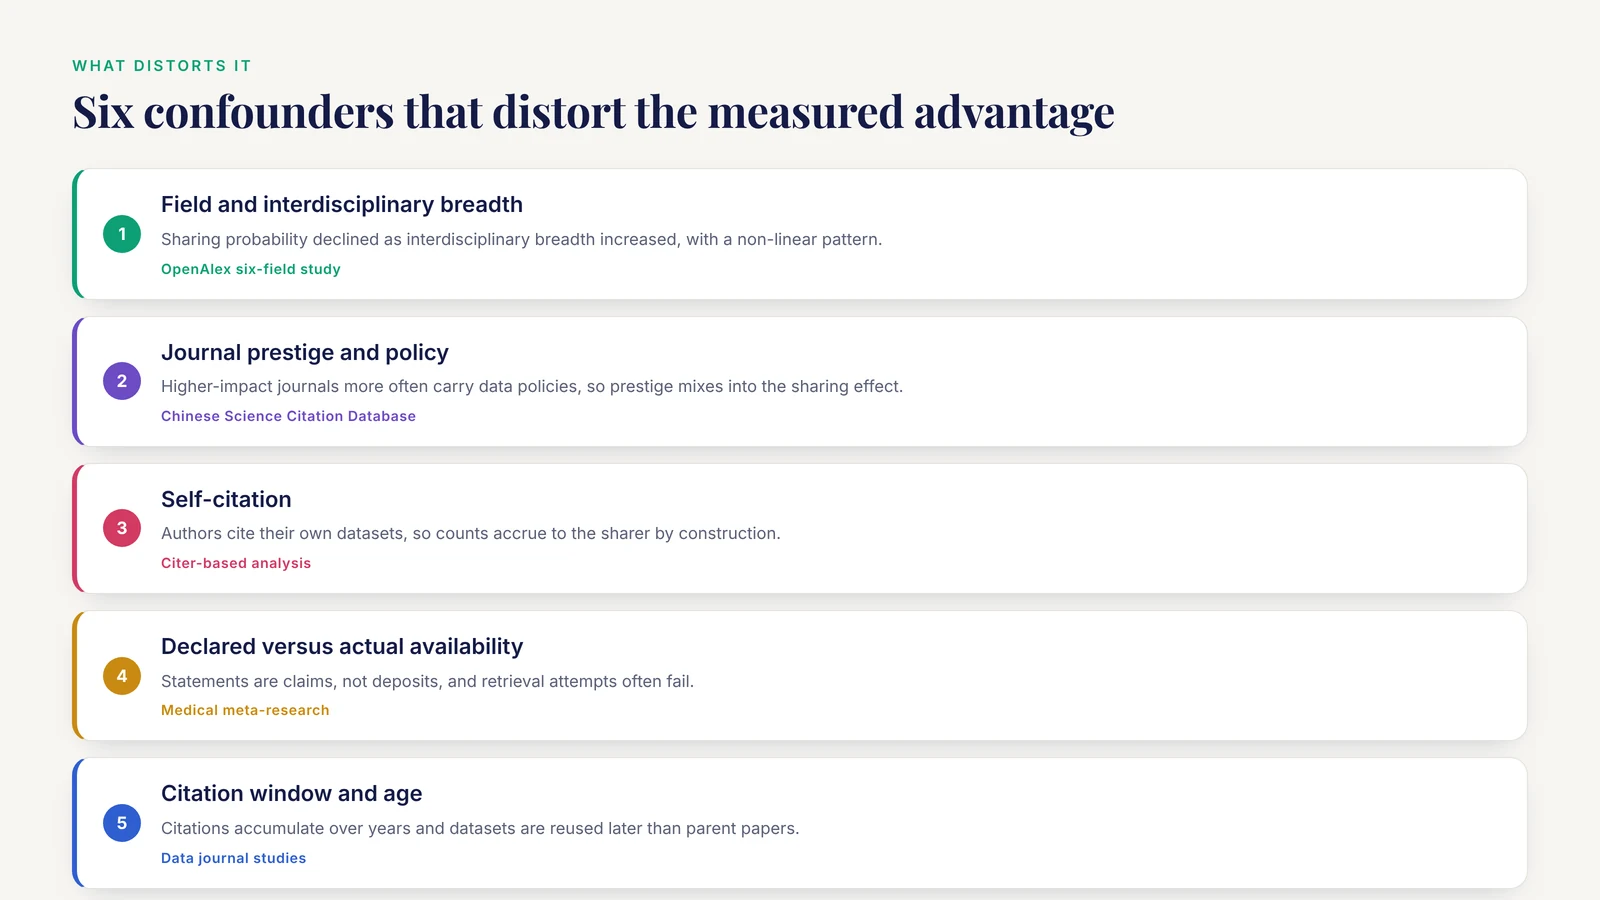
Field and interdisciplinarity. Sharing norms differ by discipline, and observable sharing probability generally declined as interdisciplinary breadth increased in the OpenAlex study, with a non-linear pattern [2]. A raw comparison between a single-field journal and a multidisciplinary journal measures disciplinary culture as much as data behavior.
Journal prestige and policy. Higher-impact journals are more likely to carry data policies [10], and strong policies push statements into articles [3]. If prestigious journals both mandate sharing and attract better papers, the apparent advantage of sharing partly reflects the journal.
Self-citation. Authors cite their own datasets, so data citation counts accrue to the sharer by construction. Citer-based analysis was proposed to remedy this distortion.
Declared versus actual availability. Statements are claims, not deposits. The medical meta-research literature separates declared availability from retrieval-tested actual availability [4], and the clinical trial literature shows the gap can be wide, with willingness to share individual participant data extremely high while actual data-sharing rates remain suboptimal [12].
Citation window and age. Citations accumulate over years, and datasets are often reused later than their parent papers are cited, which is why data journal studies track citation timing alongside counts [5].
Article-level covariates. Team size, funding, and subject shape both the likelihood of sharing and the likelihood of citation. Leave them out and the sharing coefficient absorbs their effects.
Common Mistakes and Limitations
- Counting statements as sharing. A data availability statement is a declaration. Unless you verify links or attempt retrieval, your exposure metric measures policy compliance, not availability [4].
- Comparing raw citations across fields. Citation behavior differs by discipline, so cross-field comparisons need field normalization or field-stratified models.
- Ignoring self-citations. Without a citer-based check, data citation counts conflate independent reuse with the author's own follow-up work.
- Treating association as causation. Regression shows association. Better-resourced teams may both share more and attract citations, and no observational design fully removes that worry.
- Using a short citation window. Two years of citations can invert a pattern that five years would reveal. Fix the window in advance and apply it to every article.
- Assuming policy equals practice. In archaeology, editorial policies lacked enforcement and changed little, while legislation and mandates moved behavior [8]. Measure what happened, not what the policy intended.
- Skipping the pilot. The archaeology project ran three pilot studies, including email requests for data and a review of repository deposits, before settling on metrics [8]. A pilot on 50 articles exposes labeling problems cheaply.
One further limitation applies to any single analysis. Corpus choice, labeling rules, and citation windows all involve judgment calls, and reasonable analysts can disagree. For an individual project, especially one with a small or specialized corpus, get advice from a research data management specialist or an institutional librarian before committing to a design.
What Is Still Uncertain
Causality remains unresolved. Observational studies consistently associate sharing with citations, but association cannot prove that sharing causes the citations. Large-scale experimental evidence does not yet exist in this literature.
The advantage may not be uniform. Whether the citation advantage of sharing holds equally across disciplines is an open question, and the six-field OpenAlex study was designed to probe that variation directly [2]. Topic-level differences within fields add another layer [2].
Metric standardization is incomplete. The data journal case study worked through an indicator set of more than thirty measures spanning paper, data, and citation dimensions, which signals how unsettled the field remains about which indicators matter [5]. Incentive reviews reach a similar conclusion, noting that data citation and altmetrics are not yet well established and that evidence to support their implementation is difficult to acquire [7].
Long-term impact is barely measured. A scoping review of individual participant data sharing from clinical trials included 93 studies from the literature plus 5 from other sources, and found that most were descriptive and focused on the early phases of the data-sharing process, leaving research output and impact comparatively under-studied [12].
Practical Steps for Your Next Paper
- Deposit your data in a repository that issues a DOI, applies a reuse license, and stores files in structured formats [8].
- Write a data availability statement that contains a well-formed repository link. Statements that promise data on request sit in the weakest class of every classification scheme [3].
- Cite your datasets formally in the reference list of every paper that uses them, following a standard data citation format [8]. Formal citations are what the Data Citation Index and similar services can count.
- Consider a data paper if your dataset is the main contribution. Data publishing has become an established route for sharing, supported by funding, quality control, and national data centers.
- Check your target journal's data policy before submission. Policy strength varies with discipline, access model, and publisher, and life sciences journals tend to hold stronger attitudes toward sharing [10].
- Expect the payoff to depend on your field's norms. Sharing behavior and its rewards vary with disciplinary breadth and topic [2].
Frequently Asked Questions
What are data sharing citation advantage metrics?
They are the indicators used to quantify how much extra citation credit publications receive when their underlying data are shared. The core set includes a sharing classification for each article, citation counts for each article, and covariates such as field, journal, and year used to adjust the comparison.
How large is the citation advantage of data sharing?
There is no single number, because the size depends on field, journal, and how sharing is classified. Published studies across astrophysics, medicine, and multidisciplinary corpora consistently find a positive association between sharing and citations, with the strongest effects attached to verifiable repository links rather than statements alone.
Does a data availability statement count as data sharing when you measure it?
Only if you define it that way, and you should say so explicitly. A statement is a declaration, so studies that want to measure actual sharing verify repository links or attempt to retrieve the data, while studies of policy compliance count statements as-is.
Which databases can I use to measure the citation advantage?
OpenAlex works well for large corpora and citation counts, the Web of Science Data Citation Index supports formal data citation counts, publisher full texts allow statement labeling, and field-specific indexes such as the NASA Astrophysics Data System serve single disciplines. Pick one primary source and one retrieval date.
How do I handle self-citations in the analysis?
Run a citer-based analysis, which profiles the citing articles so you can separate independent reuse from the authors' own follow-up work. Report your main result with and without self-citations so readers can see both.
Does the citation advantage differ between scientific fields?
Yes, evidence points to field-level variation, and sharing behavior itself declines as interdisciplinary breadth increases. Normalize within fields or run field-stratified models before comparing a genomics paper with an ecology paper.
How long should I wait before measuring citations on shared data?
Citations accumulate over years, so fix a citation window in advance and apply it identically to every article. Datasets are often reused later than their parent papers are cited, which is why usage metrics such as downloads help in the early years.
Do journal data policies increase data sharing?
Policies increase the prevalence of data availability statements, especially when mandates carry enforcement. Legislation and funder mandates have moved behavior more reliably than voluntary editorial policies, which have often lacked enforcement.
Sources
- An examination of research data sharing and re-use: implications for data citation practice
- Does interdisciplinary breadth shape research data sharing and citation impact? Evidence from six research fields
- The citation advantage of linking publications to research data
- Prevalence and predictors of data and code sharing in the medical and health sciences: systematic review with meta-analysis of individual participant data
- Exploring citation metrics of data papers: case studies based on two Chinese data journals
- The data sharing advantage in astrophysics
- Data Sharing in Biomedical Sciences: A Systematic Review of Incentives
- A Standard for the Scholarly Citation of Archaeological Data as an Incentive to Data Sharing
- Incentivising research data sharing: a scoping review
- Research data policies of journals in the Chinese Science Citation Database based on the language, publisher, discipline, access model and metrics
- Factors influencing open science participation through research data sharing and reuse among researchers: a systematic literature review
- Status, use and impact of sharing individual participant data from clinical trials: a scoping review