Data Citation Metrics vs. Altmetrics
By Dr. Zubair Khalid, DVM, MS, PhD ·

Data citation metrics count how often a publication or dataset is formally cited in the scholarly literature, while altmetrics count the broader online attention a research output receives, including news coverage, social media mentions, downloads, and reader activity. The rule of thumb is simple. Use data citation metrics when you need durable, peer-filtered evidence of scholarly reuse. Use altmetrics when you need fast, broad signals of attention and reach beyond the citation record. Most career decisions, funding reports, and data-sharing assessments benefit from both, because each one captures a type of impact the other misses.
This guide explains what each family of metrics actually counts, how they differ on the criteria that matter in real evaluation decisions, and how to apply them when you share or reuse research data. It also covers the practical side, including how funders, repositories, and journals shape which numbers you can even collect.
What Data Citation Metrics Measure
Data citation metrics are counts of formal citations. When a researcher publishes a paper that uses a dataset, the journal and the data repository expect the dataset itself to appear in the reference list with a persistent identifier, most commonly a DOI (digital object identifier, a permanent web address registered for the dataset). Each of those in-text and reference-list acknowledgments becomes one data citation.
The citation approach grew out of bibliometrics, the established field that measures scholarly output through publication and citation records. Citation analysis rests on a long tradition in which peer-to-peer citation is treated as evidence that a work was seen, used, and judged useful by other researchers [1]. Tools such as Google Scholar, Scopus, and Web of Science compile these records, and automated scripts can retrieve citation data for groups of researchers to support departmental planning and collaboration analysis [2].
Citations have three properties that make them useful for evaluation. They are slow to accumulate, often taking years to reach a stable count. They are filtered by peer review, because a citation usually appears in a published, reviewed work. And they are cumulative, meaning a well-used dataset keeps earning citations for a decade or more.
When the cited object is a dataset rather than a paper, data citation metrics answer a specific question: is anyone building on this data? That question has become central as funders push research data sharing, which is the practice of making the underlying data from a study available for others to access and reuse.
What Altmetrics Measure
Altmetrics, short for alternative metrics, count attention and engagement that happens outside the formal citation record. The umbrella covers a wide range of signals:
- News coverage in mainstream media outlets
- Mentions on social media platforms such as X (formerly Twitter), Facebook, and Reddit
- Blog posts and policy documents that reference the work
- Mendeley and Goodreads reader counts
- Article views and downloads from publisher websites
- Wikipedia citations and patent references
The most widely known aggregate figure is the Altmetric Attention Score (AAS), a weighted composite of these attention sources that also tracks the geographic and temporal pattern of engagement [3]. PlumX, offered by Elsevier, is a second major aggregator that bundles citations, usage, captures, mentions, and social media activity into one dashboard [3].
Altmetrics have two defining properties. They accumulate quickly, often within days of publication, and they capture audiences that never write formal citations, including clinicians, journalists, policymakers, patients, and students. A helicopter emergency medicine analysis of 817 articles published between 1984 and 2025 found a mean Altmetric Attention Score of 11.18 (standard deviation 28.80) against a mean of 17.04 citations in Dimensions, and a strong positive correlation between the AAS and mentions on X (correlation coefficient 0.723), which shows how much of the altmetric signal in that field comes from social media attention [3].
Altmetrics are not limited to papers. Book-focused research integrating citation metrics with library holdings and reader platforms shows that Mendeley and Goodreads track some educational impacts better than formal citation counts do in certain disciplines [4].
Data Citation Metrics vs. Altmetrics: Side-by-Side
| Criterion | Data citation metrics | Altmetrics |
|---|---|---|
| What is counted | Formal citations in peer-reviewed works, including citations to datasets | Online attention: news, social media, downloads, readers, policy mentions |
| Primary sources | Web of Science, Scopus, Google Scholar, data citation indexes | Altmetric, PlumX, repository download logs |
| Speed | Slow, builds over years | Fast, often within days |
| Durability | Cumulative and persistent | Volatile, peaks early and fades |
| Who produces the signal | Peer researchers | Researchers plus journalists, clinicians, policymakers, the public |
| Filtering | Passes through peer review | Little to no quality filtering |
| Best at showing | Scholarly reuse and influence on later research | Reach, timeliness, and public or clinical engagement |
| Weak at showing | Public impact, speed of uptake | Long-term scholarly influence |
| Manipulation risk | Citation rings, self-citation | Coordinated social campaigns, gaming by shares |
| Typical use | Hiring, promotion, grant renewal, dataset evaluation | Funder impact stories, societal impact narratives, early traction checks |
The Difference Between Data Citation Metrics and Altmetrics in Practice
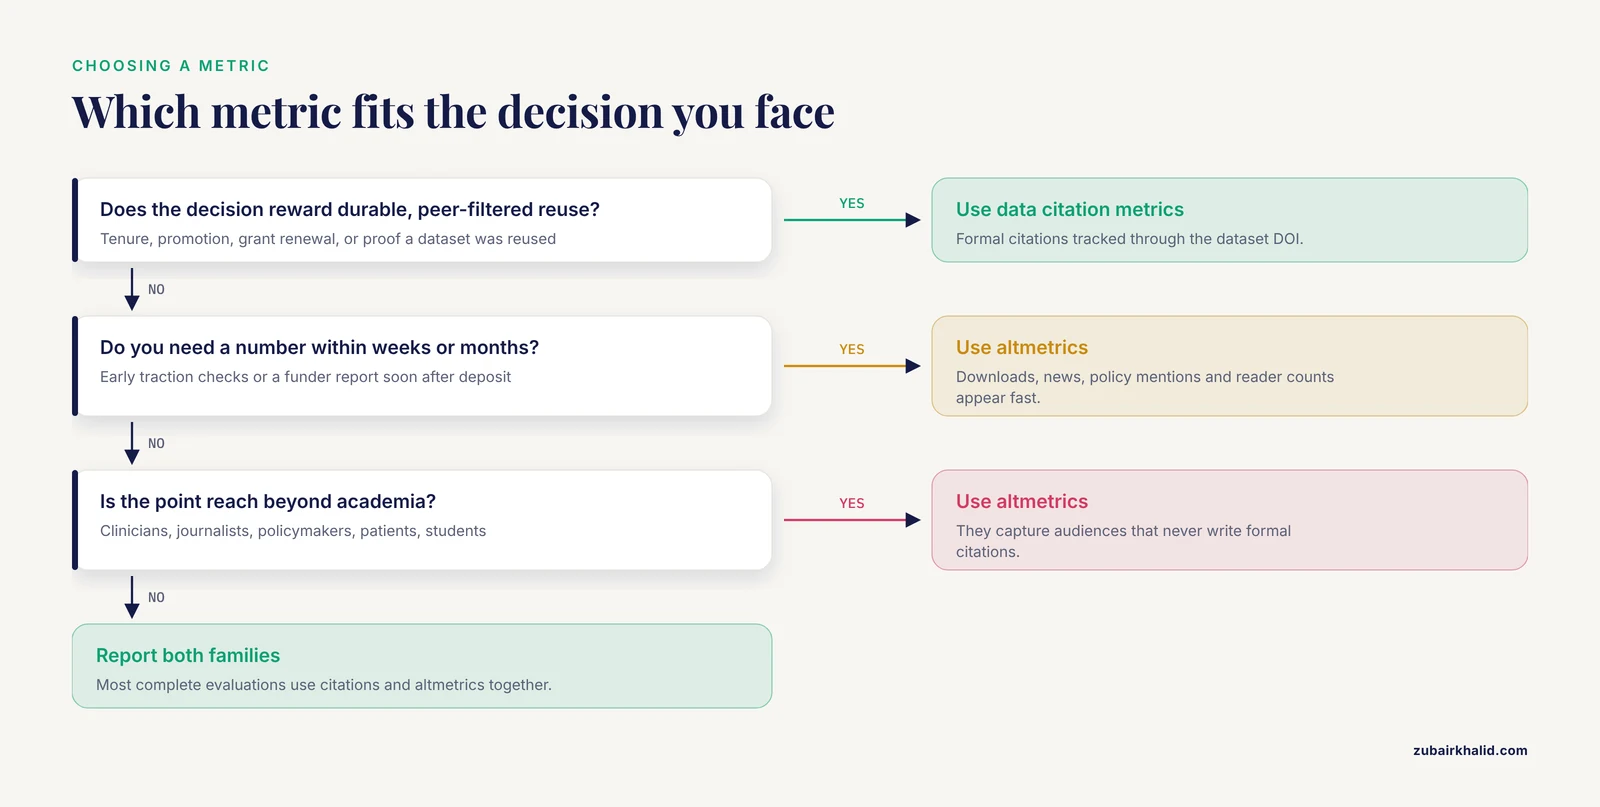
Understanding the difference between data citation metrics and altmetrics comes down to three practical criteria.
Time horizon
Citations mature slowly. A dataset deposited today may accumulate most of its citations three to five years from now, once secondary analyses using the data are designed, run, reviewed, and published. Altmetrics appear almost immediately. For a funder reporting six months after a grant ends, altmetrics may be the only nonzero number available.
Who is talking
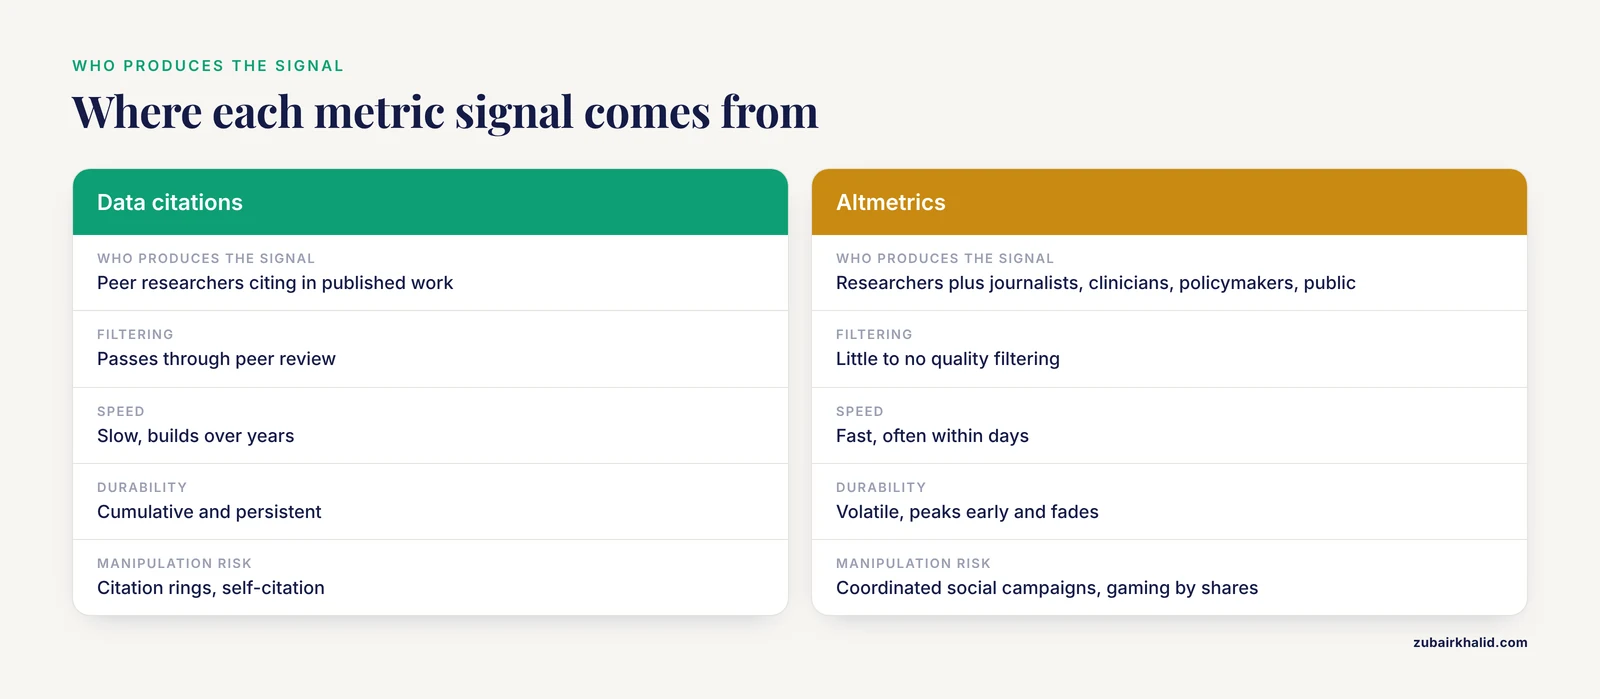
A data citation is a statement from one researcher to other researchers, filtered through peer review. An altmetric event can come from anyone. That breadth is the strength and the weakness of altmetrics. A viral news story signals public interest but says nothing about whether the underlying analysis holds up. A citation from a randomized trial reanalysis says a great deal about scientific reuse but nothing about whether the public ever heard of the work.
What the number certifies
Citation counts certify reuse. Altmetric counts certify attention. Confusing the two leads to the most common evaluation errors, which appear later in this article.
When to Use Data Citation Metrics
Choose data citation metrics when the decision at hand rewards durable, peer-filtered evidence. Five situations fit best.
1. Demonstrating reuse of a shared dataset. If you deposited data and want to show that other scientists build on it, data citations are the direct evidence. The YODA Project, which manages access to clinical trial individual participant data, illustrates the model at scale. Among 336 eligible Johnson & Johnson-sponsored trials with shared participant-level data, 265 trials, or 79 percent, had at least one secondary publication, totaling 1,167 publications, of which 209 (17.9 percent) were authored fully or partly outside the original trial team [5]. Those secondary publications are the reuse events that data citation logic is designed to capture.
2. Evaluation decisions with long horizons. Promotion, tenure, and grant renewal committees weigh multi-year scholarly influence. Citation-based measures remain the reference standard for those decisions, and modern reviews of article impact assessment combine statistical analysis, machine learning, and network science to refine them [1].
3. Comparing outputs across disciplines with citation-based norms. Where normalized citation indicators exist, they allow fairer comparison than raw altmetric scores, which vary enormously by field and by how active a field's community is on social media.
4. Reporting to funders who require evidence of reuse. Many funders now ask grantees to demonstrate that deposited data found users. Formal data citations, tracked through the dataset's DOI, provide a defensible record.
5. Auditing repository value. Citation flows to datasets in a repository tell you whether the repository is serving as a research infrastructure or a storage shelf.
When Altmetrics Add Value
Altmetrics earn their place in four situations.
1. Measuring fast, early attention. If you need to know within weeks whether a paper or dataset is reaching anyone, altmetrics respond immediately. Citation counts simply cannot answer at that speed.
2. Capturing clinical and public engagement. Research with direct practice or public relevance generates attention from people who never publish. The helicopter emergency medicine study found that altmetric indicators captured dissemination patterns, including geographic engagement, that citation counts alone did not reflect [3].
3. Telling impact stories for funders and institutions. Policy mentions, news coverage, and guideline references often matter more to funders than raw citations. Bibliometric and altmetric analyses of emerging fields, such as an assessment of artificial intelligence applications in lymphedema research covering 43 articles from 1975 to 2025, use both families of indicators together to map trends and visibility [6].
4. Evaluating outputs that citations underserve. Books, textbooks, and datasets in the humanities and social sciences accumulate attention through libraries and reader platforms. Research integrating citation metrics, alternative indicators, and library holdings data across more than 119,000 Scopus-indexed book titles found that library print holdings showed stable, cumulative characteristics that aligned with formal citation patterns, while reader platforms such as Mendeley and Goodreads tracked certain educational impacts better in some fields [4].
Research Data Sharing: Why These Metrics Matter Now
Research data sharing has moved from an aspiration to a policy requirement, and that shift is what pushed data citation metrics and altmetrics from niche tools into mainstream evaluation.
In early 2023, the National Institutes of Health implemented its Data Management and Sharing Policy, which requires researchers to share scientific data produced with NIH funding. The policy aims to amplify the benefits of public investment in research by promoting dissemination and reusability of primary data. A review of impact measurement published that year concluded that although numerous author-level metrics exist to gauge the impact of data sharing, their application remains limited, and that non-traditional metrics, including economic measures such as cost savings and intangible benefits, currently hold more potential for evaluating the impact of primary data sharing [7]. The same review distinguished bottom-up strategies, which build measurement from individual outputs, from top-down strategies, which assess impact across programs and portfolios [7].
Regional initiatives show the same pressure. The CaribData project, funded by the Inter-American Development Bank and implemented by The University of the West Indies, aims to strengthen data handling, sharing, and reuse in the Caribbean through an online data platform, a training and mentoring program, a data communication initiative, and data availability audits. Its evaluation plan combines quantitative monitoring of usage metrics with surveys, interviews, and thematic content analysis, framed by two implementation science models [8]. Usage metrics of this kind sit between citation metrics and altmetrics. They count behavior at the repository level rather than either formal citations or social attention.
The practical lesson for any researcher is that the impact evidence you can offer depends on choices made at deposit time. A dataset that carries a persistent identifier, a clear license, and rich metadata can be cited, downloaded, discussed, and tracked. A dataset posted as a zip file on a lab website cannot be measured by any of these systems.
Data Repository Comparison: What to Check Before You Deposit
Because metrics flow through repositories, a data repository comparison should always include the measurement layer. A comparison checklist:
- Persistent identifier. Does the repository assign a DOI or another resolvable persistent identifier to every dataset? Without one, citations to the data cannot be counted reliably.
- Citation support. Does the repository generate a recommended citation line and register metadata with scholarly indexes so that dataset citations appear in Google Scholar, Scopus, or Web of Science records?
- Usage statistics. Does the repository report views and downloads? These numbers are the altmetric layer available to every depositor, and projects such as CaribData build their monitoring on them [8].
- Altmetric integration. Do dataset landing pages display Altmetric or PlumX badges where applicable?
- Access model. Is the data open, controlled, or mediated? Controlled-access platforms such as the YODA Project still generate measurable reuse, as its publication record demonstrates [5], but the citation trail runs through the data access agreement rather than a simple download.
- Curation and metadata standards. Repositories that enforce community metadata standards make datasets easier to find, understand, and cite, which raises both citation and attention outcomes.
- Longevity. A metric collected for two years is worthless if the repository disappears. Check the repository's preservation commitments.
No single repository wins on every line. The right choice depends on your data type, your funder's requirements, and whether your evaluation needs citations, usage counts, or attention signals.
Worked Scenarios
Scenario 1. A postdoc is preparing a tenure-track application. Her dataset on protein structures has been deposited for four years and holds 14 formal citations, most from labs that used the structures in method comparisons. Her department values durable scholarly influence, so the data citation record belongs in her dossier. Her Altmetric Attention Score of 3, driven by a handful of news mentions, is a supporting detail at most. The citation metrics do the persuasive work.
Scenario 2. A public health team reports to a funder one year after depositing surveillance data. Citations to the dataset have not yet appeared, because reuse takes time. The repository shows 2,400 downloads, a policy brief from a regional health agency cites the dataset in its bibliography, and two local news outlets covered the related paper. For a one-year report, the altmetric and usage layer is the honest evidence, and the team should say so plainly rather than stretching the citation record.
Scenario 3. A research office benchmarks a clinical department. An automated workflow pulls citation counts and author-level indicators from Google Scholar for the whole group and exports them for visualization [2]. For the clinical relevance section of the report, the office also pulls Altmetric and PlumX data, since clinician and patient attention shows up there first. The two datasets answer different parts of the same question.
Scenario 4. A data shared from clinical trials is reanalyzed by outside teams. The YODA portfolio experience shows that secondary publications using shared participant-level data frequently achieved scholarly impact measurable through journal impact factor, annual citation counts, and annual Altmetric Attention Scores [5]. Here the correct evaluation tracks both families of metrics on the secondary publications, because each new paper carries its own citation and attention record.
Common Mistakes and Limitations
Treating attention as quality. A high Altmetric Attention Score certifies that many people noticed a work, not that the work is correct. The HEMS analysis found a strong link between attention scores and mentions on X, a platform where engagement reflects interest rather than peer judgment [3]. Peer review remains the filter that citation-based measures carry and altmetrics largely lack.
Assuming attention and citations always agree. Correlation studies find moderate, not perfect, relationships. The lymphedema bibliometric analysis reported a moderate positive correlation between average annual citations and altmetric scores (r = 0.470, p = 0.039) [6]. A moderate correlation means many outputs deviate from the trend in both directions, with some highly cited papers ignored online and some viral papers rarely cited.
Reading altmetric scores at face value without checking their parts. Two papers can carry identical scores with completely different compositions. One may reflect coverage in major news outlets, the other a burst of shares from a single account. Always open the score and look at the detail level before quoting it.
Comparing altmetric scores across fields. Disciplines with large public followings generate far more social attention than specialized fields. Cross-field ranking by raw altmetric scores mostly ranks the size of each field's online audience.
Expecting data citations to appear quickly. The gap between deposit and first citation often spans years, since secondary analyses must be designed, run, reviewed, and published. A dataset with no citations after one year tells you almost nothing.
Overlooking that perception and citation diverge. A survey of chemists asked researchers to identify the most significant articles from a 2003 issue of the Journal of the American Chemical Society. Respondents were markedly worse at predicting the citation counts of established research than those counts were at being predicted by the h-index of the corresponding author, which shows that even expert judgment about significance does not map cleanly onto citation outcomes [9]. No metric, citation-based or alternative, fully substitutes for expert reading.
Forgetting that aggregated metrics hide component differences. Book research found that merging library print and electronic holdings into a single total obscured important differences, with print holdings showing stable cumulative behavior aligned with citations while electronic holdings inflated totals and weakened predictive strength [4]. The same aggregation problem applies to composite altmetric scores and to blended usage statistics.
Ignoring measurement gaps entirely. The data-sharing impact review concluded that existing author-level metrics see limited use and that economic and intangible benefits of data sharing remain hard to quantify with current tools [7]. When no metric fits the benefit you need to show, describe the benefit qualitatively rather than forcing a number.
Frequently Asked Questions
What is the main difference between data citation metrics and altmetrics?
Data citation metrics count formal citations from peer-reviewed publications, which measure scholarly reuse over years. Altmetrics count online attention from news, social media, downloads, and reader platforms, which measures broader reach within days. One certifies reuse by peers, the other certifies attention from everyone.
When should I use data citation metrics instead of altmetrics?
Use data citation metrics for decisions with long horizons and peer-based standards, such as tenure cases, grant renewals, and demonstrations that a shared dataset is being reused. Use altmetrics when speed, public reach, or engagement outside academia is the point. Most complete evaluations use both.
Do altmetric scores predict future citations?
They correlate moderately in the fields studied so far, meaning they overlap but diverge for many individual outputs. A paper can trend online without earning citations, or accumulate strong citations quietly. Treat altmetrics as an early, imperfect signal rather than a prediction of scholarly influence.
Can a dataset have altmetrics?
Yes. Dataset landing pages with persistent identifiers can accumulate views, downloads, Mendeley readers, and Altmetric badges, and repository usage statistics are themselves a form of altmetric evidence. Formal data citations, however, require that reusers cite the dataset DOI in their own publications.
What is the Altmetric Attention Score?
It is a weighted composite number from the Altmetric aggregator that combines attention sources such as news outlets, policy documents, blogs, Wikipedia, and social media platforms into a single score for one research output. Always inspect the underlying sources before interpreting the headline number.
How do I make my dataset easier to cite and track?
Deposit it in a repository that assigns a persistent identifier, provides a recommended citation format, registers metadata with scholarly indexes, and reports usage statistics. Add complete metadata and a clear license, then cite your own dataset in the related paper so the citation trail starts at the source.
Sources
- An Overview on Evaluating and Predicting Scholarly Article Impact
- Scholar Metrics Scraper (SMS): automated retrieval of citation and author data
- Analysis of Helicopter Emergency Medical Services Metrics-Altmetrics Score Perspective: HEMS-MAP.
- A review of beyond citations for books: integrating library holdings and altmetrics in the impact evaluation of scholarly books and textbooks.
- Secondary use and scholarly impact of a portfolio of clinical trials with shared individual participant level data: cross sectional study.
- Emerging trends in artificial intelligence research in lymphedema: An evaluation in light of bibliometric and altmetric data.
- Measuring the Impact of Data Sharing: From Author-Level Metrics to Quantification of Economic and Non-tangible Benefits
- Implementing and evaluating a project to enable and encourage Caribbean data-sharing
- Perception of the importance of chemistry research papers and comparison to citation rates.