Altmetrics for Datasets: What They Measure and How to Use Them
By Dr. Zubair Khalid, DVM, MS, PhD ·

Altmetrics for datasets measure the online attention and reuse a deposited dataset receives, including downloads, views, citations to the dataset itself, social media mentions, news coverage, and policy document references. They complement citation counts, which usually attach to the paper and only appear years later, while dataset altmetrics can begin accumulating within days of a deposit.
If you have deposited data in a repository and seen a widget full of numbers next to it, you may have wondered what those numbers actually mean and whether any of them matter for your career. This article walks through altmetrics for datasets explained in plain terms: where the numbers come from, what each one signals, how to interpret them honestly, and how to use them in grant reports, data management plans, and promotion materials.
What Altmetrics Are and Where Datasets Fit In
The term altmetrics, short for alternative metrics, refers to nontraditional indicators that capture traceable, online research artifacts. A review written for pharmacoepidemiology researchers describes the scope well: altmetrics cover peer-reviewed publications but also software, datasets, blogs, videos, posters, policy documents, presentations, social media posts, and wiki entries [1]. Compared with citation-based measures such as a journal impact factor or an article's citation count, altmetrics take a broader view of research uptake and try to capture the activity and engagement of people beyond the scholars who write citing papers [1].
So what does altmetrics for datasets mean in practice? When you deposit a dataset in a repository, that dataset typically receives a persistent identifier, most commonly a DOI through DataCite. Once the dataset has an identifier, tracking services can observe activity pointed at it. A dataset that gets downloaded frequently, discussed on social media, cited in other papers by its DOI, referenced in a news article, or named in a policy document generates a footprint. Altmetrics aggregate that footprint into individual counts and sometimes into a composite attention score.
The key conceptual shift is that the dataset becomes a first-class research output. Under the traditional model, your data only earned attention indirectly, through the paper describing it. Under the altmetrics model, the dataset itself can accumulate evidence of use, which matters because reusing existing data is one of the main ways modern science accelerates. A cross-sectional study of the Yale University Open Data Access (YODA) Project, which shares individual participant level data (IPD) from Johnson & Johnson sponsored clinical trials, found that among 336 eligible trials, 265 (79%) had at least one secondary publication, producing 1,167 secondary publications in total [2]. Those numbers show concretely why dataset-level impact measures are useful. If 79% of shared trial datasets generated new scholarship, then measuring attention and use at the dataset level captures scientific activity that article-level citations alone would miss [2].
What Altmetrics for Datasets Actually Measure
Different tracking services and repositories surface different indicators, but most dataset altmetrics fall into a few families. The table below summarizes the main categories.
| Metric family | What it counts | What it suggests | Main caveat |
|---|---|---|---|
| Views and downloads | How many times the dataset landing page was viewed or files were downloaded | Practical interest and immediate utility | One user can download repeatedly, and bots inflate counts |
| Citations to the dataset | Papers citing the dataset DOI | Formal scholarly reuse, the strongest signal | Citations lag by years and many reusers never cite the dataset |
| Mentions and captures | Saves in reference managers such as Mendeley, bookmarks, and links from blogs or Wikipedia | Early engagement, often before formal citation | Readers do not always become users |
| Social media attention | Posts on platforms such as X, Facebook, or Reddit | Public and professional visibility | Engagement reflects controversy and novelty as much as quality |
| News coverage | Stories in mainstream media outlets | Reach beyond academia | Journalists favor striking findings over careful ones |
| Policy mentions | References in policy-related documents | Potential societal and regulatory impact | Coverage is sparse, so absence is not evidence of absence |
One large-scale evaluation of a Clinical and Translational Science Award (CTSA) hub illustrates how these families get used together. Evaluators studying the North Carolina Translational and Clinical Science Institute combined bibliometrics, social network analysis, and altmetrics, applying PlumX metrics to identify publications with the highest altmetric scores across the supported portfolio [3]. PlumX organizes indicators into categories such as usage (downloads), captures (saves and readers), mentions (news and blog posts), and citations, which is a useful mental model for reading any dataset metric dashboard [3].
A review of impact evaluation for scholarly books adds an important caution that transfers directly to datasets. That study integrated library holdings data with citation metrics and altmetrics across more than 119,000 Scopus-indexed book titles in 26 disciplines and found that aggregating print and electronic holdings into one total obscured meaningful differences between them [4]. The lesson for datasets is the same. A single composite score can hide the fact that your data are being downloaded by students for coursework, mined by companies, or cited by clinical guideline committees. Those are different kinds of impact, and disaggregated counts preserve the distinction [4].
How Altmetrics for Datasets Are Collected
Tracking services gather dataset attention from several sources. Understanding the plumbing helps you interpret the numbers.
Repository logs. The repository itself records views and downloads of dataset pages and files. These are the fastest-moving indicators and often appear within days of a deposit.
DOI resolution and citation indexes. When a paper cites a dataset DOI, services that index scholarly references can register that citation. DataCite, the registry that mints DOIs for many repositories, supports citation tracking for its records. Citations accumulate slowly because publication cycles take months to years.
Reference managers. When someone saves a dataset record in Mendeley or a similar tool, that save becomes countable. A propensity score matched study of PLOS journals used Mendeley readers as an academic attention indicator alongside citations and the Altmetric Attention Score, and found that cover papers showed significantly higher values on all three [5]. Reader counts tend to appear earlier than citations, which makes them a reasonable early signal of scholarly interest [5].
The web at large. Companies such as Altmetric track links to research outputs across news sites, policy documents, blogs, Wikipedia, and social media platforms. For the Altmetric Attention Score specifically, different sources carry different weights, with news and policy sources generally counting more than a single social media post.
Policy documents. Policy mentions deserve special attention because they are a distinct form of societal impact evidence. A Scientometrics study of climate change research found that only 1.2% of 191,276 publications on the topic had at least one policy mention, with papers in Nature and Science and in fields such as earth and environmental sciences overrepresented [6]. The authors treated this as a promising but limited data source, useful for targeted impact measurement rather than routine scoring [6]. For datasets that inform guidelines, regulations, or government reports, a policy mention may be the single most persuasive altmetric available, precisely because it is rare. A meta-research protocol for evaluating the GRIPP2 patient and public involvement reporting guidelines plans to combine citation counts with alternative metrics, including mentions in policy documents, to assess uptake across authors, institutions, journals, and countries [7]. That design shows how dataset-adjacent outputs get evaluated when the goal is real-world adoption rather than academic recognition.
Altmetrics for Datasets Interpretation: Reading the Numbers
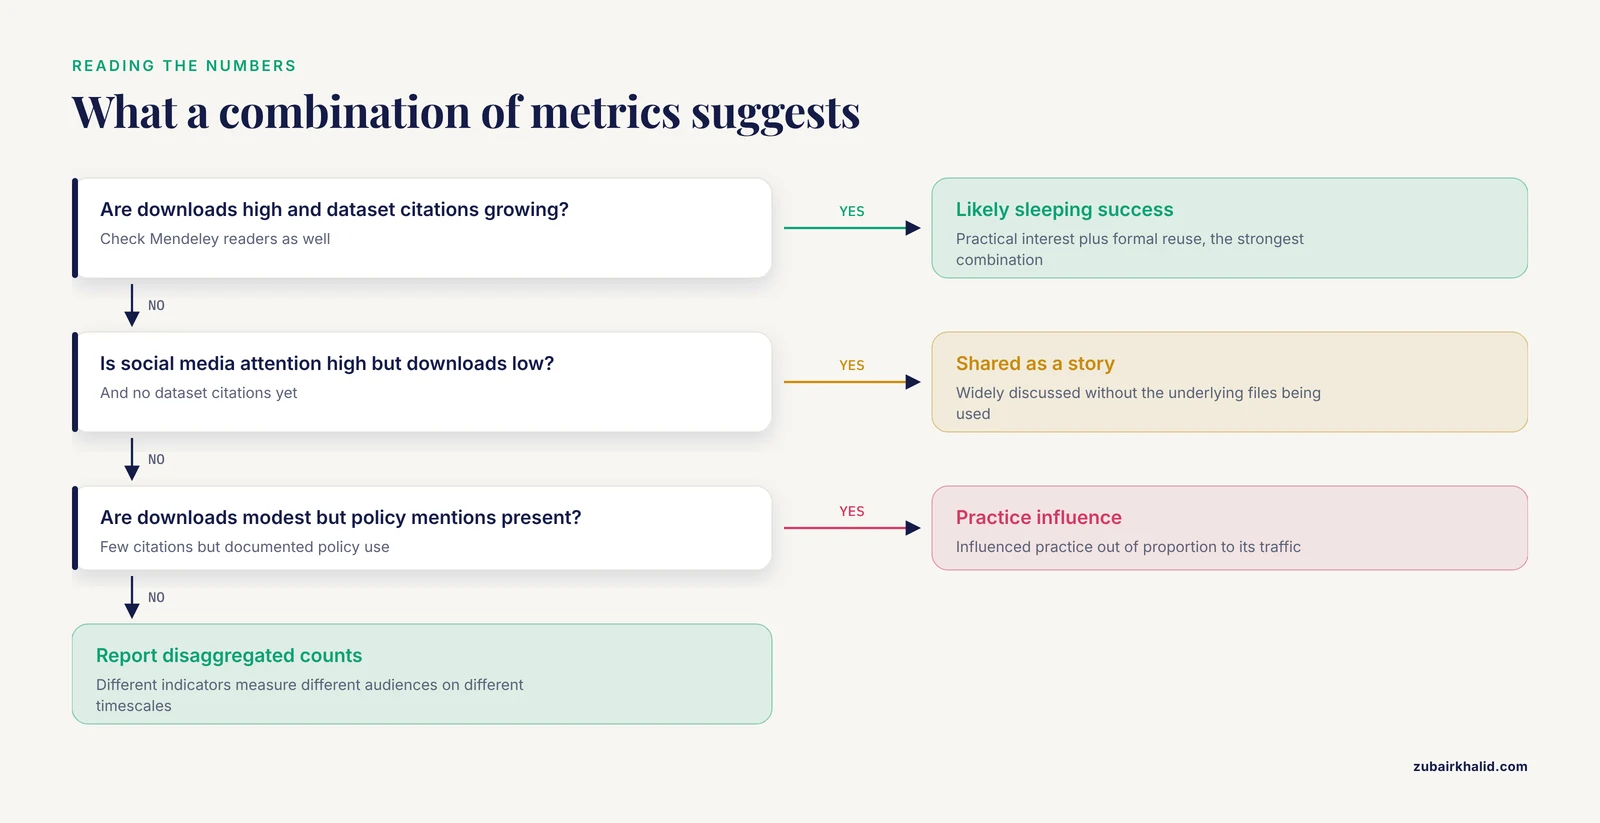
Altmetrics for datasets interpretation starts with one principle: different indicators measure different audiences on different timescales, and no single number summarizes impact.
Downloads measure traffic, not use. A dataset downloaded 500 times might be downloaded by 500 researchers planning analyses, or by a handful of scripts running automated checks, or by students in a course. Downloads answer "did anyone take this" but not "did anyone do anything with it."
Dataset citations measure formal reuse. When another paper cites your dataset DOI, that is a verifiable act of scholarly reuse and the closest thing datasets have to a gold-standard metric. The YODA study used Web of Science citation searches of primary publications to identify secondary publications, and distinguished internal publications authored by original trial investigators from external ones, with 209 (17.9%) of the 1,167 secondary publications being external [2]. External reuse is the signal data sharing advocates care most about, because it demonstrates that the dataset enabled science its original authors never planned [2].
Attention scores measure conversation. The Altmetric Attention Score aggregates weighted mentions across sources. In the chronic traumatic encephalopathy (CTE) literature, researchers compared the 100 most-cited articles with the 100 highest Altmetric Attention Score articles among 788 publications and found 44 articles that appeared on both lists, with a significant positive correlation between the two measures [8]. Yet the keyword analysis showed that scientists focused on causes and disease characteristics while the public engaged more with detection and prevention, confirming that the two metrics track overlapping but distinct audiences [8]. For datasets, the analogous point is that a viral dataset announcement and a heavily cited dataset are often not the same dataset.
Mendeley readers measure academic early interest. Reader counts usually accumulate before citations, so they help when a dataset is new [5].
Mentions measure breadth. News, blog, and wiki mentions indicate that the dataset reached audiences who rarely write citing papers, including journalists, clinicians, educators, and patients.
A useful habit is to read the indicators in combination rather than in isolation. A dataset with high downloads, growing Mendeley readers, and a few early dataset citations looks like a sleeping success. A dataset with high social media attention but no downloads and no citations may have been shared widely as a story without the underlying files being used. A dataset with modest downloads but several policy mentions may have influenced practice out of proportion to its traffic.
Evidence From Recent Evaluations
Three studies in particular show how dataset and altmetric measures behave in real evaluation settings.
The CTSA evaluation mentioned above tracked 1,154 supported publications that generated more than 53,560 citations by April 2021, with average citations per year improving from 33 in 2017 to 48 in 2021 and the mean relative citation ratio rising from 2.26 to 2.58 [3]. The evaluators did not rely on citations alone. They used PlumX altmetrics to flag the highest-attention outputs, SciVal topic prominence to contextualize the work, and correlation analysis to understand how the metrics related to each other [3]. That multi-metric design is the realistic template for anyone evaluating a data-heavy research program.
The YODA study offers the clearest data on what shared clinical datasets actually produce. Beyond the secondary publication counts, the study examined timing, research objectives, analysis type, and scholarly impact, using journal impact factor, annual citation count, and annual Altmetric Attention Score as its impact metrics [2]. Most external publications with a reported data access mechanism obtained access through data sharing platforms, with 161 of 190 such publications (85%) using platforms, primarily the YODA Project itself [2]. In other words, formal platforms with tracked, governed access generated measurable downstream scholarship, and the altmetric measures were among the tools used to document it [2].
The book evaluation contributes a methodological warning. Library print holdings correlated statistically with formal citation patterns and showed stable, cumulative behavior, while electronic holdings showed uneven acquisition and inflated volumes that weakened the combined measure [4]. Dataset analytics carry the same risk. Some repository download counters include crawler traffic, and some attention trackers pick up bot activity. Whenever possible, look at trend lines and source breakdowns rather than raw totals.
Research Data Sharing: Why Deposits Earn Attention
Dataset altmetrics only exist because researchers share data, so it helps to understand what drives sharing success and what complicates it.
Sharing works. The YODA figures demonstrate that a well-run platform for sharing individual participant level data produces a steady stream of secondary research, including from external investigators who never touched the original trial [2]. If you deposit data with good documentation and a clear access pathway, reuse is realistic, not hypothetical.
Preparation quality shapes downstream value. A methodological study of anonymization examined how k-anonymity at k=5, 10, and 15 affected two core clinical data elements, primary ICD-10 diagnosis codes and hospital length of stay, across 719,387 inpatient encounters [9]. The study found that anonymization, which combined record suppression and microaggregation, introduced distributional and inferential distortions that the anonymization tool itself did not flag [9]. For anyone sharing health data, the takeaway is sobering. A dataset can earn strong altmetrics while quietly degrading the analyses performed on it, so documenting the privacy transformations applied to the data is part of responsible sharing [9].
Privacy protections involve tradeoffs. Recent NIH Data Management and Sharing policy updates have increased attention to facial anonymization and controlled-access handling of shared head imaging data [10]. A systematic evaluation of three defacing algorithms across MRI and CT datasets from 600 subjects and three institutions found that privacy-preserving defacing can distort craniofacial geometry and alter image statistics in ways that affect downstream AI model performance, framing a real privacy-utility tradeoff [10]. If you deposit imaging data, the choice between open and controlled access, and between defacing and replacement methods, affects both the privacy posture of your deposit and its analytical value [10].
Trust shapes participation. A viewpoint on race, ethnicity, and AI-mediated health engagement argues that privacy experiences, data donation behavior, and digital disenfranchisement shape willingness to share health data with researchers, and proposes evaluation metrics covering trust, consent behavior, and participation alongside fairness metrics for AI systems [11]. For dataset curators, this means that who sees your repository, and whether communities trust its governance, influences both deposit decisions and the diversity of the data that gets shared in the first place [11].
Federation is an alternative when data cannot move. In settings where privacy rules prohibit centralizing clinical data, federated approaches can deliver much of the value of sharing without moving patient records. One framework for fine-tuning single-cell foundation models across decentralized clinical repositories reached performance within 4% of centralized baselines and recovered 99% of centralized accuracy on cell type classification within two communication rounds [12]. Altmetrics will not track that kind of activity the way they track a public deposit, but it counts as real data reuse and belongs in impact narratives.
Commercial data needs governance. Analyses of supermarket transaction and loyalty card data for nutrition research note that commercial sensitivity requires secure data environments, transparent processes, and strong academic-industry partnerships before such datasets can support research at scale [13]. Data shared under those arrangements may generate few public altmetrics precisely because access is gated, which is worth remembering when comparing datasets that differ in openness [13].
Data Repository Comparison: Choosing Where to Deposit
No single metric ranking tells you which repository is best, because repositories differ in what they count and display. A practical data repository comparison for altmetric purposes looks at four features.
- Persistent identifiers. Does the repository mint a DOI or equivalent identifier for each dataset? Without one, most tracking services cannot attach attention to your deposit at all.
- Visible metrics. Does the repository display its own download and view statistics, and does it integrate an external altmetric badge? Repositories with native usage statistics give you faster feedback than those relying only on third-party trackers.
- Discoverability. Is the repository harvested by major indexing services so that your dataset appears in searches? Discoverability drives the downloads that drive everything else.
- Access model and governance. Does the repository support open, mediated, or controlled access? The YODA experience shows that even gated platforms can generate substantial secondary research when the access process is clear and documented [2]. Imaging repositories operating under NIH data security requirements may apply defacing or controlled-access practices that alter what downstream users can do with the files [10].
Domain-specific repositories generally beat general-purpose ones for discoverability within a field, while general repositories offer broader reach. Generalist repositories are usually a reasonable fallback when no domain repository accepts your data type. Whatever you choose, deposit before the associated paper appears, link the dataset DOI to the paper, and describe the data thoroughly, because metadata quality is the strongest lever you control over both downloads and citations.
Using Dataset Altmetrics in Grants, CVs, and Reports
Altmetrics earned their place in evaluation by being usable, and datasets now appear in the same workflows as papers.
In progress reports and grant renewals. Report the dataset DOI, cumulative downloads, dataset citations, and any notable mentions. The CTSA evaluation demonstrates the pattern funders respond to: a portfolio-level narrative that combines citation growth with altmetric highlights and topical prominence [3]. Bring one or two concrete reuse stories, such as an external secondary publication, which the YODA data show is the outcome reviewers find most convincing [2].
In CVs and promotion dossiers. List datasets as separate outputs with their identifiers and altmetric summaries. Because altmetrics capture outputs beyond publications, including datasets and software, they let you document impact for work that traditional citation metrics undercount [1].
In data management and sharing plans. NIH policy now expects investigators to plan for sharing and to describe where data will be deposited [10]. Naming a repository with visible usage metrics, and committing to report those metrics, gives funders a way to see the return on their investment in sharing.
In guideline and policy work. If your dataset informed a guideline, a policy document mention is high-value evidence. Given how rare policy mentions are even for heavily studied topics, a single documented mention in this domain carries weight [6]. Structured evaluations of reporting guidelines increasingly include policy mentions and news coverage alongside citations for exactly this reason [7].
Common Mistakes and Limitations
- Treating downloads as impact. Downloads count retrieval, not analysis. Pair them with dataset citations or documented reuse before claiming scientific impact.
- Comparing scores across platforms or fields. A composite attention score is not calibrated across disciplines. The CTE analysis found attention and citations correlated positively but tracked different audience interests, so cross-field comparisons mislead [8].
- Reading a composite score as a quality score. Social media attention responds to controversy, novelty, and timing. An evaluation of 329 health information videos across three Chinese platforms found consistent quality differences between platforms even while engagement metrics rewarded all of them, a reminder that attention and quality are separable [14].
- Ignoring aggregation effects. Combining unlike indicators into one number, as book evaluation research showed with library holdings, can hide the differences that matter [4]. Request or report disaggregated counts when you can.
- Expecting policy mentions. Even in a heavily policy-relevant field like climate change, only 1.2% of publications earned policy mentions [6]. Absence of policy mentions is not evidence that a dataset went unused.
- Assuming altmetrics replace citations. Altmetrics are complementary. Citations remain the primary measure of formal scholarly influence, and altmetrics add speed and breadth [1]. Reviews of altmetric practice in health research frame them as an additional lens, not a substitute [1].
- Overlooking the cost of sharing done poorly. Anonymized data that distort diagnosis-specific patterns [9], or defaced images that degrade model performance [10], can spread problems along with value. Prepare and document data before deposit rather than after.
- Forgetting that attention needs infrastructure. Visibility is not automatic. Cover papers in PLOS journals showed higher attention partly because featured placement drives it [5]. If you want your dataset noticed, announce it, present it, and link it from the paper.
What remains uncertain is how funders and promotion committees will weigh dataset altmetrics over time. Standards are still settling, and few institutions have published formal guidance for dataset-level indicators. The safest strategy is to report a balanced set of measures with honest descriptions of what each one counts.
Frequently Asked Questions
What does altmetrics for datasets mean?
It means the nontraditional, online indicators of attention and reuse that attach to a deposited dataset rather than to a paper, including downloads, dataset DOI citations, social media mentions, news coverage, and policy references.
Are dataset altmetrics a substitute for citations?
No. Citations measure formal scholarly influence and remain the primary academic measure, while altmetrics add faster and broader signals about engagement from scholars, the public, and policymakers [1].
How quickly do altmetrics appear after I deposit a dataset?
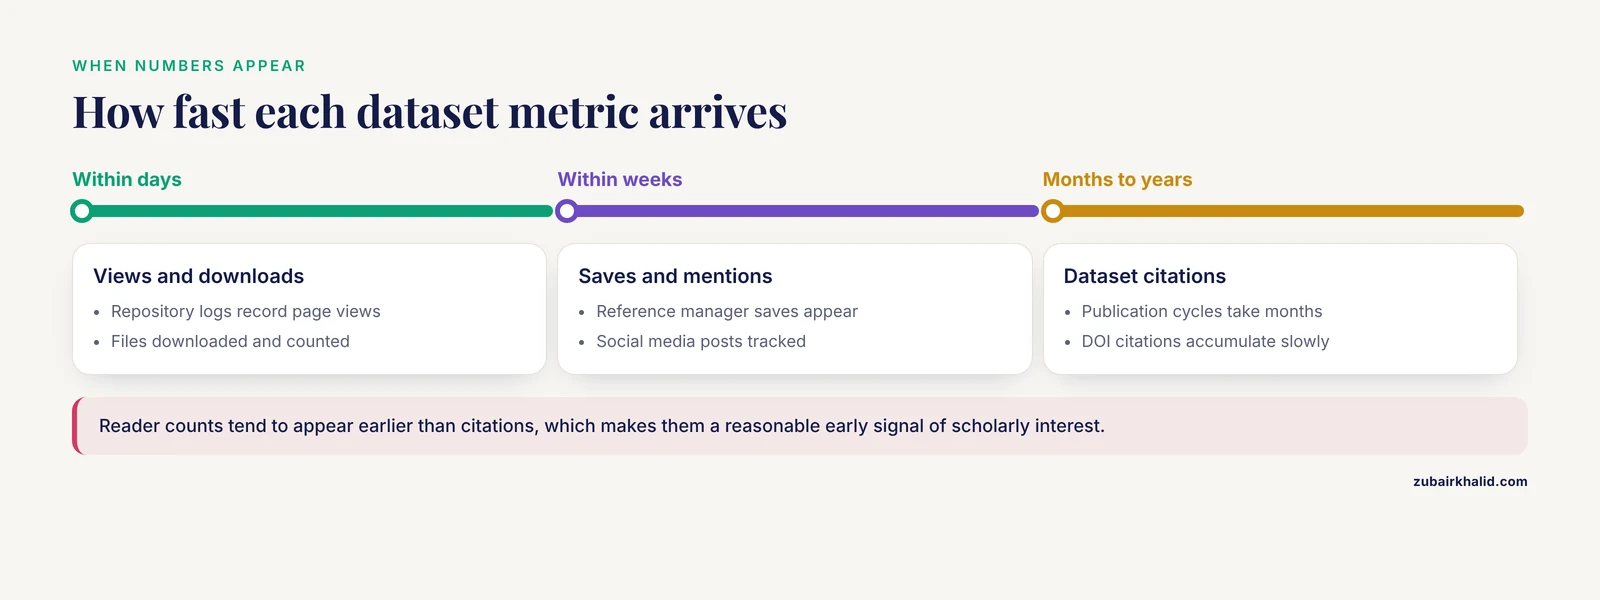
Downloads and views can appear within days, reference manager saves and social mentions within weeks, and dataset citations typically require months to years because of publication lags [5].
What is a good download count for a dataset?
There is no universal benchmark, because expectations differ by field, data type, and repository. Compare your dataset against similar deposits in the same repository and read the trend over time rather than the absolute total.
Do social media mentions indicate that a dataset is good?
No. Social attention reflects visibility and interest, which are influenced by controversy and promotion, and studies show that public attention and scholarly quality metrics track partly different things [14] [8].
Which data repository should I choose for my dataset?
Pick a repository that mints persistent identifiers, displays usage statistics, is harvested by major indexes, and fits your field, and weigh open versus controlled access in light of privacy requirements [2] [10].
Can I put dataset altmetrics on my CV?
Yes. List the dataset with its DOI and a concise metric summary, such as cumulative downloads, dataset citations, and any notable mentions, just as you would report article-level impact.
Do controlled-access datasets get altmetrics too?
They generate fewer public altmetrics because traffic is gated, but they can still produce citations, secondary publications, and documented reuse, and well-governed platforms have generated substantial external secondary research [2].
Sources
- Measuring the impact of pharmacoepidemiologic research using altmetrics: A case study of a CNODES drug-safety article.
- Secondary use and scholarly impact of a portfolio of clinical trials with shared individual participant level data: cross sectional study.
- Evaluating the impact of a CTSA program from 2008 to 2021 through bibliometrics, social network analysis, and altmetrics.
- A review of beyond citations for books: integrating library holdings and altmetrics in the impact evaluation of scholarly books and textbooks.
- Study on the impact and attention of cover papers for PLOS journals: Evidence from propensity score matching.
- Policy documents as sources for measuring societal impact: how often is climate change research mentioned in policy-related documents?
- Assessing the impact, uptake and use of reporting guidelines for patient and public involvement in research: GRIPP2 - study protocol for a meta-research project.
- The bibliometric and altmetric analysis of chronic traumatic encephalopathy research: how great is the impact?
- Quantifying the Impact of Anonymization-Induced Clinical Data Quality Loss: Methodological Quantitative Case Study Using Primary Diagnosis Codes and Hospital Length of Stay.
- Balancing privacy and performance: the impact of facial defacing on AI in medical imaging.
- Understanding Race as a Key Analytic Dimension in AI-Enabled, Health-Related Social Engagement Online and Its Role and Impact in Health Research.
- Clifti-GPT: privacy-preserving federated fine-tuning and transferable inference of foundation models on clinical single-cell data.
- Conflict or interest? Using consumer purchase data to support food systems transformation.
- Evaluating pulpitis-related content on Chinese social media: platform comparison, dental practitioner impact and associated factors.