How to Use a Metabolic Weight Calculator for Animal Research
By Dr. Zubair Khalid, DVM, MS, PhD ·

By the end of this article you will be able to calculate the metabolic weight of any animal from its body weight, convert that number into a dose or an energy requirement, run the same calculation across a whole study cohort in Python or a spreadsheet, and recognize the errors that most often corrupt metabolic scaling results. You need a calculator or a spreadsheet, an accurate body weight in kilograms, and, if you want to automate the workflow, Python 3 installed on your computer.
What Metabolic Weight Means
Metabolic weight, sometimes called metabolic body size or metabolic body weight, is body weight raised to the power of 0.75. The formula is:
Metabolic weight (MW) = body weight (kg) ^ 0.75The result carries the unit kg^0.75, which looks strange the first time you see it but simply records that the number came from a three-quarters power transformation.
The 0.75 exponent comes from Kleiber's law, a textbook relationship in comparative physiology showing that basal metabolic rate in mammals and birds scales with body mass to approximately the three-quarters power rather than linearly. A 600 kg horse does not burn food 600 times faster than a 30 g mouse. It burns it roughly 128 times faster, because 600^0.75 divided by 0.03^0.75 is about 128. Metabolic processes such as oxygen consumption, heat production, and daily energy turnover therefore track kg^0.75, not kg.
This distinction matters for animal research because many experimental quantities scale with metabolism rather than with raw mass. Daily food intake, clearance of many compounds, and energy-dense nutrient targets all follow metabolic weight more closely than raw body weight. A recent veterinary nutrition analysis made this point directly. The authors compared therapeutic dog diets in which omega-3 fatty acid targets were expressed per kilogram of body weight against targets expressed per kilogram of metabolic weight. When food intake was modeled across dogs weighing 1 to 80 kg, the intake-to-recommended ratio for a cardiac target of 40 mg/kg EPA plus 25 mg/kg DHA fell steadily as body weight rose, and diets only met the target for dogs up to 2.5, 5.3, or 22.7 kg depending on the diet, with one diet failing at every weight. In contrast, when the target was expressed as 140 mg per kg^0.75 of combined EPA and DHA for chronic kidney disease, the ratio stayed constant across the entire 1 to 80 kg range [1]. That single comparison is the clearest practical argument for using metabolic weight in any protocol where intake scales with metabolism.
Why Animal Researchers Use a Metabolic Weight Calculator
Three situations in animal research call for a metabolic weight calculation.
Per-animal dosing within a species. Most experimental compounds in rodent work are still administered in mg per kg of body weight. For a drug whose clearance tracks metabolism, expressing the dose per kg^0.75 can reduce over-dosing in large animals and under-dosing in small ones within the same cohort. Even when a protocol stays in mg/kg, the metabolic weight calculation tells you how much the effective exposure per unit of metabolic tissue differs between your lightest and heaviest animal.
Cross-species translation. When you move a dose from mice to rats, gerbils, dogs, or humans, total dose scales with metabolic weight. The allometric scaling factor between two species is (body weight of species B divided by body weight of species A) raised to 0.75. Applying that factor converts a total milligram dose from one species to the metabolically equivalent total dose in another.
Nutrition and energy planning. Maintenance energy requirements in veterinary and laboratory animal nutrition are computed from metabolic weight, most commonly as 70 multiplied by kg^0.75, expressed in kcal per day. This is the standard relationship used in feed formulation and in the therapeutic diet modeling cited above [1].
The study designs behind these calculations show up constantly in the metabolic literature. A rat study of antiretroviral regimens worked with male Sprague Dawley rats of 150 to 180 g, allocated them into prediabetic and nonprediabetic groups, and tracked fasting glucose, insulin resistance, triglycerides, and weight gain over 20 weeks of a high-fat, high-carbohydrate diet followed by 12 weeks of treatment [2]. A mouse nutrition study administered a tea polysaccharide preparation at 600 mg per kg per day for 6 weeks to high-fat diet-induced obese mice and measured glucose tolerance, insulin responsiveness, dyslipidemia, and liver histopathology [3]. A gerbil study dosed obese diabetic Mongolian gerbils with metformin at 100 mg/kg/day by oral gavage for 5 weeks and then profiled liver, skeletal muscle, and adipose tissue by transcriptomics and proteomics [4]. Every one of those dose expressions depends on an accurate body weight measurement, which is the input your metabolic weight calculator consumes.
Step-by-Step: Using a Metabolic Weight Calculator
This walkthrough computes metabolic weight and a metabolically scaled dose for a 25 kg dog, then repeats the logic for a 175 g rat.
Step 1: Record an accurate body weight
Weigh the animal at the same time of day under consistent conditions, ideally after a defined fast if your protocol allows it. Convert to kilograms before any calculation. A rat of 175 g is 0.175 kg, not 175. Unit confusion at this step is the single most common way metabolic calculations go wrong downstream.
In longitudinal feeding or disease-induction studies, weights drift. Rats fed a high-fat, high-carbohydrate diet for 20 weeks gained weight and developed elevated fasting glucose, glucose intolerance, higher insulin resistance indices, and hypertriglyceridemia, a phenotype the investigators confirmed before treatment began [2]. High-fat diet mouse studies follow the same pattern, which is why the obese mice in the polysaccharide trial were characterized as diet-induced before the 6-week dosing window opened [3]. If your protocol fixes the dose at the starting weight, the per-kg exposure in a growing animal declines week by week. Decide in advance whether you dose per current weight or per enrollment weight and state that choice in your methods.
Step 2: Choose the exponent
The default exponent for metabolic scaling is 0.75. Two situations justify a different value.
- Surface-area-linked quantities, such as some chemotherapeutic dosing traditions, traditionally use an exponent of 0.67, the two-thirds power that tracks geometric surface area.
- Empirical data from your own species or colony can override the default. If you have measured metabolic rate or food intake across a range of body sizes, regress the log of the metabolic measure against the log of body mass. The slope is your exponent. Textbook value 0.75 is a population average, and individual datasets sometimes sit between 0.67 and 0.8.
For most dosing and nutrition calculations in mammalian research, keep 0.75 unless you have a specific reason to change it, and record the exponent you used in your methods section.
Step 3: Calculate metabolic weight
In Python, define a small function once and reuse it across the whole cohort.
def metabolic_weight(bw_kg, exponent=0.75):
    if bw_kg <= 0:
        raise ValueError("Body weight must be greater than zero")
    return bw_kg ** exponent

# A 25 kg dog
mw_dog = metabolic_weight(25)
print(f"Metabolic weight: {mw_dog:.2f} kg^0.75")

# A 175 g rat, converted to kg first
mw_rat = metabolic_weight(0.175)
print(f"Metabolic weight: {mw_rat:.4f} kg^0.75")
Expected output:
Metabolic weight: 11.18 kg^0.75
Metabolic weight: 0.2706 kg^0.75
In a spreadsheet, put body weight in kilograms in column A and use:
=POWER(A2, 0.75)Fill the formula down the column to process an entire cohort. For the 25 kg dog, POWER(25, 0.75) returns 11.1803. For the 0.175 kg rat, it returns 0.2706.
On a handheld scientific calculator, use the x^y or power key: 25, then the power key, then 0.75.
Step 4: Convert to the quantity you need
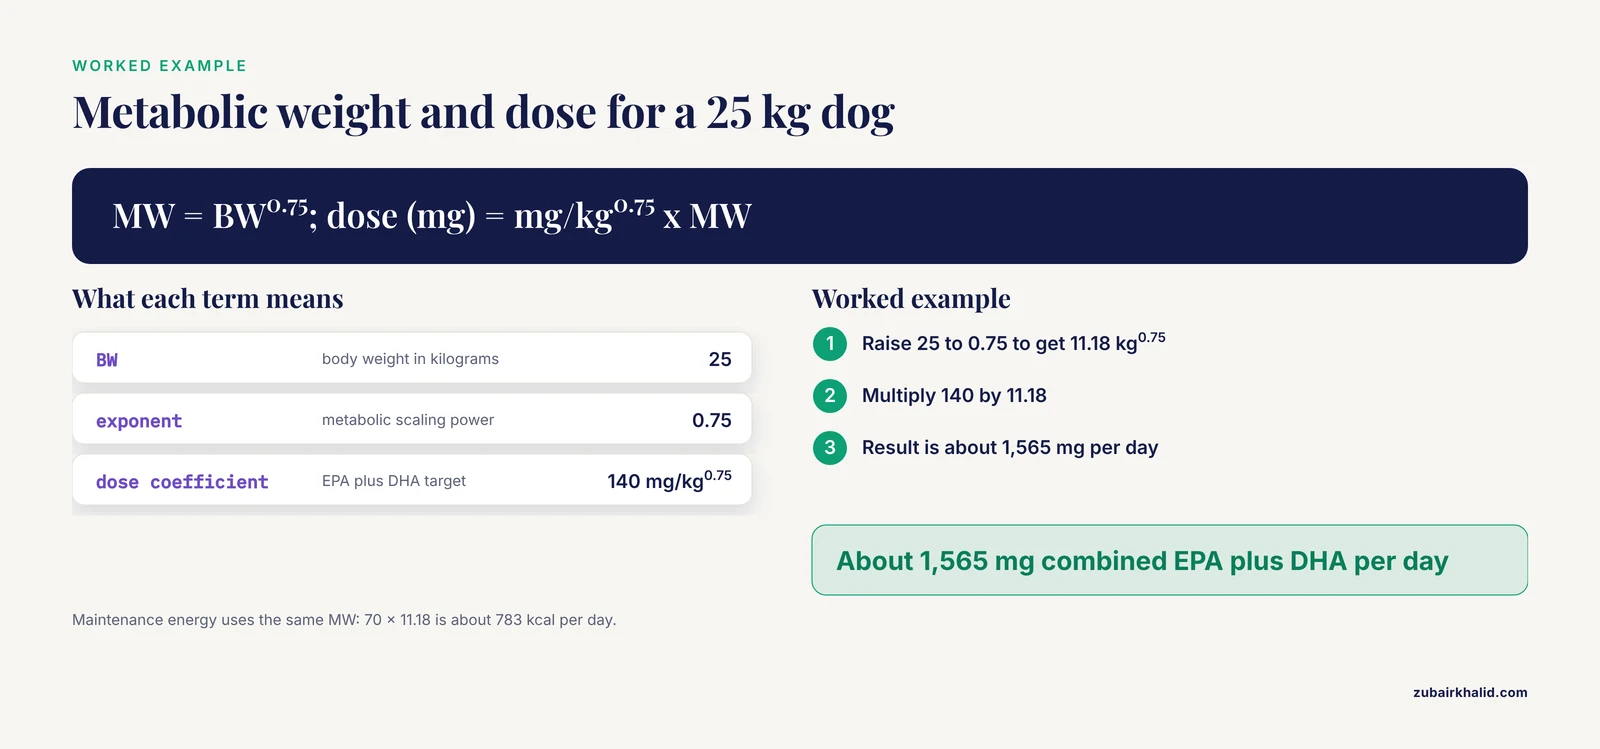
The most common conversions are dose and energy. The general forms are:
Total dose (mg) = dose per kg^0.75 (mg/kg^0.75) x MW
Maintenance energy (kcal/day) = 70 x MW
Continuing the 25 kg dog example with the chronic kidney disease target from the omega-3 diet study [1]:
def metabolic_dose(dose_per_kg075, bw_kg, exponent=0.75):
    return dose_per_kg075 * metabolic_weight(bw_kg, exponent)

# 140 mg of combined EPA plus DHA per kg^0.75
print(metabolic_dose(140, 25))
Expected output:
1565.24A 25 kg dog on that target should receive about 1,565 mg of combined EPA and DHA per day. The same function handles the maintenance energy calculation if you pass 70 as the coefficient.
For cross-species scaling, compute the exponentiated weight ratio first:
mouse_bw = 0.03   # kg, a 30 g mouse
rat_bw   = 0.175  # kg

scaling_factor = (rat_bw / mouse_bw) ** 0.75
print(f"Scaling factor mouse to rat: {scaling_factor:.2f}")

# Mouse total dose of 18 mg (600 mg/kg x 0.03 kg)
mouse_total_mg = 600 * mouse_bw
rat_total_mg   = mouse_total_mg * scaling_factor
print(f"Rat equivalent total dose: {rat_total_mg:.1f} mg")
print(f"Expressed per kg in the rat: {rat_total_mg / rat_bw:.0f} mg/kg")
Expected output:
Scaling factor mouse to rat: 3.75
Rat equivalent total dose: 67.5 mg
Expressed per kg in the rat: 386 mg/kg
Notice what happened. A mouse dose of 600 mg/kg became 386 mg/kg in the rat once total dose was scaled by metabolic weight. This is the arithmetic trap that catches people who copy a mg/kg dose across species without scaling. The mg/kg number itself is not conserved, because the larger animal has proportionally less metabolic tissue per kilogram of body mass.
Step 5: Verify and document
Run three checks before you trust the output.
The inverse power check. Raising the metabolic weight to the power of 4/3 must return the original body weight, because 0.75 and 4/3 are reciprocal exponents.
round(mw_dog ** (4/3), 6) == 25 # TrueThe monotonicity check. Heavier animals must always produce larger metabolic weights. If your spreadsheet returns a smaller value after a weight increase, a cell reference or unit conversion is broken.
The range check. Across the 1 to 80 kg dog range evaluated in the omega-3 diet analysis, metabolic weight runs from 1.0 to about 26.8 kg^0.75 [1]. If any value falls outside a plausible range for your species, check the units.
Document four things in your notebook or methods text: the raw body weight, the exponent, the dose coefficient and its units (mg/kg versus mg/kg^0.75), and the date of the weight measurement. Anyone reproducing your work needs all four.
Key Formulas at a Glance
| Quantity | Formula | Units | Typical use |
|---|---|---|---|
| Metabolic weight | BW ^ 0.75 | kg^0.75 | Input to all other scaling calculations |
| Maintenance energy requirement | 70 x BW ^ 0.75 | kcal/day | Feed planning, diet formulation |
| Linear dose | dose coefficient x BW | mg/kg | Standard rodent bolus dosing |
| Metabolic dose | dose coefficient x BW ^ 0.75 | mg/kg^0.75 | Nutrients and compounds whose handling scales with metabolism |
| Cross-species scaling factor | (BW_B / BW_A) ^ 0.75 | dimensionless | Translating a total dose between species |
| Inverse check | MW ^ (4/3) | kg | Verifying a metabolic weight calculation |
Worked Examples Drawn from Published Animal Studies
Rat metabolic weight and dosing context. The antiretroviral regimen study used 42 male Sprague Dawley rats of 150 to 180 g, subdivided into groups of seven for treatment [2]. Taking a midpoint weight of 0.165 kg, the metabolic weight is 0.165^0.75, or about 0.256 kg^0.75. If a regimen were expressed per kg^0.75 instead of per kg, a group of seven such rats would collectively require seven times the per-animal amount, which is exactly the kind of batch calculation a spreadsheet column handles in one fill-down.
Mouse dose administration. The Golden Flower Tibetan Tea polysaccharide study delivered 600 mg per kg per day for 6 weeks to diet-induced obese mice and reported improved glucose tolerance, reduced areas under the glucose and insulin tolerance test curves, improved fasting insulin-derived indices, reduced dyslipidemia and transaminase elevation, and better liver and pancreatic histopathology [3]. Note the exposure framing. Obese animals on a high-fat diet gain weight during the induction phase, so the actual per-kg dose delivered at week six differs from week zero unless investigators reweigh and adjust.
Gerbil dose and inter-animal variation. The Mongolian gerbil metformin study dosed at 100 mg/kg/day by oral gavage for 5 weeks. Metformin lowered 2-hour post-load glucose and improved hepatic steatosis, but the multi-organ molecular response varied between animals, with hepatic mitochondrial substrate carriers and lipid-handling factors correlating with systemic glycemic burden [4]. Fixed mg/kg dosing does not guarantee uniform metabolic exposure or response across individuals, which is one reason to record each animal's weight and metabolic weight individually rather than dosing from a group average.
Dog nutrition targets. The omega-3 study provides the cleanest head-to-head comparison. Modeling dogs from 1 to 80 kg eating their maintenance energy requirement, the authors found that cardiac targets expressed per kg of body weight were met only in small dogs, while chronic kidney disease targets expressed per kg^0.75 held their intake-to-recommended ratio constant across all weights, delivering 42.4 to 79.1 percent of the recommended dose depending on the diet [1]. If you model nutrient or supplement delivery in any animal where intake scales with metabolism, express both the delivered amount and the target on the same body-weight basis before you conclude anything about adequacy.
Metabolic Weight Calculator Tips
Put units in your column headers. A column named "BW_kg" and another named "Dose_mg_per_kg075" prevent the most frequent spreadsheet failure, which is multiplying a dose coefficient in mg/kg^0.75 by a body weight in grams.
Compute once, reference everywhere. In a spreadsheet, dedicate one column to metabolic weight and reference it from dose and energy columns. In Python, compute it inside a function so every downstream number inherits the same exponent. If you change the exponent, one edit updates the whole analysis.
Log-transform for scaling analyses. If you want to estimate the scaling exponent from your own colony data, take log10 of both metabolic measure and body weight, run a linear regression, and read the slope. This is the standard allometric method and it also reveals outliers, which show up as points far from the fitted line.
Keep raw weights in a separate sheet. Store the measured values untouched and do all transformations in formula columns or a script. Recalculating metabolic weight from a rounded intermediate value compounds rounding error across a cohort.
Match the basis of your comparison. When you cite a target dose from the literature, check whether it is per kg, per kg^0.75, or per unit of body surface area before you plug it into your calculator. The omega-3 study exists precisely because mixing these bases silently changes the delivered dose [1].
Common Mistakes and Limitations
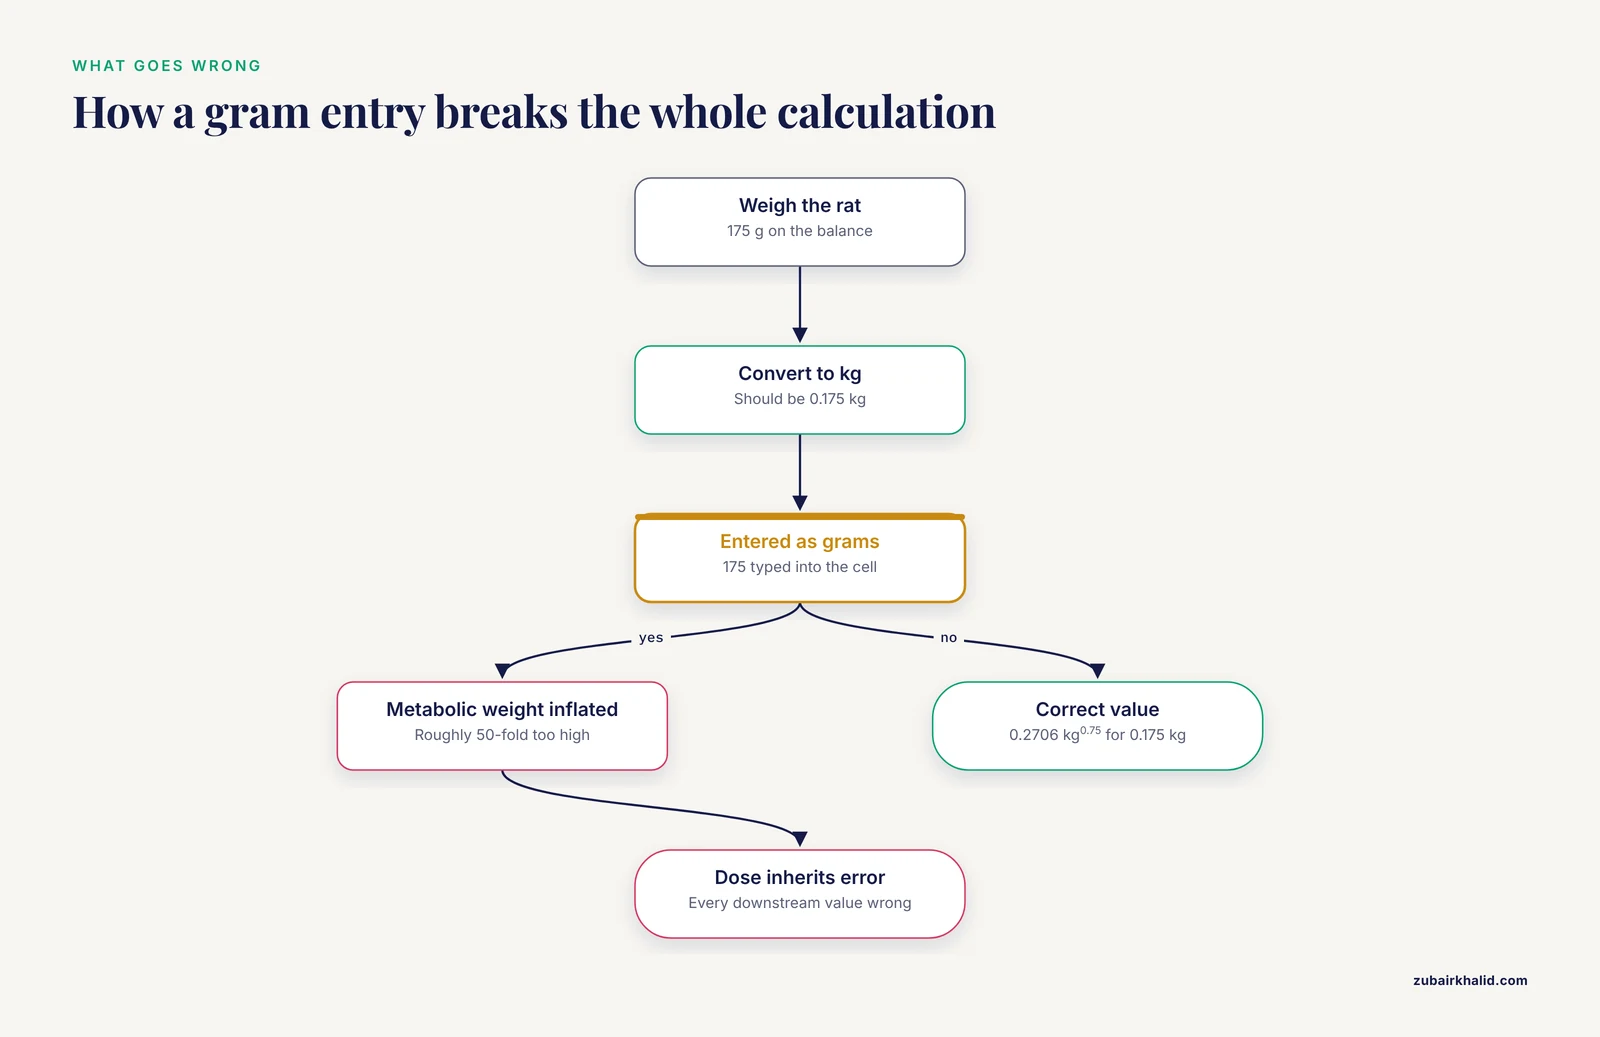
Grams versus kilograms. Entering 175 instead of 0.175 for a rat inflates the metabolic weight by a factor of 175^0.75, roughly 50-fold. Every downstream dose inherits that error. Sanity-check any rodent value above about 1 kg^0.75 and any mouse value above about 0.1 kg^0.75.
Mixing dose bases. Multiplying an mg/kg coefficient by a metabolic weight, or an mg/kg^0.75 coefficient by raw body weight, produces a number that looks plausible and is wrong. The unit on the coefficient tells you which body-weight basis to use. The cardiac and renal omega-3 targets in the dog diet study, 65 mg/kg total versus 140 mg/kg^0.75, are a real example of two bases in the same therapeutic area [1].
Forgetting that Python handles negative bases differently. Raising a negative number to a fractional power in Python does not raise an error. It returns a complex number, which then propagates silently through your analysis. Guard against it explicitly, as the function above does with a ValueError for nonpositive input.
Spreadsheet error messages and their fixes. In Excel or Google Sheets, =POWER(-25, 0.75) returns #NUM! because a negative base with a fractional exponent is undefined in the real numbers. Fix the sign or wrap the input in ABS() if you genuinely need the magnitude. =POWER("25 kg", 0.75) returns #VALUE! because the input is text. Strip units from the cell and keep them in the header. A #REF! after deleting a column means a dose column lost its body weight reference. Rebuild the reference rather than typing a constant.
Assuming a fixed weight across the study. Diet-induced and disease models change weight over time. Prediabetic rats on a high-fat, high-carbohydrate diet gained weight over 20 weeks of induction [2], and obese mouse models are defined by their weight trajectory [3]. A dose frozen at the enrollment weight drifts in per-kg terms as the animal grows. State your dosing basis in the protocol.
Treating metabolic weight as the whole metabolic picture. Metabolic weight scales intake and energy turnover, but it does not capture tissue-level metabolic state. In a mouse model of diet-induced obesity followed by nutritional weight loss, visceral white adipose tissue failed to fully recover even after body weight normalized, because defective collagen degradation by progenitor cells and macrophages allowed fibrosis to persist and progress during weight loss [5]. Two animals with identical body weights can carry different adipose tissue composition, insulin sensitivity, and inflammatory state. Use metabolic weight for dosing and nutrition arithmetic, and use direct metabolic measurements for phenotype.
Expecting uniform response from a uniform dose. Even within a species at a fixed mg/kg dose, individual response varies. In the gerbil metformin study, glycemic response differed between animals and the underlying multi-organ molecular signatures differed with it [4]. A metabolic weight calculator refines the dose arithmetic. It does not standardize biology.
Applying 0.75 outside its evidence base. The three-quarters exponent is an interspecific average for mammals and birds. Non-mammalian species, developing animals, and specific pathological states can deviate. When precision matters, measure the scaling relationship in your own system or use a value validated for your species in the veterinary or laboratory animal literature.
One further limitation applies regardless of calculation: individual animals in clinical or research settings need evaluation by a veterinarian or the responsible study veterinarian before any dosing decision is finalized, especially where disease changes drug handling.
Frequently Asked Questions
What is a metabolic weight calculator?
It is a tool, whether a spreadsheet formula, a short script, or a handheld calculator, that converts an animal's body weight into metabolic weight by raising the weight in kilograms to the 0.75 power. That transformed value is the correct basis for quantities that scale with metabolism, such as maintenance energy requirements and metabolically scaled doses.
Why is the exponent 0.75 and not 1?
Because metabolic rate does not scale linearly with body mass. Kleiber's law, a foundational relationship in comparative physiology, shows that metabolic rate across mammals and birds scales with mass to approximately the three-quarters power. A heavier animal has proportionally less metabolic turnover per kilogram than a lighter one, and the 0.75 exponent captures that.
What is the difference between mg/kg and mg/kg^0.75 dosing?
An mg/kg dose grows in direct proportion to body weight, while an mg/kg^0.75 dose grows with metabolic weight, which rises more slowly than raw weight. In the dog omega-3 analysis, targets set per kg of body weight were met only in small dogs as body weight rose across 1 to 80 kg, while targets set per kg^0.75 kept a constant intake-to-target ratio across the whole range [1].
Can I use a metabolic weight calculator for both rats and mice in the same study?
Yes, the formula is the same for any animal. Weigh each animal in kilograms, apply the same exponent, and keep the values in per-animal rows. Do not use a group average weight for the whole cage, because individual variation in metabolic weight translates directly into individual variation in exposure.
How do I calculate metabolic weight in Excel or Google Sheets?
Enter the body weight in kilograms in a cell and use the formula =POWER(A2, 0.75). To scale a dose expressed per kg^0.75, use =140*POWER(A2,0.75), replacing 140 with your coefficient. To convert to maintenance energy in kcal per day, use =70*POWER(A2,0.75).
Does metabolic weight work for nutrition and energy requirements?
Yes. Maintenance energy requirements are conventionally computed as 70 multiplied by body weight in kilograms raised to the 0.75 power, giving kcal per day. For a 25 kg animal this is about 783 kcal per day. Food intake follows metabolic weight, which is why the dog diet study modeled intake from the maintenance energy requirement [1].
Is metabolic weight the same as body surface area?
No. Body surface area scales close to the two-thirds power of body mass, and it is the traditional basis for certain dosing traditions such as some oncology protocols. Metabolic weight uses the three-quarters power. The two are related but not interchangeable, so always confirm which basis a published dose or target uses before applying it.
How often should I reweigh animals during a study?
At minimum, weigh at enrollment, at the start and end of any treatment period, and at intervals frequent enough to track the trajectory in a model where weight changes, such as high-fat diet induction [2]. If your protocol doses per current weight, each dosing event needs a current weight. If it doses per enrollment weight, say so in your methods and be aware that per-kg exposure drifts as the animal changes.
Further Reading
Sources
- Optimizing omega-3 supplementation in chronically ill dogs: The impact of body weight and dietary inclusion rates.
- Nucleotide/Nucleoside Reverse Transcriptase Inhibitor-Based HIV cART Regimens Produce Mixed Metabolic Responses in Diet-Induced Prediabetic and Nonprediabetic Sprague Dawley Rats.
- Multi-scale structural profiling and microbiota-linked metabolic benefits of Golden Flower Tibetan Tea polysaccharide components in high-fat diet-induced obese mice.
- Tissue-resolved transcriptomic and proteomic profiling reveals organ-specific molecular signatures associated with inter-animal variation in glycemic response to metformin in obese diabetic Mongolian gerbils.
- A weight loss fibrotic response in visceral fat is driven by defective lysosome-dependent collagenolysis.