Inbreeding Coefficient Calculator: How to Calculate COI
By Dr. Zubair Khalid, DVM, MS, PhD ·

By the end of this guide you will be able to calculate an inbreeding coefficient (COI) three ways, by hand with Wright's path method, with a short Python script that reproduces the standard tabular method, and from SNP genotype data using excess homozygosity or runs of homozygosity. You will also learn which estimator fits your data, how to sanity check the output, and the mistakes that most often produce a wrong or misleading number.
To follow along you need a pedigree file (individual, sire, dam) or a genotype dataset, plus Python 3.7 or later. No packages beyond the standard library are required for the pedigree calculations. A published genetics calculator like this is one of the oldest tools in the biology calculator family, and the genomic versions built on SNP data have turned it into a genuine bioinformatics calculator used across livestock, conservation, and plant breeding.
What the Inbreeding Coefficient Measures
The inbreeding coefficient, usually written F, is the probability that the two alleles at a randomly chosen locus in an individual are identical by descent, meaning both copies descend from the same allele in a common ancestor. This identity by descent (IBD) framing goes back to Wright, and a recent review of inbreeding assessment methods describes F as a quantitative measure of autozygosity, the state of having paired chromosome segments that are identical by descent [1].
Two points follow directly from the definition. First, F is a probability, so it ranges from 0 to 1 and is often reported as a percentage. Second, F is a relative quantity. It is measured against a reference population, so the same numeric value can mean different things in a landrace breed with a shallow pedigree and in a closed line with a century of recorded matings.
A high F matters because inbreeding raises the chance that deleterious recessive alleles become homozygous, which is the mechanism behind inbreeding depression, the reduction in fitness or performance seen in the offspring of related parents [2].
Four Ways to Estimate COI
Modern practice uses four estimator families, and a 2026 review in Biology emphasizes that they capture related but distinct aspects of autozygosity and are therefore not fully interchangeable [1]. The same four estimators, F_PED, F_GRM, F_ROH, and F_HBD, were compared directly in a study of Japanese Holstein bulls, which also showed that genomic inbreeding rose sharply in animals born after genomic selection was introduced [3].
| Method | Input data | Core idea | Strengths | Main caveat |
|---|---|---|---|---|
| F_PED (pedigree) | Recorded ancestry | Probability of IBD from shared ancestors | Cheap, works on historical animals | Only as good as the pedigree |
| F_HOM (excess homozygosity) | Genotypes, allele frequencies | Observed versus expected homozygosity | Simple, one line of code | Confounded by selection and drift |
| F_GRM (relationship matrix) | Genome-wide SNPs | Diagonal of the genomic relationship matrix | Individual level, no pedigree needed | Marker density dependent |
| F_ROH (runs of homozygosity) | Genotypes or sequence | Fraction of the genome in long homozygous tracts | Tracks autozygous segments directly | Sensitive to detection parameters [1] |
| F_HBD (homozygous by descent) | High-density genotypes or sequence | Probabilistic model of descent segments | Can separate ancient and recent inbreeding | Computationally demanding |
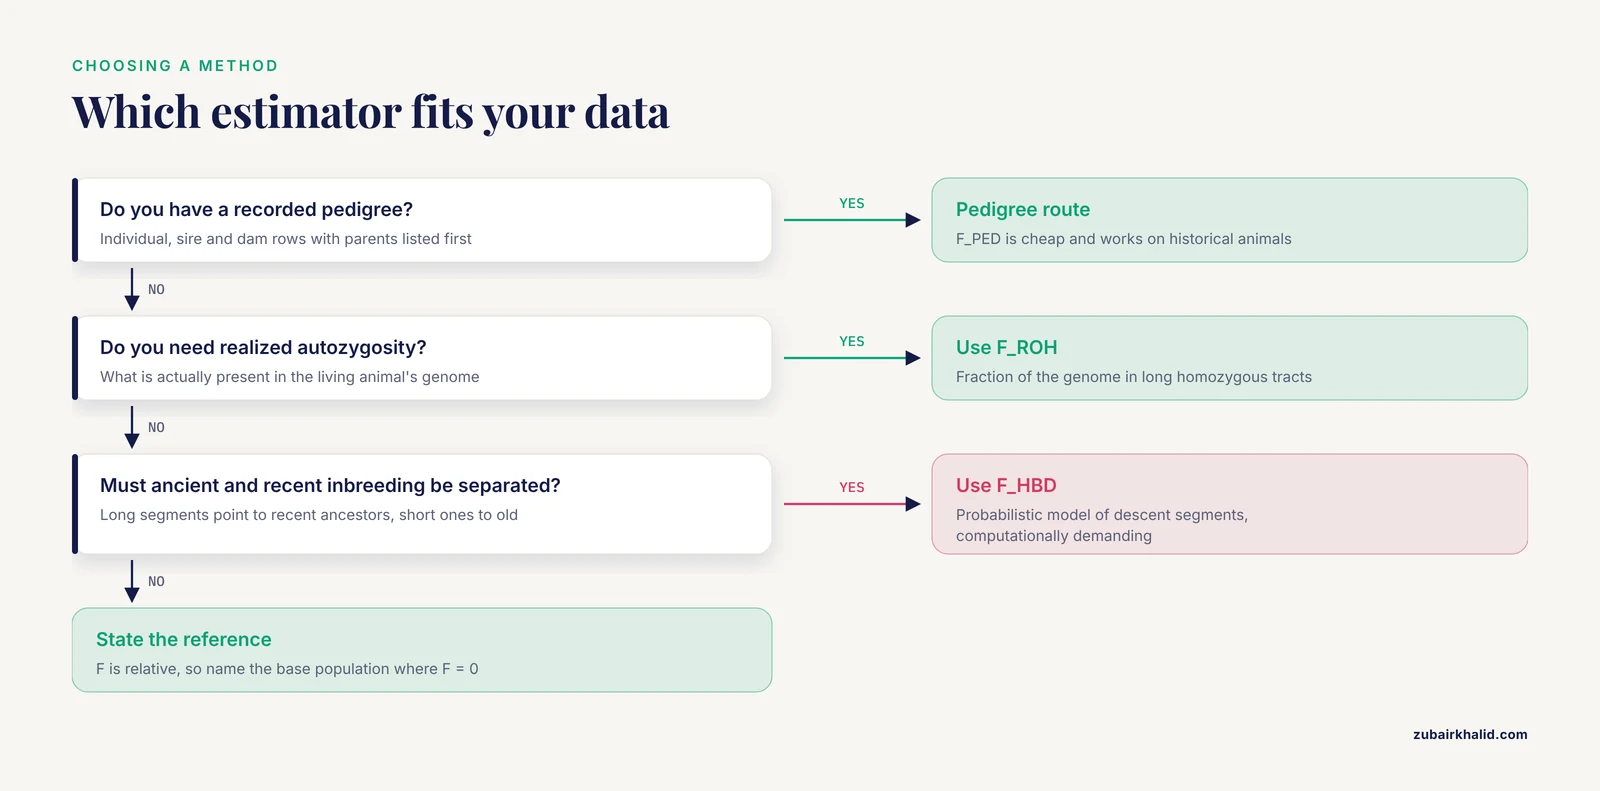
The choice depends on your question. If you want the risk carried by an unborn animal from its parents, pedigree methods are standard. If you want the autozygosity actually present in an animal's genome, F_ROH is the current default in livestock and conservation genomics [1].
Inbreeding Coefficient Calculator Step by Step (Pedigree Method)
Step 1. Build and verify the pedigree
Write every individual as a row with three fields, the individual's ID, the sire, and the dam. Unknown parents are recorded as missing. Two checks matter before any calculation. The pedigree must be free of loops, meaning no animal is its own ancestor, and parents must be listed before their offspring if you plan to run the tabular method. Molecular data can help here, because comparing genotypes against claimed parentage detects Mendelian inconsistencies, animals whose pedigree and genotype information disagree, a step demonstrated in a large Australian Angus population [4].
Step 2. Apply Wright's path method by hand
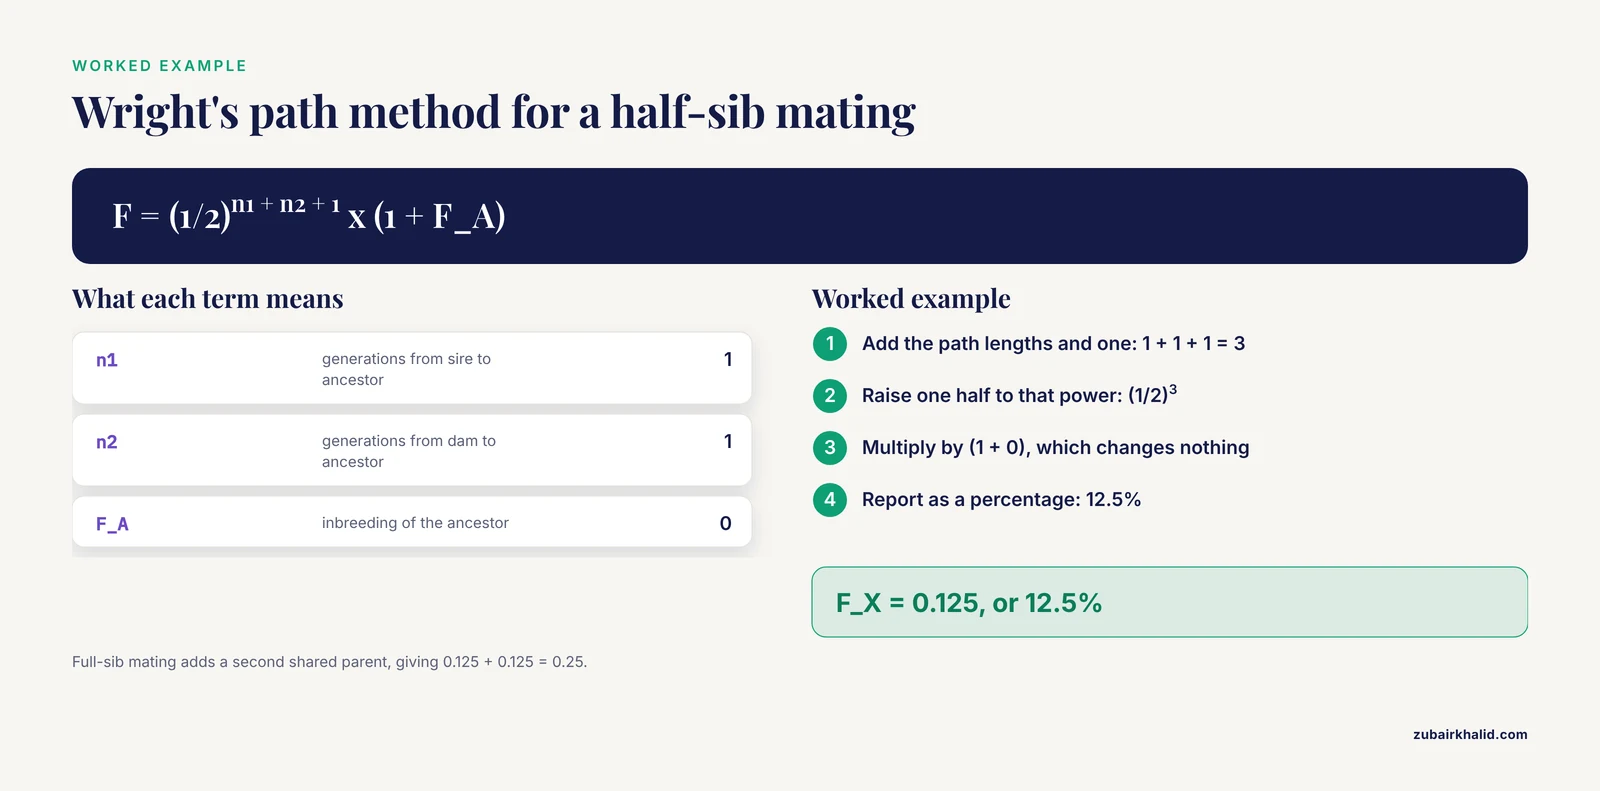
Wright's path method sums a contribution from every common ancestor of the two parents:
F_offspring = Σ (1/2)^(n1 + n2 + 1) × (1 + F_A)

n1 = number of generations from the sire to the common ancestor A
n2 = number of generations from the dam to the common ancestor A
F_A = the inbreeding coefficient of ancestor A itself
Worked example, half-sib mating. A sire S and dam D are half-sibs, both sired by the same stallion P, with unrelated dams. P is the only common ancestor and P is not inbred, so n1 = 1, n2 = 1, and F_A = 0.
F_X = (1/2)^(1 + 1 + 1) × (1 + 0)
    = (1/2)^3
    = 0.125, or 12.5%
Worked example, full-sib mating. S and D share both parents P and Q, neither inbred. Each parent contributes (1/2)^3 = 0.125, and the contributions add.
F_X = 0.125 + 0.125 = 0.25, or 25%The same arithmetic gives the standard reference values for offspring of particular mating types.
| Mating type of the parents | Expected COI of the offspring |
|---|---|
| Identical twins mated (genetically, selfing) | 0.50 |
| Parent × offspring, or full siblings | 0.25 |
| Half siblings, or uncle × niece | 0.125 |
| First cousins | 0.0625 |
| Second cousins | 0.015625 |
| Unrelated within the reference population | ≈ 0 |
Each common ancestor that is itself inbred adds the multiplier (1 + F_A), which is why long closed colonies accumulate inbreeding faster than the raw path lengths suggest.
Step 3. Use the tabular method in Python
The path method becomes unwieldy with deep pedigrees. The tabular method, the numerator relationship matrix recursion from standard quantitative genetics, computes the coancestry φ between every pair of individuals, and the COI of an individual equals the coancestry between its two parents. The recursions are φ_ii = (1 + F_i)/2 for self-kinship, and φ_ij = (φ_sire_i,j + φ_dam_i,j)/2 for an individual i and an older individual j.
Save the following as coi.py and run it with python3 coi.py.
def coi_from_pedigree(pedigree):
    """pedigree maps individual -> (sire, dam). Use None for unknown parents.
    Parents must be listed before their offspring."""
    phi = {}
    F = {}

    def kin(a, b):
        if a is None or b is None:
            return 0.0
        key = (a, b) if a < b else (b, a)
        return phi.get(key, 0.0)

    for ind in pedigree:
        sire, dam = pedigree[ind]
        previous = list(F)
        F[ind] = kin(sire, dam)
        phi[(ind, ind)] = 0.5 * (1.0 + F[ind])
        for j in previous:
            value = 0.5 * (kin(sire, j) + kin(dam, j))
            key = (ind, j) if ind < j else (j, ind)
            phi[key] = value
    return F

ped = {
    "P": (None, None),
    "Q1": (None, None),
    "Q2": (None, None),
    "S": ("P", "Q1"),
    "D": ("P", "Q2"),
    "X": ("S", "D"),
}

F = coi_from_pedigree(ped)
for animal, value in F.items():
    print(f"{animal}: F = {value:.4f}")
The expected output for this half-sib mating design is:
P: F = 0.0000
Q1: F = 0.0000
Q2: F = 0.0000
S: F = 0.0000
D: F = 0.0000
X: F = 0.1250
Change the last line of the dictionary so that D is also a offspring of P and Q1, making S and D full siblings, and the output for X becomes 0.2500. That single edit is the fastest way to confirm the script agrees with the hand calculation above.
Step 4. Check your result
Three checks catch most errors. Founders, animals with unknown parents, must come out at F = 0. The offspring of two unrelated founders must be 0. And any value above 0.5 or below 0 signals a loop in the pedigree or parents listed out of order. For population scale work, dedicated pedigree software exists, for example the GRain package version 2.2 used with gene-dropping simulations to compute classical, recursive, Ballou, and Kalinowski inbreeding coefficients in Venezuelan dairy cattle pedigrees covering tens of thousands of animals [5].
Calculating COI From Genotype Data
When no pedigree exists, or when the pedigree is known to be incomplete, genomic estimators fill the gap. A comparative study in German Pomeranian Coarsewool sheep genotyped on the Illumina ovine 50K SNP chip reported a mean F_ROH of 6.2 percent but only a moderate correlation of 0.42 with the pedigree-based coefficient, a pattern seen across livestock species [6].
Excess homozygosity estimator
The simplest genomic estimator compares observed heterozygosity with expected heterozygosity:
F_HOM = 1 - (Ho / He)

Ho = observed heterozygosity, the fraction of typed loci that are heterozygous
He = expected heterozygosity, 2p(1-p) averaged over loci at allele frequency p
Worked example. A genotyped animal is heterozygous at 30 percent of markers while the population allele frequencies give an expected heterozygosity of 40 percent.
F_HOM = 1 - (0.30 / 0.40) = 0.25In a Capsicum collection in southwestern Colombia genotyped with DArTseq markers, observed heterozygosity averaged 1 percent and the population-level inbreeding coefficient F_IS reached 0.24, consistent with the predominantly self-pollinating biology of many chili pepper accessions [7].
Runs of homozygosity
A run of homozygosity (ROH) is a continuous stretch of the genome where an individual is homozygous at every typed marker. Long ROH arise when two identical-by-descent chromosome segments pair up, so the ROH-based coefficient estimates autozygosity directly:
F_ROH = (sum of ROH lengths) / (total autosomal length analyzed)Worked example in Python. Assume a segments file roh_segments.csv with columns start and end in megabases, and a callable autosomal length of 2,500 Mb after filtering.
import csv

CALLABLE_AUTOSOME_MB = 2500.0

total_roh = 0.0
with open("roh_segments.csv") as handle:
    for row in csv.DictReader(handle):
        length = float(row["end"]) - float(row["start"])
        total_roh += length

f_roh = total_roh / CALLABLE_AUTOSOME_MB
print(f"Total ROH: {total_roh:.1f} Mb")
print(f"F_ROH = {f_roh:.3f}")
If the file contains 300 Mb of ROH in total, the output is:
Total ROH: 300.0 Mb
F_ROH = 0.120
F_ROH is sensitive to marker density and to the detection parameters, such as minimum segment length and the number of allowed heterozygous positions, so a recent methods review recommends reporting those settings explicitly and standardizing protocols [1]. Segment length also carries information, because long segments point to recent common ancestors while short segments reflect older inbreeding, which supports the shift from single summary numbers toward spatially and temporally stratified analyses of autozygosity [1].
In American mink genotyped with a 70K SNP panel, ROH were detected in every animal, averaging about 150 segments per individual, and mean F_ROH was 0.28 while mean F_HOM was -0.03 and pedigree F_PED was 0.02. The Pearson correlation was 0.72 between F_ROH and F_HOM but only 0.34 between genomic inbreeding and F_PED [2]. That gap is the single most important thing to understand before comparing COI numbers from different calculators.
Inbreeding Coefficient Calculator Tips
- Match the estimator to the question. Use F_PED for planned matings and future offspring, F_ROH for realized autozygosity in the living animal, and F_HBD when you need to separate ancient from recent inbreeding [1].
- Report the reference population. F is relative, so state which base population defines F = 0.
- Report ROH parameters. Minimum window size, minimum segment length, and heterozygote tolerance all change F_ROH [1].
- Validate pedigrees with genotypes. Parentage checking with SNP data catches the record errors that silently deflate F_PED [4].
- Prefer dense markers for segment methods. Sparse panels miss short ROH and bias estimates downward, a sensitivity to marker density highlighted across methods [1].
- Keep the population context. Effective population size and breed structure shape what a given F means. In Awassi sheep genotyped by ddRADseq, F_ROH was low at 0.025, which the authors read as high genetic integrity for that breed [8].
- Track the trend, not just the level. In Caracu cattle, the mean pedigree inbreeding coefficient of the general population was 2.6 percent with a maximum of 44.3 percent, and the closed selected subpopulation showed greater average coancestry and lower diversity despite a similar mean F, showing that a single mean can hide accumulating losses [9].
Common Mistakes and Limitations
- Comparing F_PED and F_ROH as if they were the same number. They measure different things and correlate only moderately in practice, 0.42 in the sheep study and 0.34 between genomic and pedigree estimates in mink [6] [2]. A low pedigree value alongside a high F_ROH usually means an incomplete pedigree, not a calculator bug.
- Assuming an incomplete pedigree is a complete one. Missing ancestors push F_PED toward zero. Studies routinely evaluate pedigree completeness precisely because depth determines what the estimate can capture [5] [9].
- Ignoring sequencing and mapping artifacts. In whole-genome data for Coffea arabica, an allotetraploid, a cross-mapping artifact between homoeologous subgenomes affected 63.7 percent of markers and artificially inflated heterozygosity, flipping the inbreeding coefficient from an implausible negative value near -0.60 to a positive F_IS of 0.37 to 0.52 consistent with self-pollination [10]. Any COI from raw variant calls should be checked for this class of error.
- Confusing the different F statistics. F_IS, F_ST, and an individual COI all carry the letter F but answer different questions. An individual-level coefficient describes one animal, F_IS describes excess homozygosity in a population relative to its substructure.
- Treating F = 0 as proof of unrelatedness. It only means no IBD was detectable given the data, the marker set, and the pedigree depth.
- Ignoring when the inbreeding happened. Ancestral inbreeding that has been purged carries different risk than newly accumulated inbreeding, which is why coefficient families that separate new and ancestral inbreeding were developed for dairy cattle [5], and why segment-based methods that separate ancient and recent autozygosity are gaining favor [1].
- Reading a mean as the whole story. Population means like 2.6 percent in Caracu cattle sit next to maxima above 40 percent, and closed subpopulations can lose diversity even when the mean looks stable [9].
- Expecting one number to capture genetic risk. In the Chinese alligator, captive management reduced inbreeding and raised diversity relative to semi-wild management while simultaneously increasing the accumulation of deleterious mutations under relaxed purifying selection [11]. Low COI does not guarantee a clean genetic load.
One further limitation applies to any individual case. A COI value is a population genetics quantity, and decisions about a particular animal's health or breeding should involve a veterinarian or a population geneticist who can weigh the coefficient against the rest of the picture.
Frequently Asked Questions
What does an inbreeding coefficient of 0.25 mean?
It means there is a 25 percent probability that any single pair of alleles in that individual, one from each parent, are identical by descent, and 0.25 is the expected value for offspring of a parent-offspring or full-sibling mating.
How do I calculate COI from a pedigree step by step?
List each individual with its sire and dam, confirm parents precede offspring, then either sum Wright's path contributions (1/2)^(n1+n2+1) over every common ancestor or run the tabular recursion, which the Python script in this article implements directly.
Is there a single "safe" COI threshold?
No. Acceptable levels depend on species, breed history, and management goals, so published studies interpret values against their own population baseline rather than a universal cutoff.
Why do pedigree-based and genomic COI values disagree?
Pedigree COI depends on recorded ancestry and goes to zero when records are missing, while genomic COI measures actual autozygosity, and the two correlate only moderately in empirical livestock datasets.
Can I calculate COI without any pedigree?
Yes. Genotype data support the excess homozygosity estimator, the genomic relationship matrix, and F_ROH, all of which estimate inbreeding with no pedigree at all.
What is F_ROH and how is it computed?
F_ROH is the fraction of the autosomal genome covered by runs of homozygosity, calculated as the summed length of ROH segments divided by the total callable autosomal length.
Which software can work as an inbreeding coefficient calculator?
Pedigree packages such as GRain handle population-scale pedigree coefficients with gene-dropping simulations, and standard bioinformatics tools compute genomic estimators from SNP data, while the Python implementations here cover small pedigrees and ROH summaries.
Why did my F_IS come out negative?
A negative value means the sample has more heterozygotes than expected under random mating within the reference group, which can reflect genuine outcrossing, a small sample size, or genotyping artifacts such as cross-mapping in polyploid genomes.
Sources
- Evolution of Methods for the Quantitative Assessment of Inbreeding in Livestock.
- Characterizing Runs of Homozygosity and Inbreeding in American Mink Using SNP Data and Pedigree Information.
- Genomic inbreeding coefficients and inbreeding depression of semen production traits at genome-wide and chromosomal levels in Japanese Holstein bulls.
- Short communication: genomic kinship, opposing homozygotes and genetic diversity in a selected population of Australian Angus cattle.
- Pedigree-based evaluation of classical, ancestral, and new inbreeding coefficients in Carora and Criollo Limonero dairy cattle populations.
- Genetic diversity in German Pomeranian Coarsewool sheep and the possibility of breeding for maedi-visna resistance.
- Genome-wide assessment of genetic diversity and population structure of Capsicum in Southwestern Colombia using DArTseq markers.
- Genome-wide selection signatures in Turkish Awassi sheep: uncovering the genetic basis of production traits and adaptation.
- Genetic diversity of Caracu cattle reveals contrasting trends between general and closed populations.
- Genetic diversity and population structure of Coffea arabica in Saudi Arabia revealed by whole-genome resequencing.
- Captive Breeding of the Chinese Alligator Reduces Inbreeding but Increases Genetic Load.