Cross-Checking Online Calculators with Manual Calculations
By Dr. Zubair Khalid, DVM, MS, PhD ·

By the end of this guide you will be able to take any result from an online biology calculator or bioinformatics calculator, reproduce it three independent ways (by hand, in a spreadsheet, and in a short Python script), and state with evidence whether the tool agrees with the formula you intend to use. You will work through four complete checks covering calculations life science students hit most often: an odds ratio with its 95% confidence interval, Cronbach's alpha, a minimum sample size, and GC content with oligonucleotide melting temperature. You will also learn how to set an agreement tolerance, how to compare two calculators across many inputs at once, and which mistakes make two correct tools look like they disagree.
To follow along you need a spreadsheet (Excel, Google Sheets, or LibreOffice Calc), Python 3 with nothing beyond the standard library, a pen and paper, and the web tool you want to verify. Every script below runs as written, with no packages to install.
Why Cross-Checking Online Calculators with Manual Calculations Matters
An online calculator is a small program built on someone's choice of formula, constants, and default options. Those choices are usually reasonable, but they are not always visible, and they are not always the ones your protocol, instructor, or journal expects. A manual calculation exposes the formula. If the web tool disagrees with your paper result, one of three things is true: you made an arithmetic slip, the tool implements a different formula or model, or the tool is wrong. Cross-checking tells you which, and it takes minutes.
Research practice reflects the same discipline. When three fracture risk tools (FRAX, QFracture, and Garvan) were applied to the same patients with early-stage autosomal dominant polycystic kidney disease, the investigators did not assume any of them was correct. They compared the 10-year risk estimates with correlation, Bland-Altman plots, and regression modeling, found broad agreement at the group level, and still reported practical differences between the tools [1]. A team that built an exploratory prototype calculator converting countable study behaviors into a predicted medical residency examination score evaluated it with leave-one-out cross-validation, a procedure that tests the model on cases it was not built from, and still presented it as exploratory [2]. In methodological work, a new decision-making procedure is checked against traditional techniques, and the consistency of the two sets of results forms part of the evidence that the method works [3].
The habit transfers directly to the bench and the laptop. A calculator you did not write is a claim. A manual calculation is the cheapest experiment you can run to test that claim.
What You Need on Hand
- A spreadsheet such as Excel, Google Sheets, or LibreOffice Calc, which gives you a second, independent arithmetic path.
- Python 3 with the standard library only.
- Pen and paper for the first pass. Manual means manual.
- The formula, written down with its constants and assumptions, from a textbook, a methods paper, or the tool's own documentation.
- The online biology calculator or bioinformatics calculator you want to verify.
How to Cross-Check an Online Calculator with a Manual Calculation, Step by Step
- Write down the formula and its assumptions before touching any tool. Define every symbol, list constants (for example Z = 1.96 for a two-sided 95% confidence level), and note the conventions the formula assumes, such as sample variance with n - 1 in the denominator. If the web tool documents its formula, compare yours against it. A tool that hides its method leaves a mismatch unresolvable, which is itself useful to know.
- Do the manual calculation on paper. Choose inputs that make the arithmetic easy, carry one or two guard digits (extra digits beyond the precision you will report), and round only at the end.
- Repeat the arithmetic in a spreadsheet. Enter the formula as separate cell formulas rather than one giant expression, so every intermediate value stays visible. A spreadsheet catches slipped digits and transposed terms that paper hides.
- Repeat it in code. A short script is a third independent path, it is reusable, and it scales to hundreds of inputs when you need to test a tool thoroughly.
- Run the online calculator with identical inputs. Same numbers, same units, and every exposed option recorded: one-sided versus two-sided, continuity correction on or off, which thermodynamic model.
- Compare with a tolerance rule, not with an eyeball. Compute the absolute difference |a - b| and the relative difference |a - b| / a × 100%. If a tool returns 13.87 where your other paths give 13.88, the relative difference is about 0.07%, far below the precision you would print. Set the tolerance from the last decimal place you intend to report.
- Log the check. Tool name, URL, access date, documented formula, inputs, all outputs, tolerance, and verdict. A check you cannot reproduce later never happened.
This table summarizes the five checks used in this guide.
| Quantity | Manual formula | What to verify in the tool | Agreement target |
|---|---|---|---|
| Odds ratio with 95% CI | OR = (a × d) / (b × c), CI = exp(ln OR ± 1.96 × SE) | Which CI method the tool uses (Wald log or exact) | Second decimal place |
| Cronbach's alpha | α = k/(k - 1) × (1 - Σ item variances / total variance) | Number of items, reversed items handled, variance convention | Third decimal place |
| Sample size for a proportion | n = Z² p(1 - p) / d², rounded up | Z-value, one- or two-sided, nonresponse inflation | Exact after rounding up |
| GC content | (G + C) / total bases | Whether ambiguous codes such as N are counted | Exact |
| Oligo melting temperature | Tm = 2(A + T) + 4(G + C) in °C, short oligos | Which model: Wallace rule or nearest-neighbor | Same model on both sides |
Worked Example 1: Odds Ratio and 95% Confidence Interval
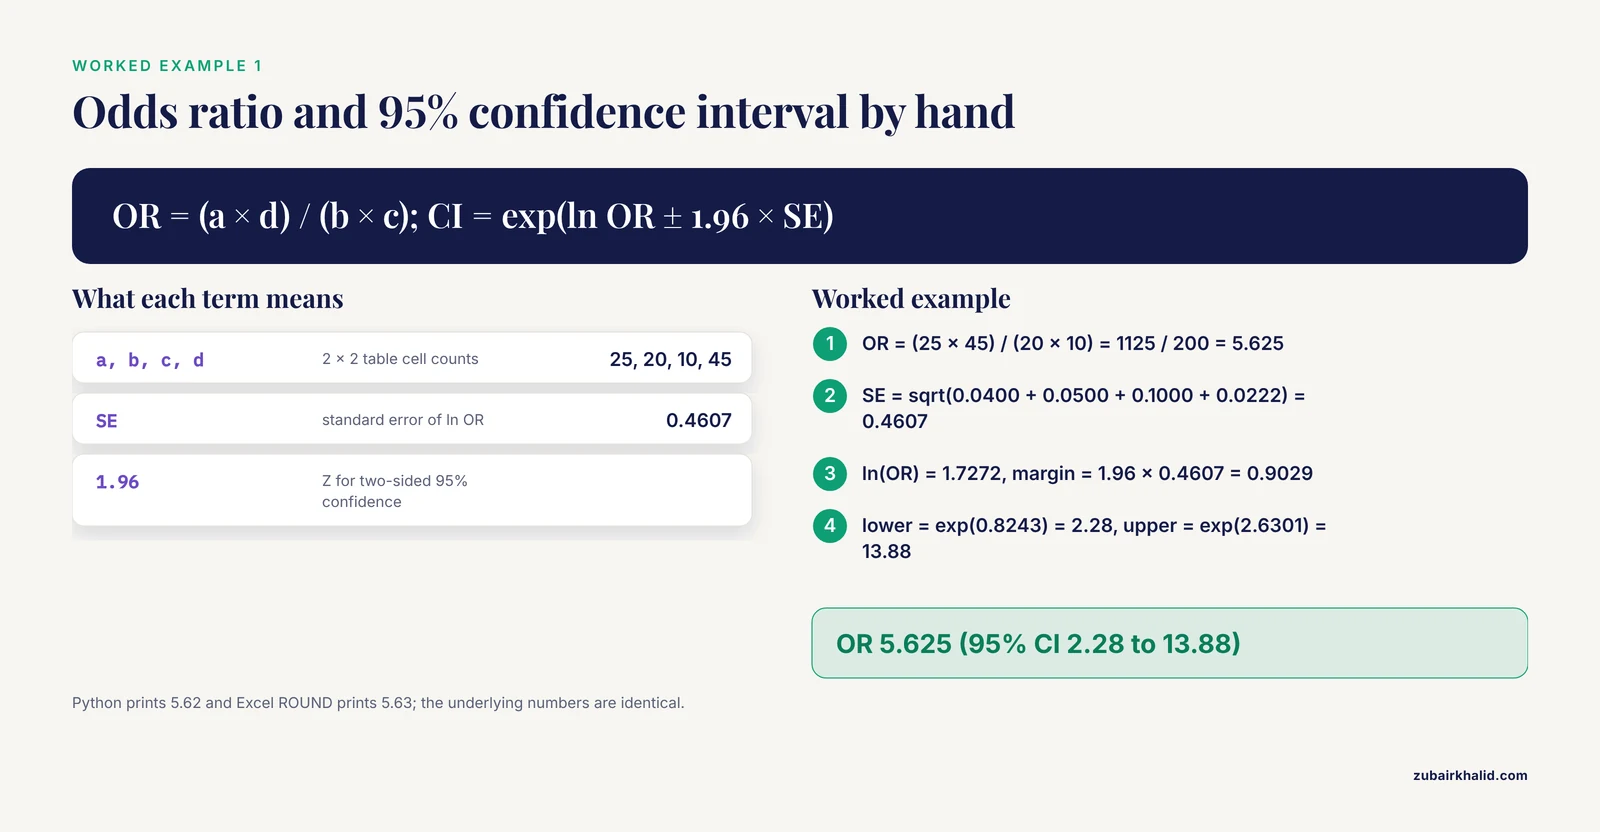
The odds ratio (OR) compares the odds of an event in one group with the odds in another, where odds are the count of events divided by the count of non-events. For a 2 × 2 table with cells a, b, c, d, the OR equals (a × d) / (b × c). The 95% confidence interval (a range that would contain the true value in 95% of repeated samples) is computed on the natural log scale and converted back.
Suppose 45 exposed and 55 unexposed individuals, with 25 events among the exposed and 10 among the unexposed:
| Event | No event | |
|---|---|---|
| Exposed | a = 25 | b = 20 |
| Unexposed | c = 10 | d = 45 |
Manual calculation:
OR = (25 × 45) / (20 × 10) = 1125 / 200 = 5.625

SE = sqrt(1/25 + 1/20 + 1/10 + 1/45)
   = sqrt(0.0400 + 0.0500 + 0.1000 + 0.0222)
   = sqrt(0.2122)
   = 0.4607

ln(OR) = 1.7272
margin = 1.96 × 0.4607 = 0.9029

lower = exp(1.7272 - 0.9029) = exp(0.8243) = 2.28
upper = exp(1.7272 + 0.9029) = exp(2.6301) = 13.88
Spreadsheet, with a in B2, b in C2, c in D2, d in E2, and the OR in F2:
=(B2*E2)/(C2*D2)                              → 5.625
=EXP(LN(F2)-1.96*SQRT(1/B2+1/C2+1/D2+1/E2))   → 2.28
=EXP(LN(F2)+1.96*SQRT(1/B2+1/C2+1/D2+1/E2))   → 13.88
Python:
import math

a, b, c, d = 25, 20, 10, 45
odds_ratio = (a * d) / (b * c)
se = math.sqrt(1/a + 1/b + 1/c + 1/d)
lo = math.exp(math.log(odds_ratio) - 1.96 * se)
hi = math.exp(math.log(odds_ratio) + 1.96 * se)

print(f"OR = {odds_ratio:.2f} (95% CI {lo:.2f} to {hi:.2f})")
Expected output:
OR = 5.62 (95% CI 2.28 to 13.88)The true value is 5.625. Python's display formatting rounds ties toward the even digit, so it prints 5.62, while Excel's ROUND prints 5.63. The underlying numbers are identical. This is the kind of cosmetic mismatch a cross-check should explain rather than chase, and it is a reason to compare at full precision or to state your rounding rule.
Published papers report results in exactly this format. In a cross-sectional study of dental practitioners, doctoral-level education independently predicted adequate knowledge with an odds ratio of 8.54 (95% CI 2.09 to 34.97) [4]. Two errors you will actually see while checking tools like this: a zero in any cell raises ZeroDivisionError: division by zero when the script computes 1/a, fixed by adding 0.5 to all four cells (the standard Haldane-Anscombe continuity correction) or by switching to an exact method, and a mislabeled table can produce an OR of 0, which raises ValueError: math domain error because ln(0) is undefined. Check the cell order before blaming the tool.
Worked Example 2: Cronbach's Alpha for a Three-Item Scale
Cronbach's alpha measures internal consistency, the degree to which a set of items measures the same underlying property. Validation studies report it as standard practice. The Functional Assertiveness Scale for community pharmacists was assessed with exploratory and confirmatory factor analysis, and internal consistency was evaluated with Cronbach's alpha [5]. The Brazilian version of a back pain knowledge survey reported internal consistency the same way, alongside reliability by intraclass correlation coefficient and measurement error as the smallest detectable change [6].
The formula uses k items, the sample variance of each item, and the sample variance of each respondent's total across items:
α = k/(k - 1) × (1 - Σ item variances / total variance)
Five respondents rated three items from 1 to 5:
| Respondent | Item 1 | Item 2 | Item 3 | Total |
|---|---|---|---|---|
| 1 | 4 | 4 | 4 | 12 |
| 2 | 3 | 2 | 4 | 9 |
| 3 | 5 | 5 | 4 | 14 |
| 4 | 2 | 3 | 2 | 7 |
| 5 | 1 | 1 | 1 | 3 |
Manual calculation:
Item 1: 4, 3, 5, 2, 1   mean 3.0   squared deviations 1, 0, 4, 1, 4
        SS = 10         variance = 10 / (5 - 1) = 2.5
Item 2: 4, 2, 5, 3, 1   mean 3.0   squared deviations 1, 1, 4, 0, 4
        SS = 10         variance = 2.5
Item 3: 4, 4, 4, 2, 1   mean 3.0   squared deviations 1, 1, 1, 1, 4
        SS = 8          variance = 2.0

sum of item variances = 2.5 + 2.5 + 2.0 = 7.0

Totals: 12, 9, 14, 7, 3   mean 9.0   squared deviations 9, 0, 25, 4, 36
        SS = 74           total variance = 74 / 4 = 18.5

alpha = (3 / 2) × (1 - 7.0 / 18.5) = 1.5 × 0.6216 = 0.932
Python:
import statistics

responses = [
    [4, 4, 4],
    [3, 2, 4],
    [5, 5, 4],
    [2, 3, 2],
    [1, 1, 1],
]

k = len(responses)
item_variances = [statistics.variance(col) for col in zip(*responses)]
total_variance = statistics.variance(sum(r) for r in responses)

alpha = (k / (k - 1)) * (1 - sum(item_variances) / total_variance)
print(f"Cronbach's alpha = {alpha:.3f}")
Expected output:
Cronbach's alpha = 0.932One detail matters for cross-checks here. Alpha is a ratio of variances, so a consistent switch between sample variance (n - 1) and population variance (n) leaves alpha unchanged, but your intermediate variance values will not match a tool that uses the other convention. Compare intermediate steps only against the same convention.
Worked Example 3: Minimum Sample Size for a Prevalence Survey
Prevalence is the proportion of a population that has a condition at a given time. A cross-sectional prevalence survey needs a minimum sample size n so the estimate lands within a chosen margin of error d of the true proportion p. The standard single-proportion formula is n = Z² p(1 - p) / d², where Z = 1.96 corresponds to a two-sided 95% confidence level (two-sided means the margin allows deviation in either direction). One published cross-sectional study calculated a minimum sample size of 119 before collecting questionnaire data [7]. The inputs were the authors' choice, but one common set of assumptions produces that figure:
n = Z² × p × (1 - p) / d²
  = 1.96² × 0.5 × 0.5 / 0.09²
  = 3.8416 × 0.25 / 0.0081
  = 0.9604 / 0.0081
  = 118.57

round up: n = 119
Python:
import math

Z = 1.96   # two-sided 95% confidence
p = 0.5    # most conservative expected proportion
d = 0.09   # margin of error, 9 percentage points

n_raw = Z**2 * p * (1 - p) / d**2
print(f"raw n = {n_raw:.2f}")              # raw n = 118.57
print(f"rounded up = {math.ceil(n_raw)}")  # rounded up = 119
Sample-size web tools frequently add options the bare formula lacks, such as a continuity correction or inflation for expected nonresponse (dividing by the anticipated response rate). Two correct tools can therefore differ substantially. Read the options panel before you declare a mismatch.
Worked Example 4: GC Content and Melting Temperature in a Bioinformatics Calculator
GC content is the fraction of a DNA sequence that is guanine or cytosine. Take the 18-nucleotide oligonucleotide (a short single-stranded DNA fragment, such as a primer) ATGCCGTAACGGATCGGC. Counting by hand:
A = 4, T = 3, G = 6, C = 5
GC content = (6 + 5) / 18 = 11 / 18 = 61.1%
Python:
seq = "ATGCCGTAACGGATCGGC"
gc = sum(seq.upper().count(base) for base in ("G", "C"))
print(f"{gc} of {len(seq)} bases are G or C")
print(f"GC content = {gc / len(seq):.1%}")
Expected output:
11 of 18 bases are G or C
GC content = 61.1%
For melting temperature (Tm), the temperature at which half of the DNA duplexes dissociate, the Wallace rule gives a quick estimate for short oligonucleotides: Tm = 2(A + T) + 4(G + C) in degrees Celsius. For the 12-mer ATGCGTACGTTA:
A + T = 3 + 4 = 7
G + C = 3 + 2 = 5
Tm = 2 × 7 + 4 × 5 = 34 °C
A bioinformatics calculator for Tm often implements nearest-neighbor thermodynamics instead, which accounts for stacking interactions between adjacent bases and for salt concentration. It will not match the Wallace rule, and it is not supposed to. Before comparing numbers, confirm which model the tool implements, usually in its documentation or methods note. Agreement is only expected when both sides use the same model.
Comparing Many Results at Once: Bland-Altman Limits of Agreement
A single matched pair tells you little. When you can run many inputs through both a manual path and a tool, a Bland-Altman analysis summarizes the comparison. For each pair you plot the difference against the mean of the two values, then report the mean difference (the bias) and the limits of agreement, defined as the mean difference ± 1.96 × SD of the differences. Correlation alone is not enough, because two methods can rise and fall together while one runs systematically higher, which is why the fracture-risk comparison described earlier paired correlation with Bland-Altman plots [1].
import statistics

tool_a = [12.1, 8.4, 15.2, 9.9, 11.3]    # manual path
tool_b = [11.8, 8.9, 14.6, 10.2, 11.0]   # web tool

diffs = [x - y for x, y in zip(tool_a, tool_b)]
pairs = [(x + y) / 2 for x, y in zip(tool_a, tool_b)]  # x-axis of the plot

mean_diff = statistics.mean(diffs)
sd_diff = statistics.stdev(diffs)

print(f"mean difference = {mean_diff:.2f}, SD = {sd_diff:.2f}")
print(f"limits of agreement = {mean_diff - 1.96 * sd_diff:.2f} to {mean_diff + 1.96 * sd_diff:.2f}")
Expected output:
mean difference = 0.08, SD = 0.46
limits of agreement = -0.82 to 0.98
The manual path averages 0.08 units higher, with limits of agreement from -0.82 to 0.98. Whether that bias matters depends on the scale you are working on, which is a judgment you must make and defend.
Cross-Check Tips That Save Time
- Start with a known answer. A sequence of all G and C must give 100% GC content, a 2 × 2 table with equal cells must give an odds ratio of exactly 1, and identical items must give an alpha of 1.
- Keep full precision until the final step, then round once.
- Change one input at a time when results disagree, so the source of the difference localizes quickly.
- Push extreme inputs. Zero counts, negative values, and very long sequences expose hidden limits and division errors.
- Watch locale settings. A spreadsheet or browser set to a region that uses commas as decimal separators can misread pasted values such as 1.5.
- For routine dilution work, the relation C1V1 = C2V2 takes seconds to check by hand, so do it every time until it is habit.
- When you adopt a new bioinformatics calculator for the lab, run it against your current method on ten real inputs before switching.
A sensible next step is to pick the one calculator you rely on most, run the seven-step workflow on it once, and file the log where your lab or study team can find it. Repeat the check whenever the tool changes or you move to a new formula.
Common Mistakes and Limitations
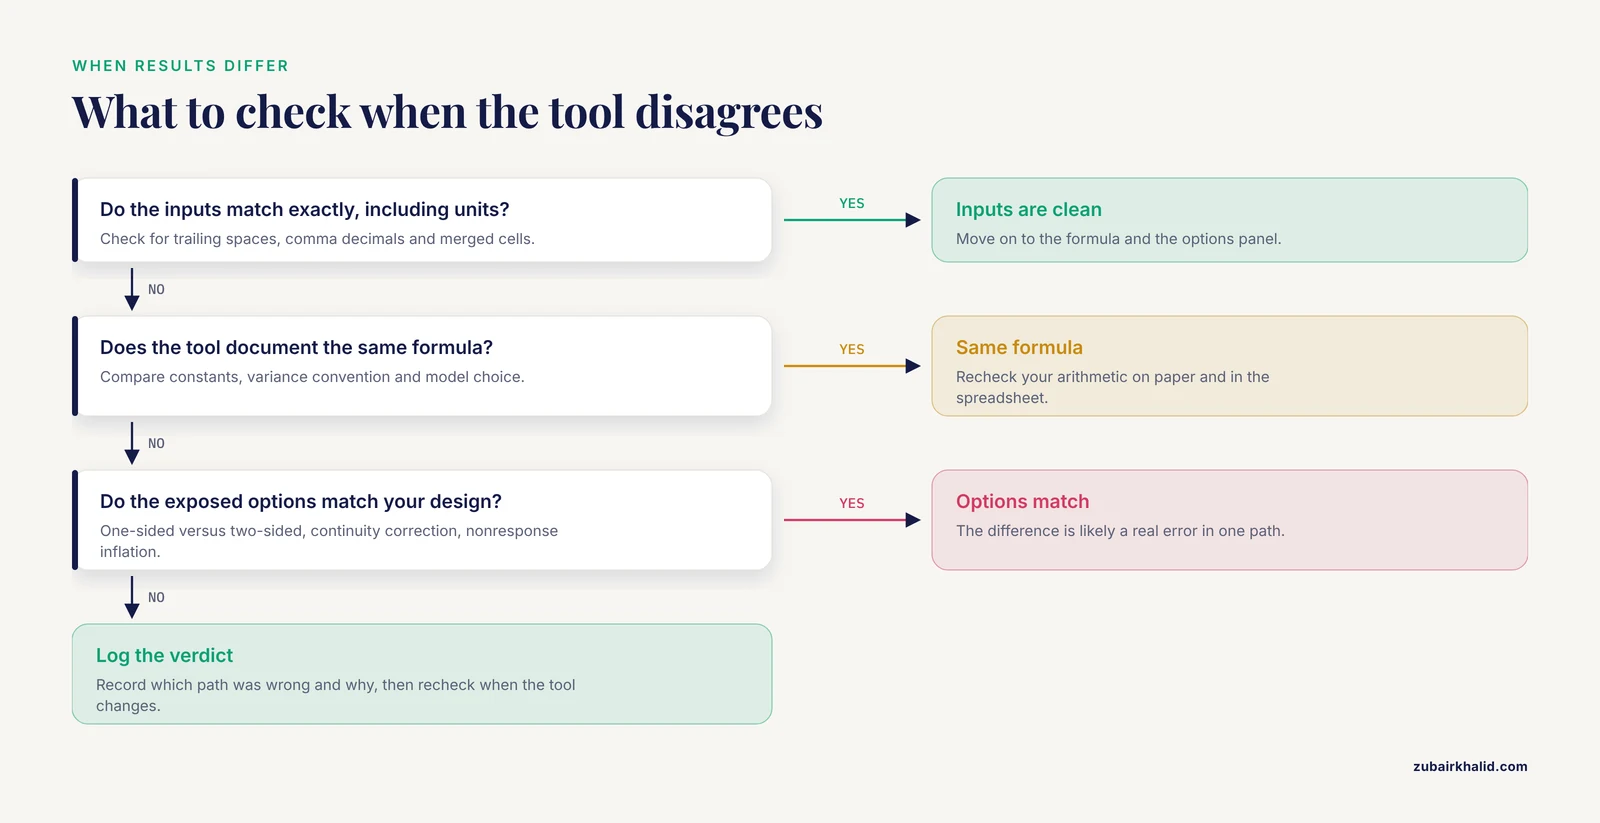
- Comparing different models and calling the difference an error. The Wallace rule and nearest-neighbor thermodynamics answer slightly different questions, and FRAX, QFracture, and Garvan include different variables and age ranges [1]. A mismatch between models is information, not a bug.
- Rounding at intermediate steps. Rounding ln(OR) to 1.73 before computing the interval shifts the limits. Carry guard digits and round once at the end.
- Hidden defaults in sample-size tools. Continuity corrections, one-sided versus two-sided designs, and nonresponse inflation all change the answer while every path remains correct.
- Unrecoded reversed items. If a scale mixes positively and negatively worded items, alpha computed without reverse-scoring understates consistency. Recode first, then calculate.
- Unit slips. Milligrams versus micrograms, base pairs versus kilobases, and copies versus copies per microliter produce errors that can look like plausible outputs. Write units next to every input in your manual work.
- Copy-paste artifacts. Trailing spaces in a pasted sequence, commas as decimal separators, and merged cells in spreadsheets corrupt inputs before any formula runs.
- Trusting a tool outside its evaluated range. Every calculator is valid for the population, value range, and assumptions where it was built and tested. Extrapolation is a new claim that needs new evidence.
- Treating correlation as agreement. A high correlation coefficient can coexist with a consistent bias. Method comparisons need the difference, not just the association.
- Expecting a calculator to fix noisy inputs. A tool multiplies whatever you give it by its formula. Validation studies report the smallest detectable change, the smallest real difference that exceeds measurement noise [6], and that noise passes straight through any calculation.
- Treating one matched pair as proof. A manual check confirms that the tool implements the formula you wrote down. Whether that formula is the right one for your question is a separate decision, and for clinical, diagnostic, or regulatory decisions, individual cases need a qualified professional such as a clinician or a biostatistician.
Frequently Asked Questions
What does it mean to cross-check an online calculator with a manual calculation?
It means recomputing the tool's result independently by hand, in a spreadsheet, and in code, then confirming all paths agree within a stated tolerance. The goal is to catch wrong formulas, wrong units, hidden defaults, and typos before they reach a report.
How close should the two results be before I accept them?
Set the tolerance from the precision you will report, not from perfection. Check an odds ratio to the second decimal place, alpha to the third, GC content exactly, and melting temperature only against the same thermodynamic model.
Why do two online biology calculators give different answers to the same input?
Most often the tools implement different formulas, constants, or default options rather than making an arithmetic error. Read each tool's documented method before treating the difference as a bug.
Do I need to know how to code to cross-check a calculator?
No. Paper plus a spreadsheet catches most errors. Code adds a third independent path and lets you check many inputs at once.
How do I cross-check a bioinformatics calculator?
Feed it a sequence whose answer you can count by hand, such as the GC content of a short oligonucleotide, and confirm which model the tool uses for quantities like melting temperature.
What is a Bland-Altman plot and when do I need one?
It is a plot of the difference between two methods against their average, used when comparing many paired results. Use it to validate a tool across a batch of inputs rather than for a single value.
Can a manual cross-check prove an online calculator is correct?
No. A manual cross-check confirms that the tool agrees with one formula on one set of inputs. Whether that formula suits your question depends on the published evidence behind it.
What should I record in my notebook when I cross-check a calculator?
Record the tool name, URL, access date, documented formula, every input and output from each path, the tolerance you applied, and your verdict.
Sources
- Fracture risk assessment in early-stage autosomal dominant polycystic kidney disease: a cross-sectional study using FRAX(®), QFracture(®), and Garvan models.
- Toward a Predictive Model for Medical Residency Entrance Examination Performance in Brazil: A Preregistered Cross-Sectional Study and Exploratory Prototype Score Calculator.
- A fuzzy multiple-attribute decision-making under Z-number environment for online teaching effectiveness evaluation for college database technology courses.
- Are dental practitioners prepared to recognize stomatognathic movement disorders? A cross-sectional study of knowledge, diagnostic confidence, and educational needs.
- Validity and reliability evaluation of the Functional Assertiveness Scale for community pharmacists: a cross-sectional study.
- Translation, cross-cultural adaptation, and measurement properties of the Back pain knowledge and beliefs survey (BacKS) for the Brazilian population.
- Prevalence of night eating syndrome and associated factors among students at Kolej MARA Kuala Nerang: A cross-sectional study.