Animal Dose Conversion Calculator Errors: Common Fixes
By Dr. Zubair Khalid, DVM, MS, PhD ·
Most animal dose conversion calculator errors trace back to a single cause, and it is rarely the software. The dose was entered, or read out, on a milligram per kilogram (mg/kg) basis when the calculation needed a body surface area (BSA) basis. Translating an animal dose on a mg/kg basis can underestimate toxicity and overestimate the amount needed for human therapy, which is why allometric scaling based on body surface area is the recommended approach [1]. The first thing to check is the dosing basis printed next to the input field and the Km factor the calculator applied. If either one is wrong, every number downstream is wrong, no matter how polished the calculator looks.
This guide is written for students, lab staff, and researchers who use these tools for study design, translational work, or preclinical dose planning. It covers the main causes of animal dose conversion calculator errors, a troubleshooting table you can scan in seconds, fixes ordered from the most common failure to the rarest, and prevention practices you can write into a lab standard operating procedure. It covers both families of calculator you are likely to meet in the life sciences, pharmacologic converters that translate doses between species, and imaging-based dose calculators used in preclinical radiation research.
What These Calculators Actually Compute
A dose conversion tool is a specialized biology calculator. The most common family converts a dose between species or between dose bases. Input is usually a dose in mg/kg for species A, and output is either an mg/kg dose for species B or a dose per unit body surface area in mg/m². The conversion runs on the Km factor, defined as body weight in kilograms divided by body surface area in square meters. Km converts mg/kg into mg/m², and the ratio of two species' Km values converts a dose between them.
Standard reference values make this concrete. A 20 g mouse has a Km of 3, a 200 g rat has a Km of 6, a 1.8 kg rabbit has a Km of 12, a 10 kg dog has a Km of 20, and a 60 kg adult human has a Km of 37. These values come from standard pharmacology references and assume the listed body weights.
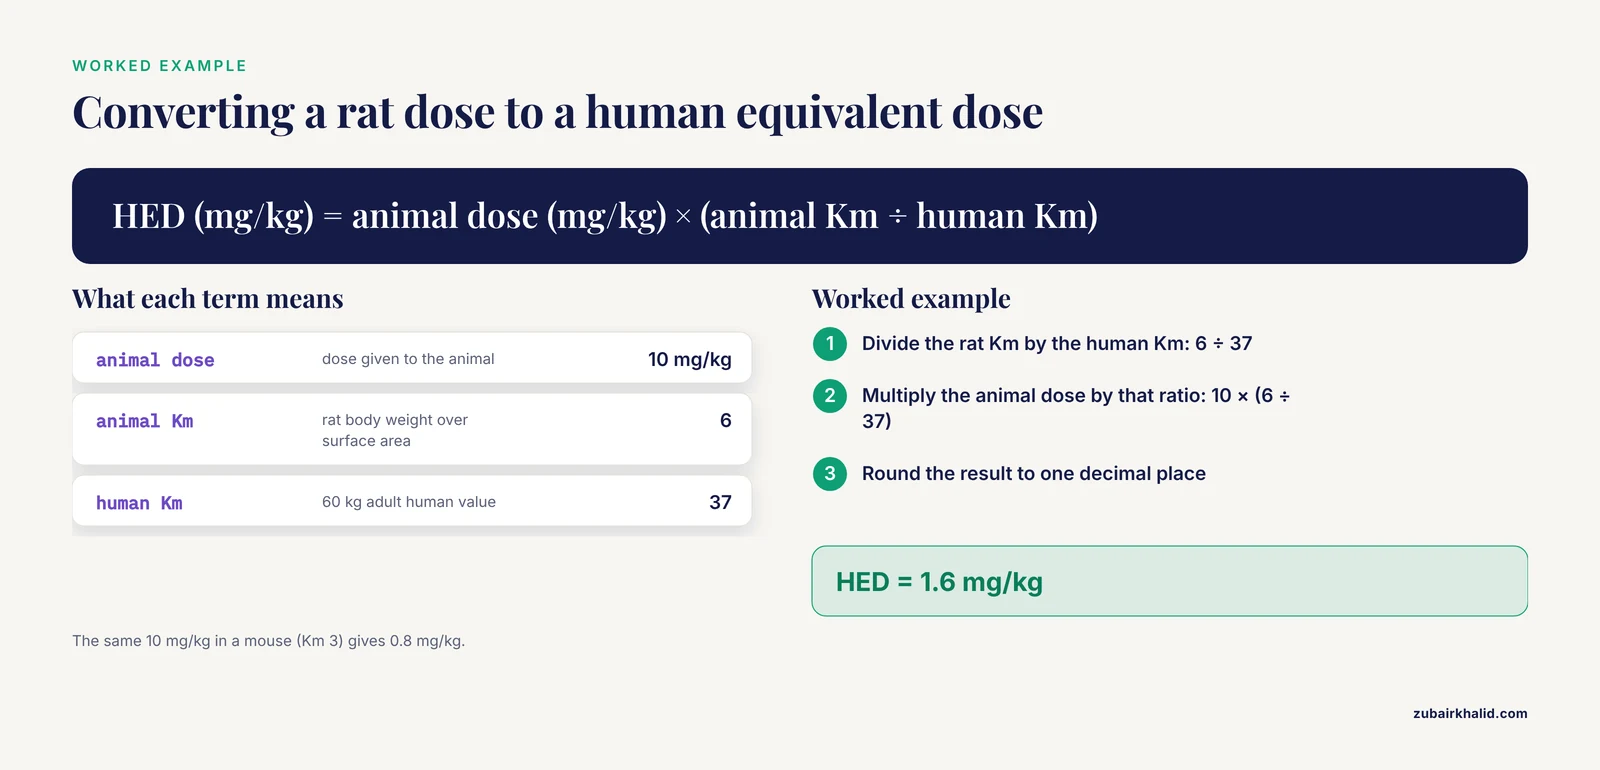
Worked example. A rat study doses at 10 mg/kg. The human equivalent dose (HED) is 10 × (6 ÷ 37) = 1.6 mg/kg. The same 10 mg/kg in a mouse (Km 3) gives an HED of 10 × (3 ÷ 37) = 0.8 mg/kg. If the rat number were copied across as 10 mg/kg for a human, the intended exposure would be exceeded roughly sixfold.
The second family appears in preclinical radiation research. These calculators convert CT numbers, called Hounsfield units (HU), the grayscale values that measure x-ray attenuation, into a stopping power ratio (SPR), which describes how strongly a tissue slows charged particles compared with water [2]. Others compute organ dose rate conversion coefficients for radionuclides using voxel phantoms, 3D body models built from CT slices where each volume element is assigned a tissue type, combined with Monte Carlo transport codes that simulate many individual radiation particles moving through the model [3]. These tools behave like a bioinformatics calculator because they chain image processing, calibration tables, and transport simulation. They fail in the same basic way as the simpler converters, when an assumption baked into the calculation does not match your experiment.
Troubleshooting Animal Dose Conversion Calculators: Quick Reference
The table lists the failure patterns in the order you are likely to meet them. Work top to bottom.
| Symptom | Likely cause | How to confirm | Fix |
|---|---|---|---|
| Human equivalent dose far above published values | mg/kg basis used with no BSA scaling | Recompute with the Km ratio for your species pair | Switch the calculator to BSA mode or apply the Km ratio by hand [1] |
| Output jumps when body weight changes by a few grams | Wrong species preset, or weight outside the validated range | Read the Km value the calculator prints, then re-weigh the animal | Enter weight in kilograms and confirm the species-specific Km [4] |
| Dose per animal off by roughly 1,000-fold | Milligram versus microgram, or gram versus kilogram, mismatch | Hand-calculate one animal from first principles | Correct the unit on the input before converting |
| Feed-study dose does not match the input field | Dose reported as mg/kg of feed, not mg/kg of body weight | Check the methods section for the dosing basis | Convert feed concentration to intake per body weight first [5] |
| Proton plan overshoots or undershoots the target | HU-to-SPR calibration curve mismatched to scanner or tissue | Scan a calibration phantom and compare error metrics | Recalibrate at your kVp settings, and prefer dual-energy calibration for soft tissue and bone [2] |
| Dose distribution shifts near bone on MRI-based planning | Bone contour segmentation error | Compare contour edges with a physical measurement or higher-resolution image | Correct the contour, small outline errors already move the dose by measurable amounts [6] |
| Organ dose rates differ between two programs | Different phantoms, geometries, or daughter-product handling | Compare the method documentation and phantom definitions | Choose one documented method and report it in your methods section [7] |
| Paired-organ dose looks too high or too low | Geometry approximations for paired or irregular organs | Check whether the phantom models each organ separately | Use species-specific voxel phantom coefficients where they exist [3] |
| Single and fractionated schedules look wrongly equivalent | Linear-quadratic model applied outside its reliable range | Compare against a measured endpoint such as colony survival | Restrict the model to its validated dose range [8] |
| Chronic safe-dose estimate looks unrealistic | Acute-to-chronic extrapolation with the wrong conversion factor | Check which input type the factor expects | Use a subacute NOAEL with its matching conversion factor where possible [9] |
Animal Dose Conversion Calculator Errors: Causes and Mechanisms
1. A Milligram per Kilogram Basis Where Body Surface Area Is Needed
Body surface area scales with body mass to roughly the two-thirds power, so a small animal presents far more surface, and far more metabolic capacity, per kilogram than a large one. A dose number that describes a modest exposure in a mouse describes a much larger relative exposure in a human if it is copied across as mg/kg. In work with medicinal herbs, the most common mistake in designing or translating an animal study is exactly this, a mg/kg basis, which can underestimate toxicity and overestimate the amount needed for human therapy [1].
The fix is to convert through body surface area. HED (mg/kg) = animal dose (mg/kg) × (animal Km ÷ human Km). A 10 mg/kg rat dose becomes 1.6 mg/kg for a 60 kg adult, as the worked example above shows. The quantity that stays roughly constant across species under this model is the mg/m² dose, not the mg/kg dose.
A conversion error involving a cytotoxic compound is a safety issue as well as a data issue, so any conversion intended for clinical exposure must be verified by the responsible clinician or pharmacist before it is used.
2. A Wrong or Mismatched Km Factor
Km depends on both body weight and measured body surface area, so a calculator preset built on a standard weight may not match your animal. Km values are also not universal constants. They depend on how surface area was measured and on how the factor is defined, and definitions differ between papers. The tree shrew conversion study measured body surface area with image analysis software, reported an average Km of 0.105 ± 0.001 on that study's own scale, and derived the equivalent tree shrew dose from a 200 g rat as D-ts = 1.36 × D-a [4]. Two lessons follow. Use species-specific measured values when they exist, and check which Km definition your calculator uses before you compare its output with a published number.
Weight range matters as much as species. The tree shrew conversion kept its error below 10% only for body weights between 0.09 and 0.15 kg [4]. Outside a validated window the error grows, and no calculator warns you on its own.
3. Unit and Entry Mistakes
The classic failures are milligram versus microgram, gram versus kilogram, pounds versus kilograms, dose per animal versus dose per kilogram, and dose per cage versus dose per animal. Each one slips past a calculator because the tool converts whatever number it is given. A dose of 5 mg/kg entered as 5 g/kg is a thousandfold overdose on paper, and the software will not flag it because the number is valid. The fix costs two minutes. Pick one animal, write the full chain on paper from stock concentration to delivered dose, and compare each step with the calculator's intermediate values.
4. Diet-Based Dosing Read as Body-Weight Dosing
Nutrition and feed-additive studies usually express dose as mg/kg of diet, not mg/kg of body weight. A rabbit heat-stress study, for example, supplemented feed with luteolin-loaded chitosan nanoparticles at 25, 50, and 100 mg/kg of diet and observed a quadratic dose-response in growth performance [5]. A calculator expecting mg/kg of body weight will misread those numbers unless you first convert feed concentration into actual intake, which requires measured feed intake and body weight for the animals in question.
5. Calibration Curve Errors in Imaging-Based Dose Calculation
In preclinical proton therapy, the calculator converts Hounsfield units into a stopping power ratio, the property that determines how much a proton slows in each voxel. The conversion relies on a calibration curve built from a phantom scan, and the curve is a known weak point. Hounsfield look-up tables are institution-specific and a recognized source of systematic error in treatment planning [10].
Calibration quality is measurable. On a small-animal dual-energy cone-beam CT system, a CT design common on preclinical imaging platforms, calibrated with a CIRS 062M electron density phantom at 40 and 60 kVp, dual-energy calibration reached a root mean square error (RMSE, a single number describing average calibration error) of 0.25% for soft tissue and 1.08% for bone, better than the single-energy values of 0.87% and 1.44%. For high-density materials with relative electron density above 2, meaning electron density relative to water, single-energy calibration did better, 4.19% versus 5.42% [2]. Multi-energy element-resolved CBCT goes further, combining 30, 40, and 60 kVp scans with corrections for detector lag, glare, and beam hardening before Monte Carlo dose calculation [11].
Two benchmarks help you judge your own system. Water equivalent path length (WEPL), the thickness of water that would slow protons by the same amount, was measured directly on animal tissue samples and agreed with stoichiometric calibration predictions within about ±0.3% for biological tissue and ±0.5% for phantom inserts [12]. End-to-end tests with heterogeneous animal tissue then catch range errors that a calibration curve alone hides [13].
Safety note. Small-animal CT requires anesthesia, so every scan needs a warming and monitoring plan approved for the species. Platforms that deliver radiation are restricted to trained personnel working under an approved protocol.
6. Segmentation and Contour Errors
The outline of a structure is an input to the dose calculation. In MRI-based pseudo-CT planning, where MRI intensity values are converted into Hounsfield units, a systematic 1 mm error in the bone segment changed the calculated prostate dose by roughly 0.4% [6]. Small animals shrink that margin, because bones a fraction of a millimeter thick are common and a 1 mm outline error is a large fraction of the structure. Pixel size sets the floor for contour accuracy, and the phantom work behind that 0.4% figure resolved bone edges correctly within a 1 mm pixel size [6]. The fix is to check contours against a physical measurement or a higher-resolution sequence, and to keep pixel size consistent across a study.
7. Phantom and Geometry Mismatch in Organ Dose Models
Organ dose rate conversion coefficients depend on the phantom the model uses. A voxel phantom built from CT images of a roughly 10 kg male Japanese macaque, with Monte Carlo transport run at better than 1% statistical precision, showed beta energy deposits nearly identical to rhesus monkey values. Gamma self-absorption matched an approximate curve with an average deviation of 2%, but the kidney deviated by up to 12%, because it is a paired organ and energy is lost between the two parts [3]. The fix is to use species-specific coefficients where they exist and to expect paired or irregularly shaped organs to carry the largest error.
8. Model Choice and Inter-Model Variation
Two calculators can disagree without either being broken. In an intercomparison of 10 approaches for calculating whole-body absorbed dose rates across 74 radionuclides and five reference animals and plants, 70% of internal exposure results fell within ±20% of one another, while external exposure spread wider, with 90% of estimates within an order of magnitude. The variation traced to methodological differences, including how many daughter products were included, source-target geometry, nuclear databases, and rounding errors in integration algorithms [7].
Radiobiologic equivalence models carry the same risk. The linear-quadratic (LQ) formalism estimates biologically equivalent doses using the alpha/beta ratio, a measure of how sensitive a tissue's dose response is to fraction size. With alpha/beta ratios of 5.1 Gy for V79 cells and 0.36 Gy for EMT6 cells, LQ-calculated equivalent single doses for hypofractionated schedules came out 12 to 19% lower than the doses actually measured to produce the same survival in V79 cells [8]. The fix is to document which model your calculator implements and to confirm unusual schedules against a measured endpoint.
9. The Wrong Extrapolation Conversion Factor
Extrapolating from short-term toxicity data to a chronic safe level uses conversion factors, and the factor must match the input type. The no-observed-adverse-effect level (NOAEL) is the highest dose producing no observable harm, and the LD50 is the dose lethal to 50% of test animals. Across 332 compounds, a conversion factor of 87 applied to a subacute NOAEL gave a conservative estimate of the chronic NOAEL, while a factor of 1.7 × 10^4 was needed for an LD50 input, and the subacute NOAEL predicted the chronic value better than the LD50 did [9]. Feeding an LD50 into a field that expects a NOAEL multiplies the error silently. The fix is to check which input type your calculator's factor assumes before you trust the output.
10. Output Read Out of Biological Context
The rarest failure is a correct number interpreted without its context. Parasitology offers a sharp example. Published stage-conversion times for Toxoplasma gondii in mice carried errors traceable to delays in dissemination of the infection, and reactivation after corticosteroid dosing depended on the daily dose, the type of steroid, whether it was an alcohol or an ester, its solubility, the route, and the host [14]. A calculator cannot know any of that. The fix is to read its output together with route, formulation, host factors, and timing, and to treat the number as one input to a biological judgment rather than the judgment itself.
How to Fix Animal Dose Conversion Calculator Errors: A Diagnostic Sequence
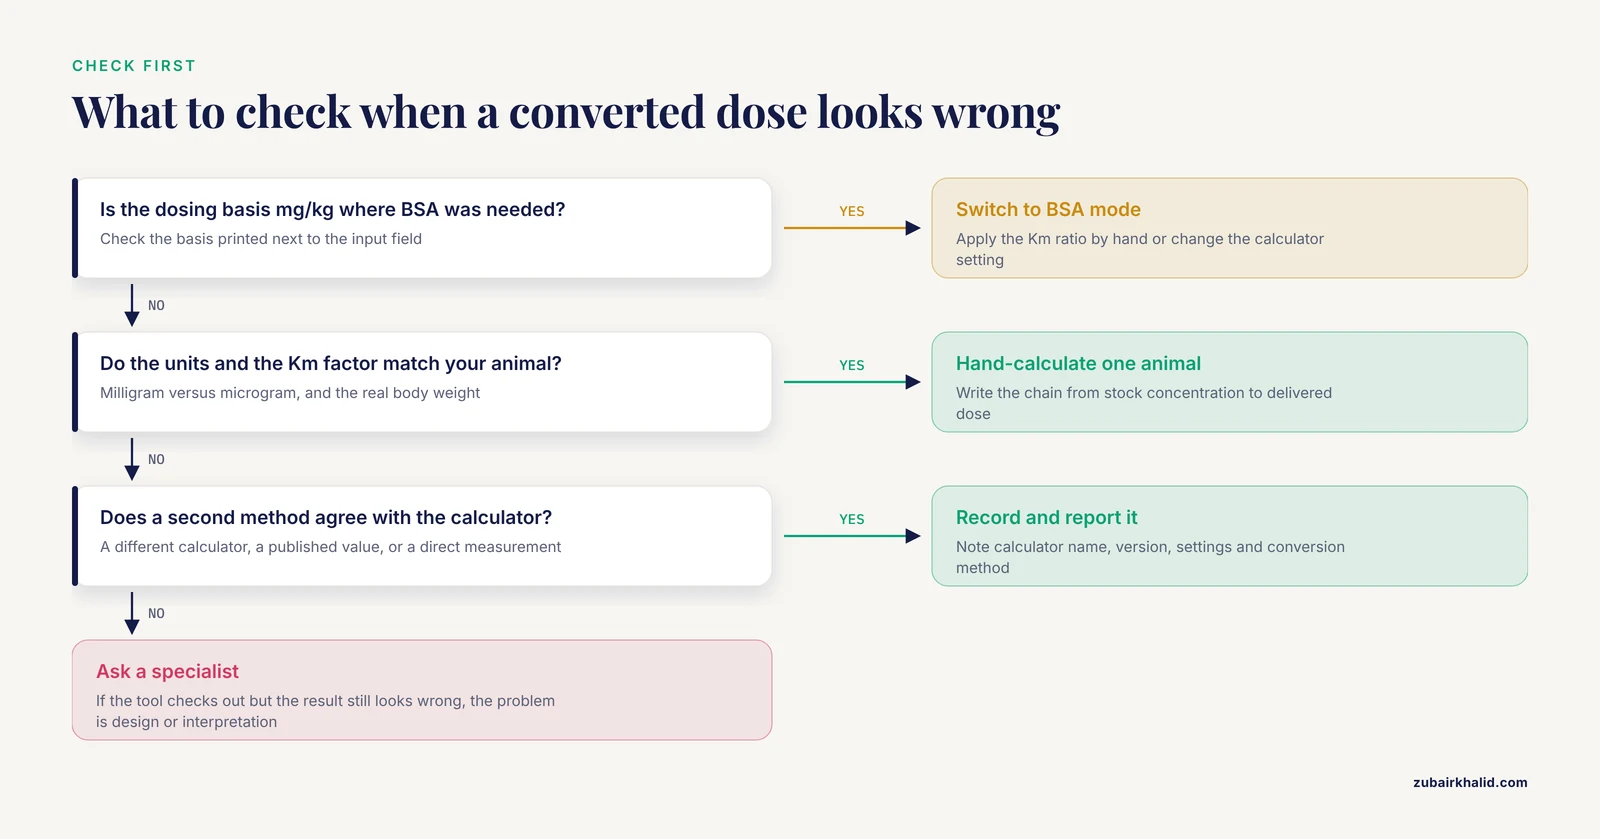
Work through these steps in order. Most errors are found by step 4.
- Write down the direction of conversion, from species, dose basis, and body weight to species, dose basis, and body weight. Ambiguity here causes most failures.
- Confirm the dosing basis of the source number, whether mg/kg of body weight, mg/m², mg/kg of feed, or mg per animal.
- Check the Km factor and the body weight the calculator used, and confirm the Km definition matches the one behind any published value you are comparing with.
- Hand-calculate one animal end to end, from stock concentration to delivered dose, and compare each step with the calculator.
- For imaging-based calculators, scan a calibration phantom at your working kVp and compare the error metrics against published benchmarks.
- Compare the result with a second independent method, a different calculator, a published value, or a direct measurement.
- Record the calculator name, version, settings, and conversion method in your lab notebook so the number can be reproduced and audited.
Common Mistakes and Limitations
- Expecting BSA conversion to remove all error. Differences in the pharmacokinetic and pharmacodynamic phases between species leave some extrapolation error no matter which conversion method you use [1]. Allometric scaling fixes the largest systematic error, not every error.
- Trusting species presets. A preset Km assumes a standard weight, and lab strains, ages, and sexes vary. Re-weigh the animal and enter the real value.
- Borrowing Km values between papers without checking definitions. Km depends on how surface area was measured, and different publications use different scales.
- Mixing dosing bases. Feed concentration, body weight dose, and surface area dose are three different numbers that look alike in print.
- Copying calibration curves between scanners or kVp settings. Look-up tables are institution-specific for a reason [10].
- Applying the linear-quadratic model outside its validated range, where it can understate the single dose needed to match a fractionated schedule [8].
- Treating calculator output as context-free. Route, formulation, host factors, and timing change the biology the number is meant to describe [14].
- One boundary worth stating plainly. Calculators support research and planning, they do not replace professional judgment, and any individual animal treatment decision needs a veterinarian or pharmacologist.
Preventing Dose Conversion Errors Before They Happen
Most animal dose conversion calculator errors have straightforward solutions, and nearly all of them are procedural rather than technical.
Lock the units in your standard operating procedure. Body weight in kilograms, dose in mg/kg or mg/m², feed dose labeled explicitly as mg/kg of diet. Re-weigh animals rather than assuming preset weights, and confirm that each conversion you use has been validated across the weight range you are working in [4].
For imaging-based dose calculation, put phantom scans on a scheduled quality assurance calendar. Recalibrate at your working kVp settings, prefer dual-energy calibration where soft tissue and bone accuracy matter [2], keep the corrections for detector lag, glare, and beam hardening in place [11], and verify the full chain end to end with tissue-equivalent materials [13] or real tissue samples [12].
Use species-specific measured coefficients where they exist, whether voxel phantom dose coefficients for a new species [3] or measured Km values for an uncommon experimental animal [4].
Build internal reference checks into quantitative work. A standardizing factor, a reference measurement taken under identical conditions alongside your samples, exposes drift and error before results are interpreted, the same logic that let radioautography studies correct their counts against a labeled reference band and improve their precision [15].
Report the conversion method in every publication. State the Km values, the dosing basis, the calibration curve, and the calculator version. Readers reproducing your work inherit your assumptions, so make them visible.
Frequently Asked Questions
Why does my calculated human equivalent dose disagree with a published paper?
Most disagreements come from a mismatch in method, not arithmetic. The paper probably used a body surface area conversion while your calculation used a mg/kg basis, or the two used different Km factors, body weights, or Km definitions. Check the dosing basis and the Km values on both sides first.
What is a Km factor in dose conversion?
Km is the ratio of body weight in kilograms to body surface area in square meters. It converts a mg/kg dose into a mg/m² dose, and the ratio of the Km values for two species converts a dose between them.
Can I convert an animal dose to a human dose by dividing by one fixed number?
No. The conversion depends on the species pair and on the body weights involved, so a single divisor cannot be correct across animals. Use the Km ratio for your specific species and weights, and confirm the weights fall inside the validated range of the conversion.
Why do two dose conversion calculators give different answers for the same input?
Different calculators implement different models, Km definitions, phantoms, or calibration curves. Cross-calculator disagreement usually signals a difference in assumptions rather than a bug in one tool, so identify and document the method behind the number you report.
How accurate is body surface area dose conversion?
It removes the largest systematic error, the mg/kg basis mistake, but it cannot remove all of it. Differences in pharmacokinetics and pharmacodynamics between species leave some extrapolation error regardless of the conversion method.
What is an HU-to-stopping-power calibration error?
It is a mismatch between the curve that converts CT Hounsfield units into proton stopping power and the actual scanner settings or tissue being imaged. Recalibrating with a phantom matched to your kVp settings corrects it, and dual-energy calibration improves soft tissue and bone accuracy further.
What should I check first when a dose conversion calculator gives a strange result?
Check the dosing basis, the units, and the Km factor or calibration curve the calculator applied. Then hand-calculate one animal end to end and compare each step with the tool to find where the numbers diverge.
When should I stop troubleshooting a dose conversion calculator and ask a specialist?
When a hand calculation or a phantom check confirms the calculator is working but the result still looks wrong, the problem is usually experimental design or interpretation rather than the tool. Bring in a veterinarian, pharmacologist, or medical physicist at that point.
Sources
- Animal studies on medicinal herbs: predictability, dose conversion and potential value.
- Development of a dual-energy CBCT calibration method for accurate electron density estimation in preclinical small-animal proton therapy dose planning.
- Internal organ dose rate conversion coefficients of Japanese macaques to 134Cs,137Cs and 131I†.
- Body surface area-based equivalent dose calculation in tree shrew.
- Dose-response effects of dietary luteolin-loaded chitosan nanoparticles on growth and physiological responses of post-weaning rabbits reared under summer heat stress.
- Influence of MRI-based bone outline definition errors on external radiotherapy dose calculation accuracy in heterogeneous pseudo-CT images of prostate cancer patients.
- The estimation of absorbed dose rates for non-human biota: an extended intercomparison.
- Estimation of errors associated with use of linear-quadratic formalism for evaluation of biologic equivalence between single and hypofractionated radiation doses: an in vitro study.
- Conversion factors estimating indicative chronic no-observed-adverse-effect levels from short-term toxicity data.
- Validation of the proton range accuracy and optimization of CT calibration curves utilizing range probing.
- Improving dose calculation accuracy in preclinical radiation experiments using multi-energy element resolved cone-beam CT.
- Investigation of real tissue water equivalent path lengths using an efficient dose extinction method.
- Experimental verification of the proton range using heterogeneous animal tissue.
- The stage-conversion time of Toxoplasma gondii: interpretation of chemical-biologic data out of parasitologic or host context.
- Radioautography of rat incisor dentin as a continuous record of the incorporation of a single dose of 3H-labeled proline and tyrosine.